

Key Insights
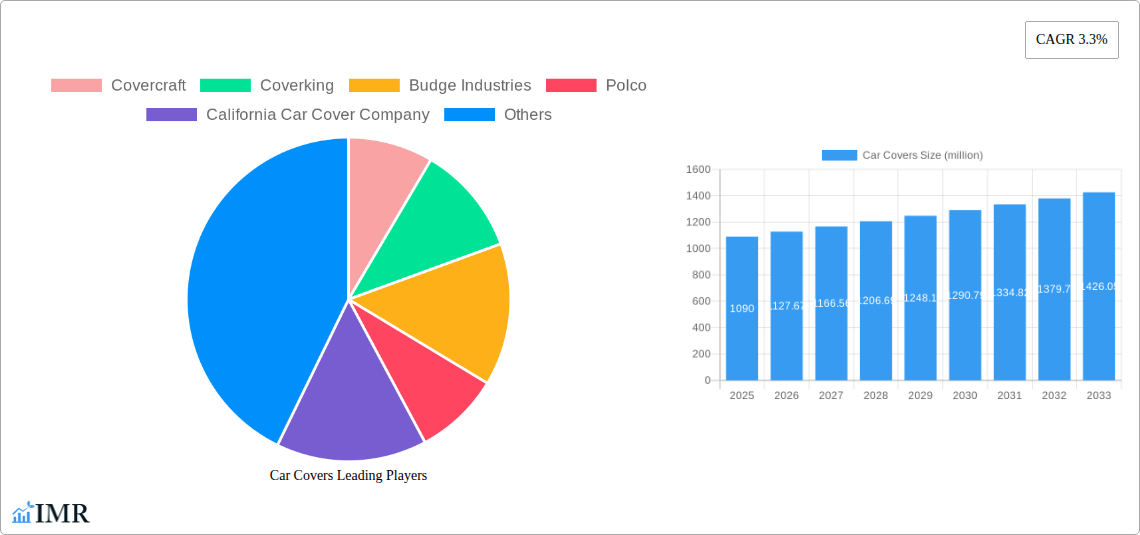
The global car cover market, valued at $1090 million in 2025, is projected to experience steady growth, driven by increasing vehicle ownership, particularly in developing economies, and a rising consumer preference for vehicle protection against harsh weather conditions, UV damage, and vandalism. The market's Compound Annual Growth Rate (CAGR) of 3.3% from 2025 to 2033 indicates a consistent expansion, albeit moderate, suggesting a mature but still evolving market. Key drivers include the growing popularity of customized car covers tailored to specific vehicle models, the increasing availability of technologically advanced materials offering enhanced protection and durability (e.g., breathable fabrics, waterproof coatings), and the rising demand for car covers among automotive enthusiasts and collectors. While the market faces constraints such as the relatively low replacement rate of car covers and potential price sensitivity among consumers, the overall trend points towards continued expansion, particularly in segments offering premium features and customization options. The competitive landscape is diverse, with established players like Covercraft and Coverking competing alongside regional brands. Innovation in materials and design, coupled with strategic marketing efforts targeting specific vehicle segments and consumer demographics, will be key differentiators for success in this market.
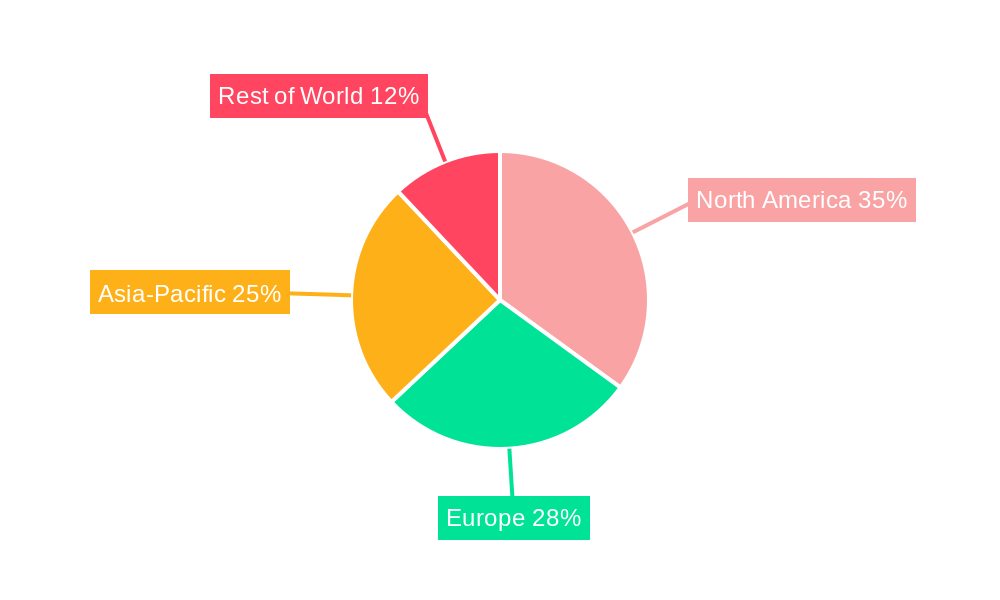
The market segmentation likely includes various categories based on material (e.g., polyester, nylon, cotton), vehicle type (cars, SUVs, trucks), cover type (indoor, outdoor, custom-fit), and price range (budget-friendly to premium). Regional variations in market size will likely be influenced by factors such as vehicle ownership rates, climate conditions, and consumer purchasing power. North America and Europe are expected to represent substantial market shares due to high vehicle ownership and developed automotive aftermarket industries. However, growth potential in Asia-Pacific and other developing regions is significant, fueled by increasing car ownership and rising disposable incomes. Future market developments will be shaped by technological advancements in material science, the emergence of sustainable and eco-friendly car cover options, and the ongoing evolution of consumer preferences regarding vehicle aesthetics and protection.
Car Covers Market Report: 2019-2033 - A Comprehensive Analysis
This comprehensive report provides an in-depth analysis of the global car covers market, encompassing historical data (2019-2024), current estimations (2025), and future projections (2025-2033). The study meticulously examines market dynamics, growth trends, leading players (including Covercraft, Coverking, Budge Industries, and more), and emerging opportunities across diverse segments. This report is invaluable for industry professionals, investors, and strategic decision-makers seeking to understand and capitalize on the evolving car covers landscape. The market is expected to reach xx million units by 2033.
Car Covers Market Dynamics & Structure
The global car covers market is characterized by moderate concentration, with a few major players holding significant market share, while numerous smaller companies cater to niche segments. Technological innovation, primarily focused on material advancements (e.g., waterproof, breathable fabrics) and customization options, is a key driver. Regulatory frameworks related to material safety and environmental impact are increasingly influencing manufacturing processes. Competitive substitutes, such as carports and garages, pose a challenge, particularly in regions with robust infrastructure. The end-user demographic is broad, encompassing individual car owners, dealerships, and rental agencies. Mergers and acquisitions (M&A) activity has been relatively low in recent years (xx deals between 2019-2024), indicating a stable, though potentially consolidating, market.
- Market Concentration: Moderately concentrated, with top 5 players holding approximately xx% market share in 2025.
- Technological Innovation: Focus on waterproof, breathable fabrics; customized fits; UV protection enhancements.
- Regulatory Framework: Growing emphasis on sustainable materials and manufacturing processes.
- Competitive Substitutes: Carports, garages, indoor parking facilities.
- End-User Demographics: Individual car owners, dealerships, rental agencies, automotive detailers.
- M&A Activity: Relatively low; xx deals recorded between 2019 and 2024. Consolidation potential exists.
Car Covers Growth Trends & Insights
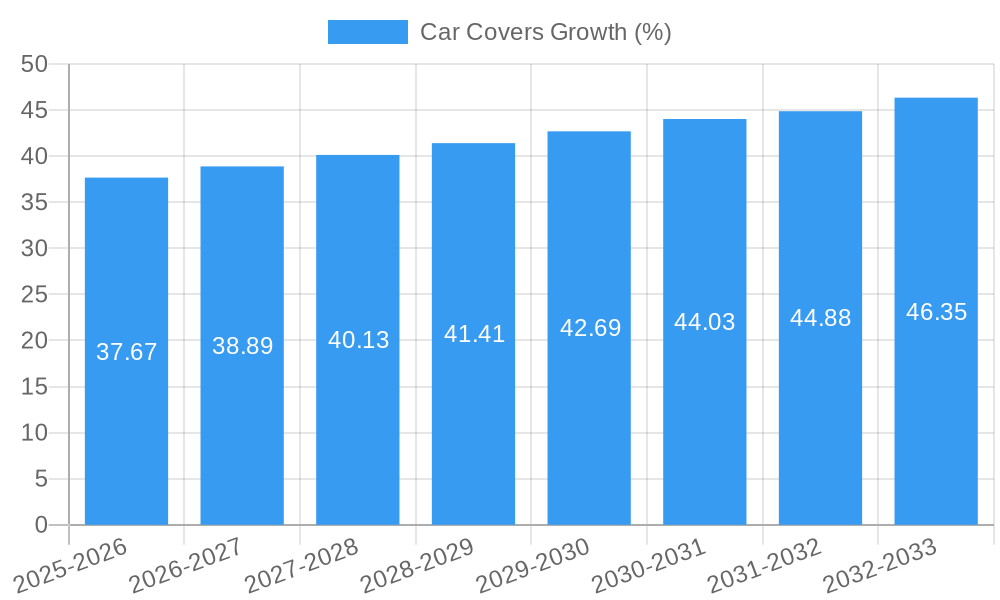
The global car covers market experienced a CAGR of xx% during the historical period (2019-2024), reaching an estimated xx million units in 2025. Adoption rates are particularly high in regions with harsh weather conditions and high vehicle ownership. Technological disruptions, such as the introduction of smart car covers with integrated sensors, are expected to drive further growth. Consumer behavior is shifting towards premium, customized products with enhanced features. The forecast period (2025-2033) anticipates a CAGR of xx%, driven by increasing vehicle sales, rising disposable incomes in emerging economies, and growing awareness of vehicle protection. Market penetration is projected to increase to xx% by 2033. The rise of e-commerce is also significantly impacting sales channels.
Dominant Regions, Countries, or Segments in Car Covers
North America currently dominates the global car covers market, driven by high vehicle ownership rates, a strong automotive aftermarket, and favorable economic conditions. Within North America, the United States holds the largest market share. Key drivers include robust consumer spending, well-established distribution networks, and a large base of existing car owners. The Asia-Pacific region presents significant growth potential, fueled by increasing car sales and rising disposable incomes. Europe shows steady growth, driven by environmental concerns and the increasing adoption of premium car covers.
- North America (US): High vehicle ownership, strong aftermarket, favorable economic conditions.
- Asia-Pacific: Rapidly growing vehicle sales, rising disposable incomes, expanding middle class.
- Europe: Steady growth, driven by environmental concerns and premium product demand.
- Market Share: North America holds approximately xx% of the global market in 2025.
Car Covers Product Landscape
The car covers market offers a wide range of products, from basic indoor covers to highly specialized outdoor covers incorporating advanced materials like waterproof, breathable fabrics and UV protection layers. Innovations focus on improved fit, durability, and ease of use. Custom-fit covers are gaining popularity, reflecting consumer preferences for tailored protection. Performance metrics emphasize tear resistance, water resistance, UV protection, and breathability. Unique selling propositions frequently highlight specialized features and enhanced material properties.
Key Drivers, Barriers & Challenges in Car Covers
Key Drivers: Growing vehicle ownership globally, increasing consumer awareness of vehicle protection needs, technological advancements leading to improved product features, and the growing popularity of customized car covers.
Key Challenges & Restraints: Fluctuating raw material prices, intense competition from numerous players, the potential impact of economic downturns on consumer spending, and the availability of substitute options. Supply chain disruptions caused by geopolitical events could also impact market growth, potentially increasing production costs by xx%.
Emerging Opportunities in Car Covers
Emerging opportunities lie in the development of smart car covers integrating sensors and connectivity features, the expansion into untapped markets in developing economies, and the growth of e-commerce platforms specializing in custom-fit covers. The increasing demand for sustainable and eco-friendly materials presents further opportunities for innovation.
Growth Accelerators in the Car Covers Industry
Technological advancements in material science, strategic partnerships between manufacturers and automotive companies, and expansion into new geographic markets are key growth accelerators. Innovative marketing strategies and strong brand building are also pivotal in driving market expansion.
Key Players Shaping the Car Covers Market
- Covercraft
- Coverking
- Budge Industries
- Polco
- California Car Cover Company
- Rampage Products
- A1 Car Covers
- Intro-Tech
- Coverwell
- Classic Additions
- Mingfeng
- Blue-sky
- Dalian RunDe
- Zhongda
- Xuantai
Notable Milestones in Car Covers Sector
- 2020: Introduction of the first commercially available smart car cover with integrated sensors.
- 2022: Coverking launches a new line of sustainable car covers made from recycled materials.
- 2023: Several mergers and acquisitions consolidate smaller players within the market.
In-Depth Car Covers Market Outlook
The future of the car covers market is promising, driven by continued growth in vehicle ownership, technological innovation, and the rising demand for high-quality, customized products. Strategic partnerships and expansion into untapped markets will play a crucial role in shaping future market dynamics. The market is expected to witness significant growth over the next decade, presenting attractive opportunities for businesses in the automotive aftermarket.
Car Covers Segmentation
-
1. Application
- 1.1. Individual
- 1.2. Vehicle Manufacturers & 4S Store
- 1.3. Others
-
2. Type
- 2.1. Custom Car Covers
- 2.2. Universal Car Covers
Car Covers Segmentation By Geography
-
1. North America
- 1.1. United States
- 1.2. Canada
- 1.3. Mexico
-
2. South America
- 2.1. Brazil
- 2.2. Argentina
- 2.3. Rest of South America
-
3. Europe
- 3.1. United Kingdom
- 3.2. Germany
- 3.3. France
- 3.4. Italy
- 3.5. Spain
- 3.6. Russia
- 3.7. Benelux
- 3.8. Nordics
- 3.9. Rest of Europe
-
4. Middle East & Africa
- 4.1. Turkey
- 4.2. Israel
- 4.3. GCC
- 4.4. North Africa
- 4.5. South Africa
- 4.6. Rest of Middle East & Africa
-
5. Asia Pacific
- 5.1. China
- 5.2. India
- 5.3. Japan
- 5.4. South Korea
- 5.5. ASEAN
- 5.6. Oceania
- 5.7. Rest of Asia Pacific
Car Covers REPORT HIGHLIGHTS
| Aspects | Details |
|---|---|
| Study Period | 2019-2033 |
| Base Year | 2024 |
| Estimated Year | 2025 |
| Forecast Period | 2025-2033 |
| Historical Period | 2019-2024 |
| Growth Rate | CAGR of 3.3% from 2019-2033 |
| Segmentation |
|
Table of Contents
- 1. Introduction
- 1.1. Research Scope
- 1.2. Market Segmentation
- 1.3. Research Methodology
- 1.4. Definitions and Assumptions
- 2. Executive Summary
- 2.1. Introduction
- 3. Market Dynamics
- 3.1. Introduction
- 3.2. Market Drivers
- 3.3. Market Restrains
- 3.4. Market Trends
- 4. Market Factor Analysis
- 4.1. Porters Five Forces
- 4.2. Supply/Value Chain
- 4.3. PESTEL analysis
- 4.4. Market Entropy
- 4.5. Patent/Trademark Analysis
- 5. Global Car Covers Analysis, Insights and Forecast, 2019-2031
- 5.1. Market Analysis, Insights and Forecast - by Application
- 5.1.1. Individual
- 5.1.2. Vehicle Manufacturers & 4S Store
- 5.1.3. Others
- 5.2. Market Analysis, Insights and Forecast - by Type
- 5.2.1. Custom Car Covers
- 5.2.2. Universal Car Covers
- 5.3. Market Analysis, Insights and Forecast - by Region
- 5.3.1. North America
- 5.3.2. South America
- 5.3.3. Europe
- 5.3.4. Middle East & Africa
- 5.3.5. Asia Pacific
- 5.1. Market Analysis, Insights and Forecast - by Application
- 6. North America Car Covers Analysis, Insights and Forecast, 2019-2031
- 6.1. Market Analysis, Insights and Forecast - by Application
- 6.1.1. Individual
- 6.1.2. Vehicle Manufacturers & 4S Store
- 6.1.3. Others
- 6.2. Market Analysis, Insights and Forecast - by Type
- 6.2.1. Custom Car Covers
- 6.2.2. Universal Car Covers
- 6.1. Market Analysis, Insights and Forecast - by Application
- 7. South America Car Covers Analysis, Insights and Forecast, 2019-2031
- 7.1. Market Analysis, Insights and Forecast - by Application
- 7.1.1. Individual
- 7.1.2. Vehicle Manufacturers & 4S Store
- 7.1.3. Others
- 7.2. Market Analysis, Insights and Forecast - by Type
- 7.2.1. Custom Car Covers
- 7.2.2. Universal Car Covers
- 7.1. Market Analysis, Insights and Forecast - by Application
- 8. Europe Car Covers Analysis, Insights and Forecast, 2019-2031
- 8.1. Market Analysis, Insights and Forecast - by Application
- 8.1.1. Individual
- 8.1.2. Vehicle Manufacturers & 4S Store
- 8.1.3. Others
- 8.2. Market Analysis, Insights and Forecast - by Type
- 8.2.1. Custom Car Covers
- 8.2.2. Universal Car Covers
- 8.1. Market Analysis, Insights and Forecast - by Application
- 9. Middle East & Africa Car Covers Analysis, Insights and Forecast, 2019-2031
- 9.1. Market Analysis, Insights and Forecast - by Application
- 9.1.1. Individual
- 9.1.2. Vehicle Manufacturers & 4S Store
- 9.1.3. Others
- 9.2. Market Analysis, Insights and Forecast - by Type
- 9.2.1. Custom Car Covers
- 9.2.2. Universal Car Covers
- 9.1. Market Analysis, Insights and Forecast - by Application
- 10. Asia Pacific Car Covers Analysis, Insights and Forecast, 2019-2031
- 10.1. Market Analysis, Insights and Forecast - by Application
- 10.1.1. Individual
- 10.1.2. Vehicle Manufacturers & 4S Store
- 10.1.3. Others
- 10.2. Market Analysis, Insights and Forecast - by Type
- 10.2.1. Custom Car Covers
- 10.2.2. Universal Car Covers
- 10.1. Market Analysis, Insights and Forecast - by Application
- 11. Competitive Analysis
- 11.1. Global Market Share Analysis 2024
- 11.2. Company Profiles
- 11.2.1 Covercraft
- 11.2.1.1. Overview
- 11.2.1.2. Products
- 11.2.1.3. SWOT Analysis
- 11.2.1.4. Recent Developments
- 11.2.1.5. Financials (Based on Availability)
- 11.2.2 Coverking
- 11.2.2.1. Overview
- 11.2.2.2. Products
- 11.2.2.3. SWOT Analysis
- 11.2.2.4. Recent Developments
- 11.2.2.5. Financials (Based on Availability)
- 11.2.3 Budge Industries
- 11.2.3.1. Overview
- 11.2.3.2. Products
- 11.2.3.3. SWOT Analysis
- 11.2.3.4. Recent Developments
- 11.2.3.5. Financials (Based on Availability)
- 11.2.4 Polco
- 11.2.4.1. Overview
- 11.2.4.2. Products
- 11.2.4.3. SWOT Analysis
- 11.2.4.4. Recent Developments
- 11.2.4.5. Financials (Based on Availability)
- 11.2.5 California Car Cover Company
- 11.2.5.1. Overview
- 11.2.5.2. Products
- 11.2.5.3. SWOT Analysis
- 11.2.5.4. Recent Developments
- 11.2.5.5. Financials (Based on Availability)
- 11.2.6 Rampage Products
- 11.2.6.1. Overview
- 11.2.6.2. Products
- 11.2.6.3. SWOT Analysis
- 11.2.6.4. Recent Developments
- 11.2.6.5. Financials (Based on Availability)
- 11.2.7 A1 Car Covers
- 11.2.7.1. Overview
- 11.2.7.2. Products
- 11.2.7.3. SWOT Analysis
- 11.2.7.4. Recent Developments
- 11.2.7.5. Financials (Based on Availability)
- 11.2.8 Intro-Tech
- 11.2.8.1. Overview
- 11.2.8.2. Products
- 11.2.8.3. SWOT Analysis
- 11.2.8.4. Recent Developments
- 11.2.8.5. Financials (Based on Availability)
- 11.2.9 Coverwell
- 11.2.9.1. Overview
- 11.2.9.2. Products
- 11.2.9.3. SWOT Analysis
- 11.2.9.4. Recent Developments
- 11.2.9.5. Financials (Based on Availability)
- 11.2.10 Classic Additions
- 11.2.10.1. Overview
- 11.2.10.2. Products
- 11.2.10.3. SWOT Analysis
- 11.2.10.4. Recent Developments
- 11.2.10.5. Financials (Based on Availability)
- 11.2.11 Mingfeng
- 11.2.11.1. Overview
- 11.2.11.2. Products
- 11.2.11.3. SWOT Analysis
- 11.2.11.4. Recent Developments
- 11.2.11.5. Financials (Based on Availability)
- 11.2.12 Blue-sky
- 11.2.12.1. Overview
- 11.2.12.2. Products
- 11.2.12.3. SWOT Analysis
- 11.2.12.4. Recent Developments
- 11.2.12.5. Financials (Based on Availability)
- 11.2.13 Dalian RunDe
- 11.2.13.1. Overview
- 11.2.13.2. Products
- 11.2.13.3. SWOT Analysis
- 11.2.13.4. Recent Developments
- 11.2.13.5. Financials (Based on Availability)
- 11.2.14 Zhongda
- 11.2.14.1. Overview
- 11.2.14.2. Products
- 11.2.14.3. SWOT Analysis
- 11.2.14.4. Recent Developments
- 11.2.14.5. Financials (Based on Availability)
- 11.2.15 Xuantai
- 11.2.15.1. Overview
- 11.2.15.2. Products
- 11.2.15.3. SWOT Analysis
- 11.2.15.4. Recent Developments
- 11.2.15.5. Financials (Based on Availability)
- 11.2.1 Covercraft
List of Figures
- Figure 1: Global Car Covers Revenue Breakdown (million, %) by Region 2024 & 2032
- Figure 2: North America Car Covers Revenue (million), by Application 2024 & 2032
- Figure 3: North America Car Covers Revenue Share (%), by Application 2024 & 2032
- Figure 4: North America Car Covers Revenue (million), by Type 2024 & 2032
- Figure 5: North America Car Covers Revenue Share (%), by Type 2024 & 2032
- Figure 6: North America Car Covers Revenue (million), by Country 2024 & 2032
- Figure 7: North America Car Covers Revenue Share (%), by Country 2024 & 2032
- Figure 8: South America Car Covers Revenue (million), by Application 2024 & 2032
- Figure 9: South America Car Covers Revenue Share (%), by Application 2024 & 2032
- Figure 10: South America Car Covers Revenue (million), by Type 2024 & 2032
- Figure 11: South America Car Covers Revenue Share (%), by Type 2024 & 2032
- Figure 12: South America Car Covers Revenue (million), by Country 2024 & 2032
- Figure 13: South America Car Covers Revenue Share (%), by Country 2024 & 2032
- Figure 14: Europe Car Covers Revenue (million), by Application 2024 & 2032
- Figure 15: Europe Car Covers Revenue Share (%), by Application 2024 & 2032
- Figure 16: Europe Car Covers Revenue (million), by Type 2024 & 2032
- Figure 17: Europe Car Covers Revenue Share (%), by Type 2024 & 2032
- Figure 18: Europe Car Covers Revenue (million), by Country 2024 & 2032
- Figure 19: Europe Car Covers Revenue Share (%), by Country 2024 & 2032
- Figure 20: Middle East & Africa Car Covers Revenue (million), by Application 2024 & 2032
- Figure 21: Middle East & Africa Car Covers Revenue Share (%), by Application 2024 & 2032
- Figure 22: Middle East & Africa Car Covers Revenue (million), by Type 2024 & 2032
- Figure 23: Middle East & Africa Car Covers Revenue Share (%), by Type 2024 & 2032
- Figure 24: Middle East & Africa Car Covers Revenue (million), by Country 2024 & 2032
- Figure 25: Middle East & Africa Car Covers Revenue Share (%), by Country 2024 & 2032
- Figure 26: Asia Pacific Car Covers Revenue (million), by Application 2024 & 2032
- Figure 27: Asia Pacific Car Covers Revenue Share (%), by Application 2024 & 2032
- Figure 28: Asia Pacific Car Covers Revenue (million), by Type 2024 & 2032
- Figure 29: Asia Pacific Car Covers Revenue Share (%), by Type 2024 & 2032
- Figure 30: Asia Pacific Car Covers Revenue (million), by Country 2024 & 2032
- Figure 31: Asia Pacific Car Covers Revenue Share (%), by Country 2024 & 2032
List of Tables
- Table 1: Global Car Covers Revenue million Forecast, by Region 2019 & 2032
- Table 2: Global Car Covers Revenue million Forecast, by Application 2019 & 2032
- Table 3: Global Car Covers Revenue million Forecast, by Type 2019 & 2032
- Table 4: Global Car Covers Revenue million Forecast, by Region 2019 & 2032
- Table 5: Global Car Covers Revenue million Forecast, by Application 2019 & 2032
- Table 6: Global Car Covers Revenue million Forecast, by Type 2019 & 2032
- Table 7: Global Car Covers Revenue million Forecast, by Country 2019 & 2032
- Table 8: United States Car Covers Revenue (million) Forecast, by Application 2019 & 2032
- Table 9: Canada Car Covers Revenue (million) Forecast, by Application 2019 & 2032
- Table 10: Mexico Car Covers Revenue (million) Forecast, by Application 2019 & 2032
- Table 11: Global Car Covers Revenue million Forecast, by Application 2019 & 2032
- Table 12: Global Car Covers Revenue million Forecast, by Type 2019 & 2032
- Table 13: Global Car Covers Revenue million Forecast, by Country 2019 & 2032
- Table 14: Brazil Car Covers Revenue (million) Forecast, by Application 2019 & 2032
- Table 15: Argentina Car Covers Revenue (million) Forecast, by Application 2019 & 2032
- Table 16: Rest of South America Car Covers Revenue (million) Forecast, by Application 2019 & 2032
- Table 17: Global Car Covers Revenue million Forecast, by Application 2019 & 2032
- Table 18: Global Car Covers Revenue million Forecast, by Type 2019 & 2032
- Table 19: Global Car Covers Revenue million Forecast, by Country 2019 & 2032
- Table 20: United Kingdom Car Covers Revenue (million) Forecast, by Application 2019 & 2032
- Table 21: Germany Car Covers Revenue (million) Forecast, by Application 2019 & 2032
- Table 22: France Car Covers Revenue (million) Forecast, by Application 2019 & 2032
- Table 23: Italy Car Covers Revenue (million) Forecast, by Application 2019 & 2032
- Table 24: Spain Car Covers Revenue (million) Forecast, by Application 2019 & 2032
- Table 25: Russia Car Covers Revenue (million) Forecast, by Application 2019 & 2032
- Table 26: Benelux Car Covers Revenue (million) Forecast, by Application 2019 & 2032
- Table 27: Nordics Car Covers Revenue (million) Forecast, by Application 2019 & 2032
- Table 28: Rest of Europe Car Covers Revenue (million) Forecast, by Application 2019 & 2032
- Table 29: Global Car Covers Revenue million Forecast, by Application 2019 & 2032
- Table 30: Global Car Covers Revenue million Forecast, by Type 2019 & 2032
- Table 31: Global Car Covers Revenue million Forecast, by Country 2019 & 2032
- Table 32: Turkey Car Covers Revenue (million) Forecast, by Application 2019 & 2032
- Table 33: Israel Car Covers Revenue (million) Forecast, by Application 2019 & 2032
- Table 34: GCC Car Covers Revenue (million) Forecast, by Application 2019 & 2032
- Table 35: North Africa Car Covers Revenue (million) Forecast, by Application 2019 & 2032
- Table 36: South Africa Car Covers Revenue (million) Forecast, by Application 2019 & 2032
- Table 37: Rest of Middle East & Africa Car Covers Revenue (million) Forecast, by Application 2019 & 2032
- Table 38: Global Car Covers Revenue million Forecast, by Application 2019 & 2032
- Table 39: Global Car Covers Revenue million Forecast, by Type 2019 & 2032
- Table 40: Global Car Covers Revenue million Forecast, by Country 2019 & 2032
- Table 41: China Car Covers Revenue (million) Forecast, by Application 2019 & 2032
- Table 42: India Car Covers Revenue (million) Forecast, by Application 2019 & 2032
- Table 43: Japan Car Covers Revenue (million) Forecast, by Application 2019 & 2032
- Table 44: South Korea Car Covers Revenue (million) Forecast, by Application 2019 & 2032
- Table 45: ASEAN Car Covers Revenue (million) Forecast, by Application 2019 & 2032
- Table 46: Oceania Car Covers Revenue (million) Forecast, by Application 2019 & 2032
- Table 47: Rest of Asia Pacific Car Covers Revenue (million) Forecast, by Application 2019 & 2032
Frequently Asked Questions
1. What is the projected Compound Annual Growth Rate (CAGR) of the Car Covers?
The projected CAGR is approximately 3.3%.
2. Which companies are prominent players in the Car Covers?
Key companies in the market include Covercraft, Coverking, Budge Industries, Polco, California Car Cover Company, Rampage Products, A1 Car Covers, Intro-Tech, Coverwell, Classic Additions, Mingfeng, Blue-sky, Dalian RunDe, Zhongda, Xuantai.
3. What are the main segments of the Car Covers?
The market segments include Application, Type.
4. Can you provide details about the market size?
The market size is estimated to be USD 1090 million as of 2022.
5. What are some drivers contributing to market growth?
N/A
6. What are the notable trends driving market growth?
N/A
7. Are there any restraints impacting market growth?
N/A
8. Can you provide examples of recent developments in the market?
N/A
9. What pricing options are available for accessing the report?
Pricing options include single-user, multi-user, and enterprise licenses priced at USD 4250.00, USD 6375.00, and USD 8500.00 respectively.
10. Is the market size provided in terms of value or volume?
The market size is provided in terms of value, measured in million.
11. Are there any specific market keywords associated with the report?
Yes, the market keyword associated with the report is "Car Covers," which aids in identifying and referencing the specific market segment covered.
12. How do I determine which pricing option suits my needs best?
The pricing options vary based on user requirements and access needs. Individual users may opt for single-user licenses, while businesses requiring broader access may choose multi-user or enterprise licenses for cost-effective access to the report.
13. Are there any additional resources or data provided in the Car Covers report?
While the report offers comprehensive insights, it's advisable to review the specific contents or supplementary materials provided to ascertain if additional resources or data are available.
14. How can I stay updated on further developments or reports in the Car Covers?
To stay informed about further developments, trends, and reports in the Car Covers, consider subscribing to industry newsletters, following relevant companies and organizations, or regularly checking reputable industry news sources and publications.
Methodology
Step 1 - Identification of Relevant Samples Size from Population Database


Step 2 - Approaches for Defining Global Market Size (Value, Volume* & Price*)

Note*: In applicable scenarios
Step 3 - Data Sources
Primary Research
- Web Analytics
- Survey Reports
- Research Institute
- Latest Research Reports
- Opinion Leaders
Secondary Research
- Annual Reports
- White Paper
- Latest Press Release
- Industry Association
- Paid Database
- Investor Presentations

Step 4 - Data Triangulation
Involves using different sources of information in order to increase the validity of a study
These sources are likely to be stakeholders in a program - participants, other researchers, program staff, other community members, and so on.
Then we put all data in single framework & apply various statistical tools to find out the dynamic on the market.
During the analysis stage, feedback from the stakeholder groups would be compared to determine areas of agreement as well as areas of divergence
