

Key Insights
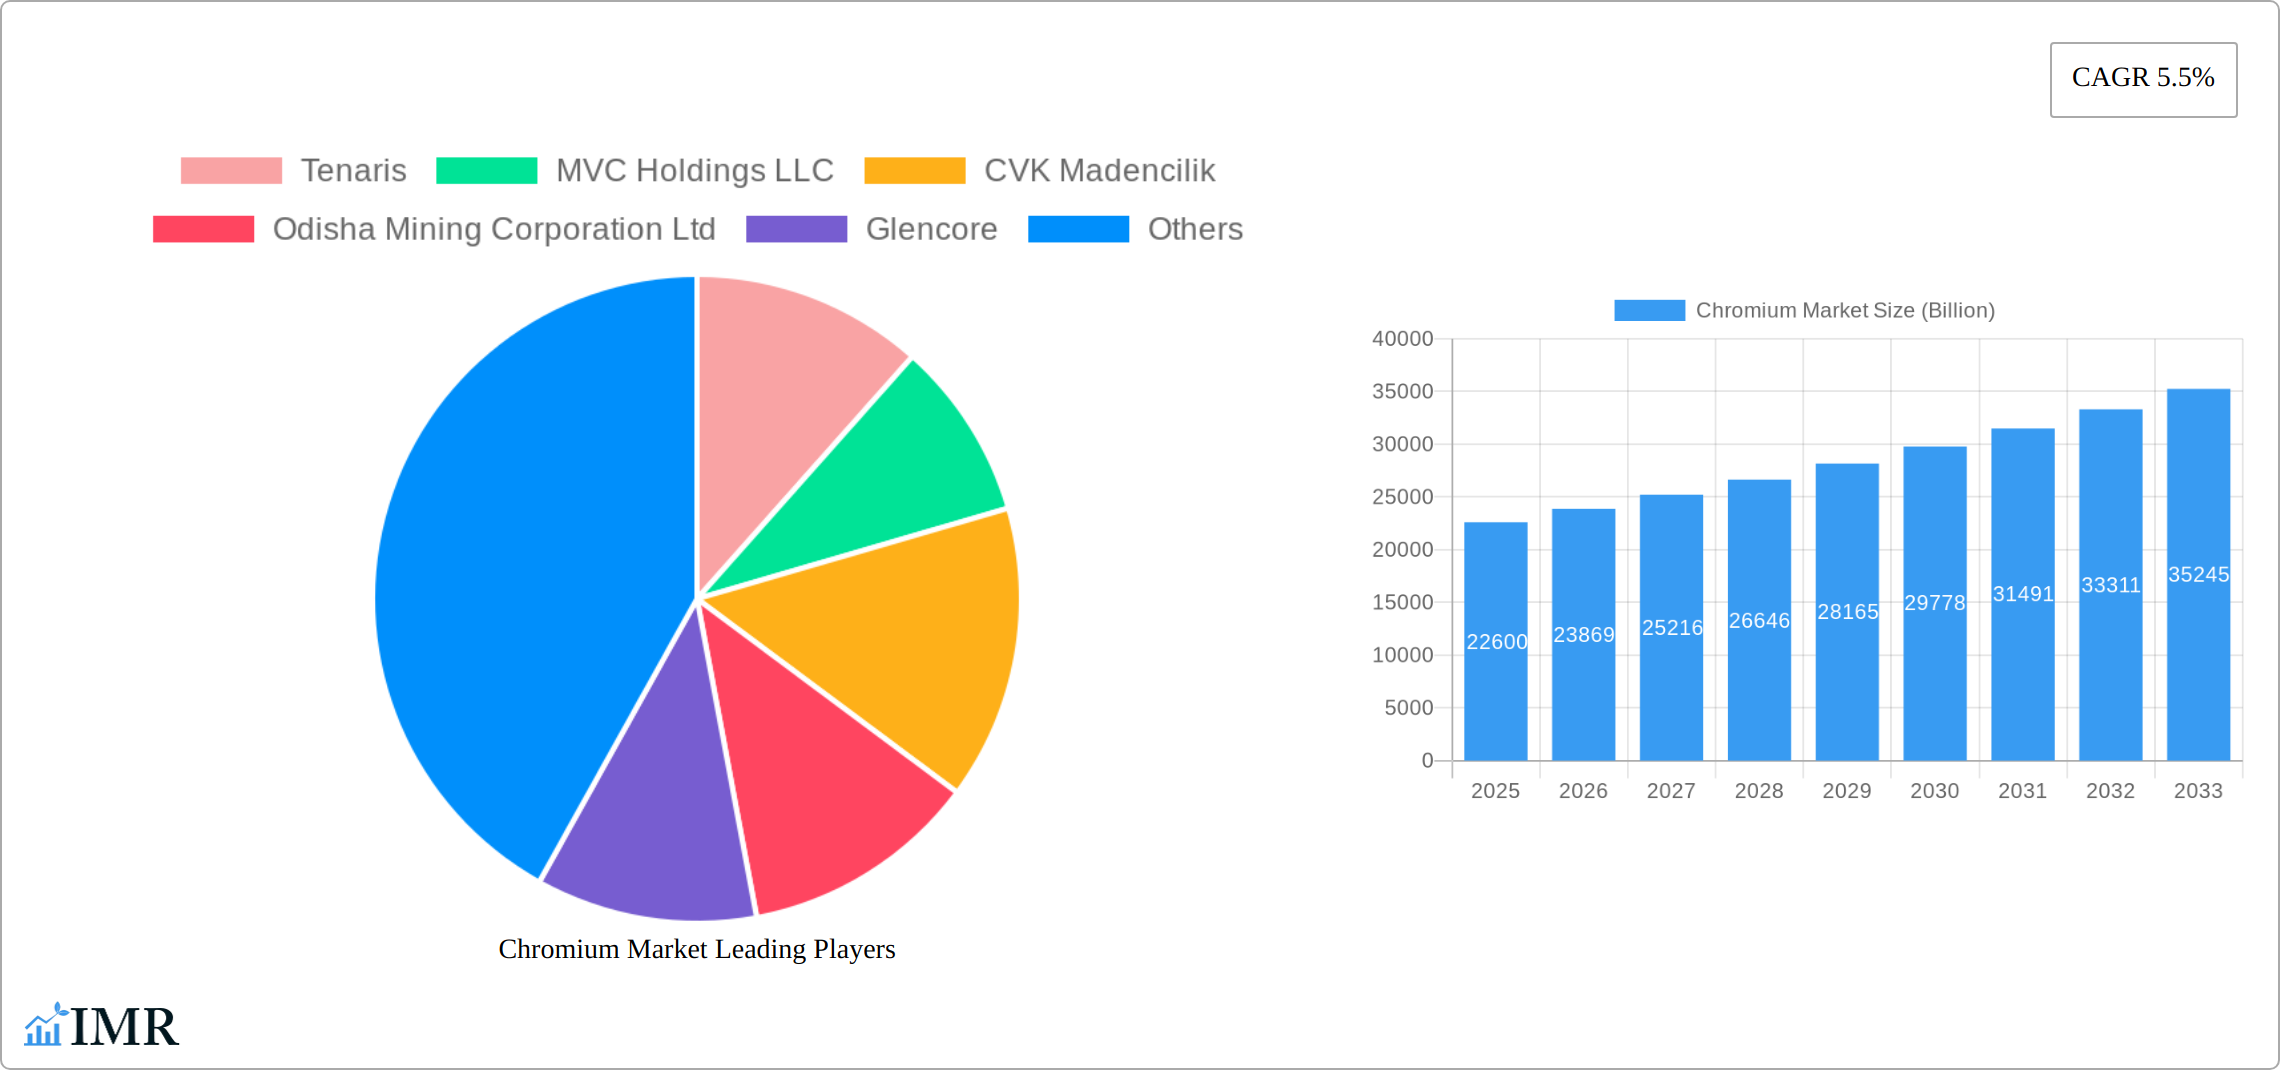
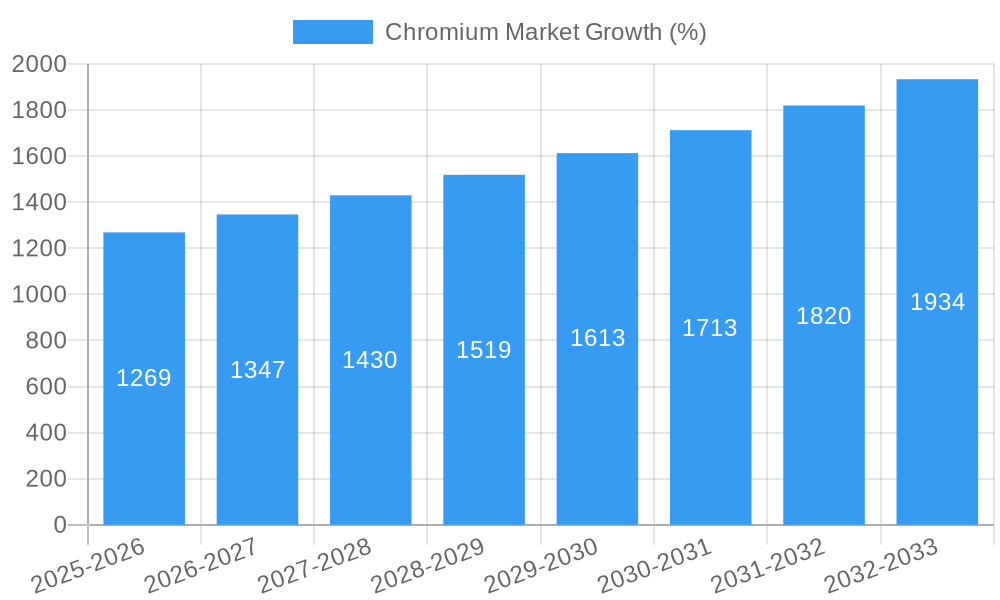
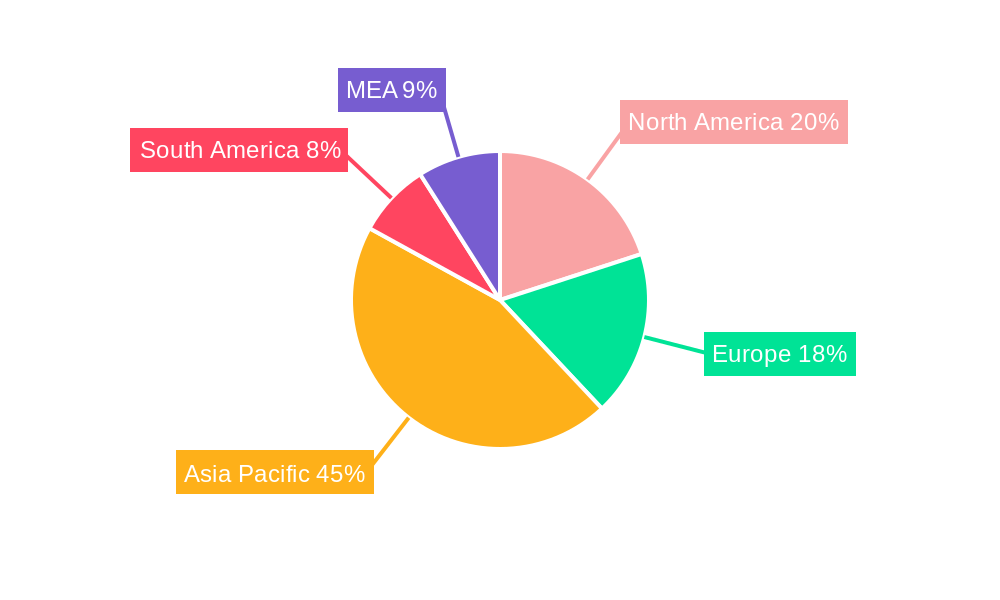
The global chromium market, valued at $22.6 billion in 2025, is projected to experience robust growth, driven by increasing demand from key sectors like stainless steel production, chemical manufacturing, and refractories. A compound annual growth rate (CAGR) of 5.5% is anticipated from 2025 to 2033, indicating a significant expansion of market size during the forecast period. This growth is fueled by several factors. The burgeoning construction industry, particularly in developing economies, necessitates substantial quantities of stainless steel, a major chromium consumer. Furthermore, the expanding chemical and metallurgical industries, reliant on chromium-based alloys and compounds, contribute to heightened demand. Advances in chromium extraction and processing technologies are also enhancing efficiency and lowering production costs, further stimulating market expansion. However, environmental regulations surrounding chromium production and its associated emissions pose a constraint on market growth. Companies are increasingly investing in sustainable practices to mitigate this challenge. The market is segmented by application, with chemical, metallurgical, and refractory applications being prominent segments, alongside others such as glass polishing, industrial catalysts, and pigments. The Asia-Pacific region, led by China and India, holds the largest market share, owing to its significant manufacturing base and increasing infrastructure development. North America and Europe follow as key regional markets. Competitive dynamics within the market are shaped by established players like Tenaris, MVC Holdings LLC, and Glencore, alongside several regional producers. These companies are focused on strategic partnerships, technological innovation, and market diversification to maintain competitiveness.
The forecast period will see a continued shift towards sustainable chromium sourcing and processing methods. Growing environmental awareness and stricter regulations will push companies to adopt greener production techniques, potentially influencing pricing and supply chain dynamics. Meanwhile, innovation in chromium-based alloys will drive adoption in niche applications, such as high-temperature materials and specialized catalysts. The consistent growth predicted for the chromium market suggests attractive opportunities for existing players and new entrants alike. However, managing environmental compliance and navigating fluctuating raw material prices remain key challenges that will shape the market's future trajectory.
Chromium Market: A Comprehensive Market Report (2019-2033)
This comprehensive report provides an in-depth analysis of the global Chromium Market, encompassing market dynamics, growth trends, regional dominance, product landscape, key players, and future outlook. The study period spans from 2019 to 2033, with 2025 serving as the base and estimated year. The report uses data from the historical period (2019-2024) to forecast market trends until 2033. The global chromium market size is projected to reach xx Billion by 2033.
Chromium Market Dynamics & Structure
The chromium market is characterized by moderate concentration, with a few major players holding significant market share. Technological advancements in extraction and processing methods, alongside stringent environmental regulations, are key drivers. The market faces competition from substitute materials in certain applications, impacting overall demand. Mergers and acquisitions (M&A) activity is relatively frequent, shaping the competitive landscape. The parent market is the overall metals and minerals industry, while the child market is specifically ferroalloys.
- Market Concentration: Moderately concentrated, with top 5 players holding approximately xx% market share in 2024.
- Technological Innovation: Focus on improving extraction efficiency, reducing environmental impact, and developing specialized chromium alloys.
- Regulatory Framework: Stringent environmental regulations impacting mining and processing operations, varying across regions.
- Competitive Product Substitutes: Alternatives exist in some applications (e.g., stainless steel substitutes), limiting chromium demand.
- End-User Demographics: Primarily driven by metallurgical and chemical applications, with growing demand from other sectors.
- M&A Trends: Significant M&A activity observed in recent years, with an average of xx deals per year in the past five years, impacting market consolidation.
Chromium Market Growth Trends & Insights
The chromium market has experienced steady growth over the historical period, driven by robust demand from the metallurgical industry, particularly stainless steel production. The increasing use of chromium in chemical applications and other specialized sectors is further contributing to market expansion. Technological advancements, such as improved extraction techniques, have enhanced efficiency and lowered production costs. Consumer behavior shifts towards sustainable materials are also playing a role. The market is projected to witness a CAGR of xx% from 2025 to 2033.
- Market Size Evolution: The market grew from xx Billion in 2019 to xx Billion in 2024, exhibiting a CAGR of xx%.
- Adoption Rates: High adoption in metallurgical applications, with gradual increase in chemical and other applications.
- Technological Disruptions: Advancements in extraction and processing have improved efficiency and sustainability.
- Consumer Behavior Shifts: Growing preference for sustainable materials is influencing market dynamics.
Dominant Regions, Countries, or Segments in Chromium Market
The metallurgical applications segment reigns supreme in the chromium market, capturing approximately xx% of total consumption in 2024. This dominance is largely fueled by the robust expansion of the stainless steel industry, particularly within the dynamic Asia-Pacific region. Beyond stainless steel, other key applications include chemical processing and the manufacturing of refractory materials. The market's growth trajectory is further influenced by the increasing demand for high-performance alloys in various sectors.
- Leading Region: Asia-Pacific, a powerhouse of economic growth and industrialization, leads the global chromium market.
- Key Countries: China, India, South Africa, and Kazakhstan stand out as major producers and consumers of chromium, significantly shaping market dynamics.
- Dominant Segment: Metallurgical applications hold the largest market share, followed by the substantial chemical applications sector.
- Growth Drivers: The expansion of stainless steel production, robust infrastructure development projects, and the rising adoption of chromium in specialized chemical processes are key catalysts for market growth. Furthermore, the burgeoning renewable energy sector, particularly in areas such as solar energy and wind turbine components, is creating significant new demand for chromium-based alloys.
Chromium Market Product Landscape
Ferrochromium remains the dominant form of chromium, extensively utilized in stainless steel and alloy production. Ongoing innovations focus on enhancing the purity and consistency of ferrochromium, resulting in improved product performance and expanded applications. High-carbon ferrochromium continues to be the most widely used type, although lower-carbon variants are gaining traction due to their suitability for specific applications requiring higher purity and improved corrosion resistance.
Key Drivers, Barriers & Challenges in Chromium Market
Key Drivers:
- Increasing stainless steel production globally.
- Growth in the chemical and other specialized sectors.
- Technological advancements in extraction and processing.
Key Challenges & Restraints:
- Volatility in raw material prices.
- Environmental regulations impacting mining and processing.
- Competition from substitute materials.
- Supply chain disruptions impacting availability and cost.
Emerging Opportunities in Chromium Market
- Expanding applications in emerging technologies: The adoption of chromium in cutting-edge technologies like 3D printing and additive manufacturing is rapidly expanding.
- Growth in niche markets: Demand is rising in specialized sectors such as medical implants, aerospace components, and high-performance tooling, creating opportunities for premium-quality chromium products.
- Sustainable production methods: The industry is actively exploring and implementing more sustainable and efficient chromium production methods to reduce environmental impact and improve overall resource efficiency. This includes initiatives focused on minimizing waste and improving energy efficiency throughout the production chain.
Growth Accelerators in the Chromium Market Industry
Technological advancements in chromium extraction and refining are pivotal growth drivers. Strategic alliances and collaborations between mining companies and downstream users are streamlining operations and fostering market expansion. Significant investments in research and development are continuously pushing the boundaries of chromium technology, unlocking new applications and improving existing ones. Government policies promoting sustainable industrial practices and infrastructure development also act as significant catalysts.
Key Players Shaping the Chromium Market Market
- Tenaris
- MVC Holdings LLC
- CVK Madencilik
- Odisha Mining Corporation Ltd
- Glencore
- International Ferro Metals (IFM)
- Al Tamman Indsil FerroChrome L L C
- Kermas Investment Group
- Hernic Ferrochrome (Pty) Ltd (Hernic)
- YILDIRIM Group of Companies
- Assmang Proprietary Limited
Notable Milestones in Chromium Market Sector
- November 2022: Yildirim Group acquired Elementis plc's chromium business for USD 170 million, expanding its production capacity significantly.
- June 2022: Tenaris invested USD 29 million to expand its specialty steel production capacity, including high-chromium steels.
- January 2022: Yildirim Group acquired Albchrome Holding, strengthening its global market position.
In-Depth Chromium Market Market Outlook
The chromium market is poised for continued growth, driven by factors like increasing industrialization, infrastructure development, and the ongoing demand for stainless steel. Strategic investments in research and development, along with the exploration of new applications, will further propel market expansion. The market presents attractive opportunities for companies focusing on sustainable practices and innovative product development.
Chromium Market Segmentation
-
1. Application
- 1.1. Chemical
- 1.2. Metallurgical
- 1.3. Refractory
- 1.4. Other Ap
Chromium Market Segmentation By Geography
-
1. Asia Pacific
- 1.1. China
- 1.2. India
- 1.3. Japan
- 1.4. South Korea
- 1.5. Malaysia
- 1.6. Thailand
- 1.7. Indonesia
- 1.8. Vietnam
- 1.9. Rest of Asia Pacific
-
2. North America
- 2.1. United States
- 2.2. Canada
- 2.3. Mexico
-
3. Europe
- 3.1. Germany
- 3.2. United Kingdom
- 3.3. Italy
- 3.4. France
- 3.5. Spain
- 3.6. NORDIC
- 3.7. Turkey
- 3.8. Russia
- 3.9. Rest of Europe
-
4. South America
- 4.1. Brazil
- 4.2. Argentina
- 4.3. Colombia
- 4.4. Rest of South America
-
5. Middle East and Africa
- 5.1. Saudi Arabia
- 5.2. South Africa
- 5.3. Nigeria
- 5.4. Qatar
- 5.5. Egypt
- 5.6. United Arab Emirates
- 5.7. Rest of Middle East and Africa
Chromium Market REPORT HIGHLIGHTS
| Aspects | Details |
|---|---|
| Study Period | 2019-2033 |
| Base Year | 2024 |
| Estimated Year | 2025 |
| Forecast Period | 2025-2033 |
| Historical Period | 2019-2024 |
| Growth Rate | CAGR of 5.5% from 2019-2033 |
| Segmentation |
|
Table of Contents
- 1. Introduction
- 1.1. Research Scope
- 1.2. Market Segmentation
- 1.3. Research Methodology
- 1.4. Definitions and Assumptions
- 2. Executive Summary
- 2.1. Introduction
- 3. Market Dynamics
- 3.1. Introduction
- 3.2. Market Drivers
- 3.2.1. Growing Demand for Metallurgical Uses; Increasing Refractory Applications in Industries; Other Drivers
- 3.3. Market Restrains
- 3.3.1. Associated Health Effects; Other Restraints
- 3.4. Market Trends
- 3.4.1. Metallurgical Applications to Witness Growth in Future
- 4. Market Factor Analysis
- 4.1. Porters Five Forces
- 4.2. Supply/Value Chain
- 4.3. PESTEL analysis
- 4.4. Market Entropy
- 4.5. Patent/Trademark Analysis
- 5. Global Chromium Market Analysis, Insights and Forecast, 2019-2031
- 5.1. Market Analysis, Insights and Forecast - by Application
- 5.1.1. Chemical
- 5.1.2. Metallurgical
- 5.1.3. Refractory
- 5.1.4. Other Ap
- 5.2. Market Analysis, Insights and Forecast - by Region
- 5.2.1. Asia Pacific
- 5.2.2. North America
- 5.2.3. Europe
- 5.2.4. South America
- 5.2.5. Middle East and Africa
- 5.1. Market Analysis, Insights and Forecast - by Application
- 6. Asia Pacific Chromium Market Analysis, Insights and Forecast, 2019-2031
- 6.1. Market Analysis, Insights and Forecast - by Application
- 6.1.1. Chemical
- 6.1.2. Metallurgical
- 6.1.3. Refractory
- 6.1.4. Other Ap
- 6.1. Market Analysis, Insights and Forecast - by Application
- 7. North America Chromium Market Analysis, Insights and Forecast, 2019-2031
- 7.1. Market Analysis, Insights and Forecast - by Application
- 7.1.1. Chemical
- 7.1.2. Metallurgical
- 7.1.3. Refractory
- 7.1.4. Other Ap
- 7.1. Market Analysis, Insights and Forecast - by Application
- 8. Europe Chromium Market Analysis, Insights and Forecast, 2019-2031
- 8.1. Market Analysis, Insights and Forecast - by Application
- 8.1.1. Chemical
- 8.1.2. Metallurgical
- 8.1.3. Refractory
- 8.1.4. Other Ap
- 8.1. Market Analysis, Insights and Forecast - by Application
- 9. South America Chromium Market Analysis, Insights and Forecast, 2019-2031
- 9.1. Market Analysis, Insights and Forecast - by Application
- 9.1.1. Chemical
- 9.1.2. Metallurgical
- 9.1.3. Refractory
- 9.1.4. Other Ap
- 9.1. Market Analysis, Insights and Forecast - by Application
- 10. Middle East and Africa Chromium Market Analysis, Insights and Forecast, 2019-2031
- 10.1. Market Analysis, Insights and Forecast - by Application
- 10.1.1. Chemical
- 10.1.2. Metallurgical
- 10.1.3. Refractory
- 10.1.4. Other Ap
- 10.1. Market Analysis, Insights and Forecast - by Application
- 11. North America Chromium Market Analysis, Insights and Forecast, 2019-2031
- 11.1. Market Analysis, Insights and Forecast - By Country/Sub-region
- 11.1.1 United States
- 11.1.2 Canada
- 11.1.3 Mexico
- 12. Europe Chromium Market Analysis, Insights and Forecast, 2019-2031
- 12.1. Market Analysis, Insights and Forecast - By Country/Sub-region
- 12.1.1 Germany
- 12.1.2 France
- 12.1.3 Italy
- 12.1.4 United Kingdom
- 12.1.5 Netherlands
- 12.1.6 Rest of Europe
- 13. Asia Pacific Chromium Market Analysis, Insights and Forecast, 2019-2031
- 13.1. Market Analysis, Insights and Forecast - By Country/Sub-region
- 13.1.1 China
- 13.1.2 Japan
- 13.1.3 India
- 13.1.4 South Korea
- 13.1.5 Taiwan
- 13.1.6 Australia
- 13.1.7 Rest of Asia-Pacific
- 14. South America Chromium Market Analysis, Insights and Forecast, 2019-2031
- 14.1. Market Analysis, Insights and Forecast - By Country/Sub-region
- 14.1.1 Brazil
- 14.1.2 Argentina
- 14.1.3 Rest of South America
- 15. MEA Chromium Market Analysis, Insights and Forecast, 2019-2031
- 15.1. Market Analysis, Insights and Forecast - By Country/Sub-region
- 15.1.1 Middle East
- 15.1.2 Africa
- 16. Competitive Analysis
- 16.1. Global Market Share Analysis 2024
- 16.2. Company Profiles
- 16.2.1 Tenaris
- 16.2.1.1. Overview
- 16.2.1.2. Products
- 16.2.1.3. SWOT Analysis
- 16.2.1.4. Recent Developments
- 16.2.1.5. Financials (Based on Availability)
- 16.2.2 MVC Holdings LLC
- 16.2.2.1. Overview
- 16.2.2.2. Products
- 16.2.2.3. SWOT Analysis
- 16.2.2.4. Recent Developments
- 16.2.2.5. Financials (Based on Availability)
- 16.2.3 CVK Madencilik
- 16.2.3.1. Overview
- 16.2.3.2. Products
- 16.2.3.3. SWOT Analysis
- 16.2.3.4. Recent Developments
- 16.2.3.5. Financials (Based on Availability)
- 16.2.4 Odisha Mining Corporation Ltd
- 16.2.4.1. Overview
- 16.2.4.2. Products
- 16.2.4.3. SWOT Analysis
- 16.2.4.4. Recent Developments
- 16.2.4.5. Financials (Based on Availability)
- 16.2.5 Glencore
- 16.2.5.1. Overview
- 16.2.5.2. Products
- 16.2.5.3. SWOT Analysis
- 16.2.5.4. Recent Developments
- 16.2.5.5. Financials (Based on Availability)
- 16.2.6 International Ferro Metals (IFM)
- 16.2.6.1. Overview
- 16.2.6.2. Products
- 16.2.6.3. SWOT Analysis
- 16.2.6.4. Recent Developments
- 16.2.6.5. Financials (Based on Availability)
- 16.2.7 Al Tamman Indsil FerroChrome L L C
- 16.2.7.1. Overview
- 16.2.7.2. Products
- 16.2.7.3. SWOT Analysis
- 16.2.7.4. Recent Developments
- 16.2.7.5. Financials (Based on Availability)
- 16.2.8 Kermas Investment Group
- 16.2.8.1. Overview
- 16.2.8.2. Products
- 16.2.8.3. SWOT Analysis
- 16.2.8.4. Recent Developments
- 16.2.8.5. Financials (Based on Availability)
- 16.2.9 Hernic Ferrochrome (Pty) Ltd (Hernic)
- 16.2.9.1. Overview
- 16.2.9.2. Products
- 16.2.9.3. SWOT Analysis
- 16.2.9.4. Recent Developments
- 16.2.9.5. Financials (Based on Availability)
- 16.2.10 YILDIRIM Group of Companies
- 16.2.10.1. Overview
- 16.2.10.2. Products
- 16.2.10.3. SWOT Analysis
- 16.2.10.4. Recent Developments
- 16.2.10.5. Financials (Based on Availability)
- 16.2.11 Assmang Proprietary Limited
- 16.2.11.1. Overview
- 16.2.11.2. Products
- 16.2.11.3. SWOT Analysis
- 16.2.11.4. Recent Developments
- 16.2.11.5. Financials (Based on Availability)
- 16.2.1 Tenaris
List of Figures
- Figure 1: Global Chromium Market Revenue Breakdown (Billion, %) by Region 2024 & 2032
- Figure 2: Global Chromium Market Volume Breakdown (K Tons, %) by Region 2024 & 2032
- Figure 3: North America Chromium Market Revenue (Billion), by Country 2024 & 2032
- Figure 4: North America Chromium Market Volume (K Tons), by Country 2024 & 2032
- Figure 5: North America Chromium Market Revenue Share (%), by Country 2024 & 2032
- Figure 6: North America Chromium Market Volume Share (%), by Country 2024 & 2032
- Figure 7: Europe Chromium Market Revenue (Billion), by Country 2024 & 2032
- Figure 8: Europe Chromium Market Volume (K Tons), by Country 2024 & 2032
- Figure 9: Europe Chromium Market Revenue Share (%), by Country 2024 & 2032
- Figure 10: Europe Chromium Market Volume Share (%), by Country 2024 & 2032
- Figure 11: Asia Pacific Chromium Market Revenue (Billion), by Country 2024 & 2032
- Figure 12: Asia Pacific Chromium Market Volume (K Tons), by Country 2024 & 2032
- Figure 13: Asia Pacific Chromium Market Revenue Share (%), by Country 2024 & 2032
- Figure 14: Asia Pacific Chromium Market Volume Share (%), by Country 2024 & 2032
- Figure 15: South America Chromium Market Revenue (Billion), by Country 2024 & 2032
- Figure 16: South America Chromium Market Volume (K Tons), by Country 2024 & 2032
- Figure 17: South America Chromium Market Revenue Share (%), by Country 2024 & 2032
- Figure 18: South America Chromium Market Volume Share (%), by Country 2024 & 2032
- Figure 19: MEA Chromium Market Revenue (Billion), by Country 2024 & 2032
- Figure 20: MEA Chromium Market Volume (K Tons), by Country 2024 & 2032
- Figure 21: MEA Chromium Market Revenue Share (%), by Country 2024 & 2032
- Figure 22: MEA Chromium Market Volume Share (%), by Country 2024 & 2032
- Figure 23: Asia Pacific Chromium Market Revenue (Billion), by Application 2024 & 2032
- Figure 24: Asia Pacific Chromium Market Volume (K Tons), by Application 2024 & 2032
- Figure 25: Asia Pacific Chromium Market Revenue Share (%), by Application 2024 & 2032
- Figure 26: Asia Pacific Chromium Market Volume Share (%), by Application 2024 & 2032
- Figure 27: Asia Pacific Chromium Market Revenue (Billion), by Country 2024 & 2032
- Figure 28: Asia Pacific Chromium Market Volume (K Tons), by Country 2024 & 2032
- Figure 29: Asia Pacific Chromium Market Revenue Share (%), by Country 2024 & 2032
- Figure 30: Asia Pacific Chromium Market Volume Share (%), by Country 2024 & 2032
- Figure 31: North America Chromium Market Revenue (Billion), by Application 2024 & 2032
- Figure 32: North America Chromium Market Volume (K Tons), by Application 2024 & 2032
- Figure 33: North America Chromium Market Revenue Share (%), by Application 2024 & 2032
- Figure 34: North America Chromium Market Volume Share (%), by Application 2024 & 2032
- Figure 35: North America Chromium Market Revenue (Billion), by Country 2024 & 2032
- Figure 36: North America Chromium Market Volume (K Tons), by Country 2024 & 2032
- Figure 37: North America Chromium Market Revenue Share (%), by Country 2024 & 2032
- Figure 38: North America Chromium Market Volume Share (%), by Country 2024 & 2032
- Figure 39: Europe Chromium Market Revenue (Billion), by Application 2024 & 2032
- Figure 40: Europe Chromium Market Volume (K Tons), by Application 2024 & 2032
- Figure 41: Europe Chromium Market Revenue Share (%), by Application 2024 & 2032
- Figure 42: Europe Chromium Market Volume Share (%), by Application 2024 & 2032
- Figure 43: Europe Chromium Market Revenue (Billion), by Country 2024 & 2032
- Figure 44: Europe Chromium Market Volume (K Tons), by Country 2024 & 2032
- Figure 45: Europe Chromium Market Revenue Share (%), by Country 2024 & 2032
- Figure 46: Europe Chromium Market Volume Share (%), by Country 2024 & 2032
- Figure 47: South America Chromium Market Revenue (Billion), by Application 2024 & 2032
- Figure 48: South America Chromium Market Volume (K Tons), by Application 2024 & 2032
- Figure 49: South America Chromium Market Revenue Share (%), by Application 2024 & 2032
- Figure 50: South America Chromium Market Volume Share (%), by Application 2024 & 2032
- Figure 51: South America Chromium Market Revenue (Billion), by Country 2024 & 2032
- Figure 52: South America Chromium Market Volume (K Tons), by Country 2024 & 2032
- Figure 53: South America Chromium Market Revenue Share (%), by Country 2024 & 2032
- Figure 54: South America Chromium Market Volume Share (%), by Country 2024 & 2032
- Figure 55: Middle East and Africa Chromium Market Revenue (Billion), by Application 2024 & 2032
- Figure 56: Middle East and Africa Chromium Market Volume (K Tons), by Application 2024 & 2032
- Figure 57: Middle East and Africa Chromium Market Revenue Share (%), by Application 2024 & 2032
- Figure 58: Middle East and Africa Chromium Market Volume Share (%), by Application 2024 & 2032
- Figure 59: Middle East and Africa Chromium Market Revenue (Billion), by Country 2024 & 2032
- Figure 60: Middle East and Africa Chromium Market Volume (K Tons), by Country 2024 & 2032
- Figure 61: Middle East and Africa Chromium Market Revenue Share (%), by Country 2024 & 2032
- Figure 62: Middle East and Africa Chromium Market Volume Share (%), by Country 2024 & 2032
List of Tables
- Table 1: Global Chromium Market Revenue Billion Forecast, by Region 2019 & 2032
- Table 2: Global Chromium Market Volume K Tons Forecast, by Region 2019 & 2032
- Table 3: Global Chromium Market Revenue Billion Forecast, by Application 2019 & 2032
- Table 4: Global Chromium Market Volume K Tons Forecast, by Application 2019 & 2032
- Table 5: Global Chromium Market Revenue Billion Forecast, by Region 2019 & 2032
- Table 6: Global Chromium Market Volume K Tons Forecast, by Region 2019 & 2032
- Table 7: Global Chromium Market Revenue Billion Forecast, by Country 2019 & 2032
- Table 8: Global Chromium Market Volume K Tons Forecast, by Country 2019 & 2032
- Table 9: United States Chromium Market Revenue (Billion) Forecast, by Application 2019 & 2032
- Table 10: United States Chromium Market Volume (K Tons) Forecast, by Application 2019 & 2032
- Table 11: Canada Chromium Market Revenue (Billion) Forecast, by Application 2019 & 2032
- Table 12: Canada Chromium Market Volume (K Tons) Forecast, by Application 2019 & 2032
- Table 13: Mexico Chromium Market Revenue (Billion) Forecast, by Application 2019 & 2032
- Table 14: Mexico Chromium Market Volume (K Tons) Forecast, by Application 2019 & 2032
- Table 15: Global Chromium Market Revenue Billion Forecast, by Country 2019 & 2032
- Table 16: Global Chromium Market Volume K Tons Forecast, by Country 2019 & 2032
- Table 17: Germany Chromium Market Revenue (Billion) Forecast, by Application 2019 & 2032
- Table 18: Germany Chromium Market Volume (K Tons) Forecast, by Application 2019 & 2032
- Table 19: France Chromium Market Revenue (Billion) Forecast, by Application 2019 & 2032
- Table 20: France Chromium Market Volume (K Tons) Forecast, by Application 2019 & 2032
- Table 21: Italy Chromium Market Revenue (Billion) Forecast, by Application 2019 & 2032
- Table 22: Italy Chromium Market Volume (K Tons) Forecast, by Application 2019 & 2032
- Table 23: United Kingdom Chromium Market Revenue (Billion) Forecast, by Application 2019 & 2032
- Table 24: United Kingdom Chromium Market Volume (K Tons) Forecast, by Application 2019 & 2032
- Table 25: Netherlands Chromium Market Revenue (Billion) Forecast, by Application 2019 & 2032
- Table 26: Netherlands Chromium Market Volume (K Tons) Forecast, by Application 2019 & 2032
- Table 27: Rest of Europe Chromium Market Revenue (Billion) Forecast, by Application 2019 & 2032
- Table 28: Rest of Europe Chromium Market Volume (K Tons) Forecast, by Application 2019 & 2032
- Table 29: Global Chromium Market Revenue Billion Forecast, by Country 2019 & 2032
- Table 30: Global Chromium Market Volume K Tons Forecast, by Country 2019 & 2032
- Table 31: China Chromium Market Revenue (Billion) Forecast, by Application 2019 & 2032
- Table 32: China Chromium Market Volume (K Tons) Forecast, by Application 2019 & 2032
- Table 33: Japan Chromium Market Revenue (Billion) Forecast, by Application 2019 & 2032
- Table 34: Japan Chromium Market Volume (K Tons) Forecast, by Application 2019 & 2032
- Table 35: India Chromium Market Revenue (Billion) Forecast, by Application 2019 & 2032
- Table 36: India Chromium Market Volume (K Tons) Forecast, by Application 2019 & 2032
- Table 37: South Korea Chromium Market Revenue (Billion) Forecast, by Application 2019 & 2032
- Table 38: South Korea Chromium Market Volume (K Tons) Forecast, by Application 2019 & 2032
- Table 39: Taiwan Chromium Market Revenue (Billion) Forecast, by Application 2019 & 2032
- Table 40: Taiwan Chromium Market Volume (K Tons) Forecast, by Application 2019 & 2032
- Table 41: Australia Chromium Market Revenue (Billion) Forecast, by Application 2019 & 2032
- Table 42: Australia Chromium Market Volume (K Tons) Forecast, by Application 2019 & 2032
- Table 43: Rest of Asia-Pacific Chromium Market Revenue (Billion) Forecast, by Application 2019 & 2032
- Table 44: Rest of Asia-Pacific Chromium Market Volume (K Tons) Forecast, by Application 2019 & 2032
- Table 45: Global Chromium Market Revenue Billion Forecast, by Country 2019 & 2032
- Table 46: Global Chromium Market Volume K Tons Forecast, by Country 2019 & 2032
- Table 47: Brazil Chromium Market Revenue (Billion) Forecast, by Application 2019 & 2032
- Table 48: Brazil Chromium Market Volume (K Tons) Forecast, by Application 2019 & 2032
- Table 49: Argentina Chromium Market Revenue (Billion) Forecast, by Application 2019 & 2032
- Table 50: Argentina Chromium Market Volume (K Tons) Forecast, by Application 2019 & 2032
- Table 51: Rest of South America Chromium Market Revenue (Billion) Forecast, by Application 2019 & 2032
- Table 52: Rest of South America Chromium Market Volume (K Tons) Forecast, by Application 2019 & 2032
- Table 53: Global Chromium Market Revenue Billion Forecast, by Country 2019 & 2032
- Table 54: Global Chromium Market Volume K Tons Forecast, by Country 2019 & 2032
- Table 55: Middle East Chromium Market Revenue (Billion) Forecast, by Application 2019 & 2032
- Table 56: Middle East Chromium Market Volume (K Tons) Forecast, by Application 2019 & 2032
- Table 57: Africa Chromium Market Revenue (Billion) Forecast, by Application 2019 & 2032
- Table 58: Africa Chromium Market Volume (K Tons) Forecast, by Application 2019 & 2032
- Table 59: Global Chromium Market Revenue Billion Forecast, by Application 2019 & 2032
- Table 60: Global Chromium Market Volume K Tons Forecast, by Application 2019 & 2032
- Table 61: Global Chromium Market Revenue Billion Forecast, by Country 2019 & 2032
- Table 62: Global Chromium Market Volume K Tons Forecast, by Country 2019 & 2032
- Table 63: China Chromium Market Revenue (Billion) Forecast, by Application 2019 & 2032
- Table 64: China Chromium Market Volume (K Tons) Forecast, by Application 2019 & 2032
- Table 65: India Chromium Market Revenue (Billion) Forecast, by Application 2019 & 2032
- Table 66: India Chromium Market Volume (K Tons) Forecast, by Application 2019 & 2032
- Table 67: Japan Chromium Market Revenue (Billion) Forecast, by Application 2019 & 2032
- Table 68: Japan Chromium Market Volume (K Tons) Forecast, by Application 2019 & 2032
- Table 69: South Korea Chromium Market Revenue (Billion) Forecast, by Application 2019 & 2032
- Table 70: South Korea Chromium Market Volume (K Tons) Forecast, by Application 2019 & 2032
- Table 71: Malaysia Chromium Market Revenue (Billion) Forecast, by Application 2019 & 2032
- Table 72: Malaysia Chromium Market Volume (K Tons) Forecast, by Application 2019 & 2032
- Table 73: Thailand Chromium Market Revenue (Billion) Forecast, by Application 2019 & 2032
- Table 74: Thailand Chromium Market Volume (K Tons) Forecast, by Application 2019 & 2032
- Table 75: Indonesia Chromium Market Revenue (Billion) Forecast, by Application 2019 & 2032
- Table 76: Indonesia Chromium Market Volume (K Tons) Forecast, by Application 2019 & 2032
- Table 77: Vietnam Chromium Market Revenue (Billion) Forecast, by Application 2019 & 2032
- Table 78: Vietnam Chromium Market Volume (K Tons) Forecast, by Application 2019 & 2032
- Table 79: Rest of Asia Pacific Chromium Market Revenue (Billion) Forecast, by Application 2019 & 2032
- Table 80: Rest of Asia Pacific Chromium Market Volume (K Tons) Forecast, by Application 2019 & 2032
- Table 81: Global Chromium Market Revenue Billion Forecast, by Application 2019 & 2032
- Table 82: Global Chromium Market Volume K Tons Forecast, by Application 2019 & 2032
- Table 83: Global Chromium Market Revenue Billion Forecast, by Country 2019 & 2032
- Table 84: Global Chromium Market Volume K Tons Forecast, by Country 2019 & 2032
- Table 85: United States Chromium Market Revenue (Billion) Forecast, by Application 2019 & 2032
- Table 86: United States Chromium Market Volume (K Tons) Forecast, by Application 2019 & 2032
- Table 87: Canada Chromium Market Revenue (Billion) Forecast, by Application 2019 & 2032
- Table 88: Canada Chromium Market Volume (K Tons) Forecast, by Application 2019 & 2032
- Table 89: Mexico Chromium Market Revenue (Billion) Forecast, by Application 2019 & 2032
- Table 90: Mexico Chromium Market Volume (K Tons) Forecast, by Application 2019 & 2032
- Table 91: Global Chromium Market Revenue Billion Forecast, by Application 2019 & 2032
- Table 92: Global Chromium Market Volume K Tons Forecast, by Application 2019 & 2032
- Table 93: Global Chromium Market Revenue Billion Forecast, by Country 2019 & 2032
- Table 94: Global Chromium Market Volume K Tons Forecast, by Country 2019 & 2032
- Table 95: Germany Chromium Market Revenue (Billion) Forecast, by Application 2019 & 2032
- Table 96: Germany Chromium Market Volume (K Tons) Forecast, by Application 2019 & 2032
- Table 97: United Kingdom Chromium Market Revenue (Billion) Forecast, by Application 2019 & 2032
- Table 98: United Kingdom Chromium Market Volume (K Tons) Forecast, by Application 2019 & 2032
- Table 99: Italy Chromium Market Revenue (Billion) Forecast, by Application 2019 & 2032
- Table 100: Italy Chromium Market Volume (K Tons) Forecast, by Application 2019 & 2032
- Table 101: France Chromium Market Revenue (Billion) Forecast, by Application 2019 & 2032
- Table 102: France Chromium Market Volume (K Tons) Forecast, by Application 2019 & 2032
- Table 103: Spain Chromium Market Revenue (Billion) Forecast, by Application 2019 & 2032
- Table 104: Spain Chromium Market Volume (K Tons) Forecast, by Application 2019 & 2032
- Table 105: NORDIC Chromium Market Revenue (Billion) Forecast, by Application 2019 & 2032
- Table 106: NORDIC Chromium Market Volume (K Tons) Forecast, by Application 2019 & 2032
- Table 107: Turkey Chromium Market Revenue (Billion) Forecast, by Application 2019 & 2032
- Table 108: Turkey Chromium Market Volume (K Tons) Forecast, by Application 2019 & 2032
- Table 109: Russia Chromium Market Revenue (Billion) Forecast, by Application 2019 & 2032
- Table 110: Russia Chromium Market Volume (K Tons) Forecast, by Application 2019 & 2032
- Table 111: Rest of Europe Chromium Market Revenue (Billion) Forecast, by Application 2019 & 2032
- Table 112: Rest of Europe Chromium Market Volume (K Tons) Forecast, by Application 2019 & 2032
- Table 113: Global Chromium Market Revenue Billion Forecast, by Application 2019 & 2032
- Table 114: Global Chromium Market Volume K Tons Forecast, by Application 2019 & 2032
- Table 115: Global Chromium Market Revenue Billion Forecast, by Country 2019 & 2032
- Table 116: Global Chromium Market Volume K Tons Forecast, by Country 2019 & 2032
- Table 117: Brazil Chromium Market Revenue (Billion) Forecast, by Application 2019 & 2032
- Table 118: Brazil Chromium Market Volume (K Tons) Forecast, by Application 2019 & 2032
- Table 119: Argentina Chromium Market Revenue (Billion) Forecast, by Application 2019 & 2032
- Table 120: Argentina Chromium Market Volume (K Tons) Forecast, by Application 2019 & 2032
- Table 121: Colombia Chromium Market Revenue (Billion) Forecast, by Application 2019 & 2032
- Table 122: Colombia Chromium Market Volume (K Tons) Forecast, by Application 2019 & 2032
- Table 123: Rest of South America Chromium Market Revenue (Billion) Forecast, by Application 2019 & 2032
- Table 124: Rest of South America Chromium Market Volume (K Tons) Forecast, by Application 2019 & 2032
- Table 125: Global Chromium Market Revenue Billion Forecast, by Application 2019 & 2032
- Table 126: Global Chromium Market Volume K Tons Forecast, by Application 2019 & 2032
- Table 127: Global Chromium Market Revenue Billion Forecast, by Country 2019 & 2032
- Table 128: Global Chromium Market Volume K Tons Forecast, by Country 2019 & 2032
- Table 129: Saudi Arabia Chromium Market Revenue (Billion) Forecast, by Application 2019 & 2032
- Table 130: Saudi Arabia Chromium Market Volume (K Tons) Forecast, by Application 2019 & 2032
- Table 131: South Africa Chromium Market Revenue (Billion) Forecast, by Application 2019 & 2032
- Table 132: South Africa Chromium Market Volume (K Tons) Forecast, by Application 2019 & 2032
- Table 133: Nigeria Chromium Market Revenue (Billion) Forecast, by Application 2019 & 2032
- Table 134: Nigeria Chromium Market Volume (K Tons) Forecast, by Application 2019 & 2032
- Table 135: Qatar Chromium Market Revenue (Billion) Forecast, by Application 2019 & 2032
- Table 136: Qatar Chromium Market Volume (K Tons) Forecast, by Application 2019 & 2032
- Table 137: Egypt Chromium Market Revenue (Billion) Forecast, by Application 2019 & 2032
- Table 138: Egypt Chromium Market Volume (K Tons) Forecast, by Application 2019 & 2032
- Table 139: United Arab Emirates Chromium Market Revenue (Billion) Forecast, by Application 2019 & 2032
- Table 140: United Arab Emirates Chromium Market Volume (K Tons) Forecast, by Application 2019 & 2032
- Table 141: Rest of Middle East and Africa Chromium Market Revenue (Billion) Forecast, by Application 2019 & 2032
- Table 142: Rest of Middle East and Africa Chromium Market Volume (K Tons) Forecast, by Application 2019 & 2032
Frequently Asked Questions
1. What is the projected Compound Annual Growth Rate (CAGR) of the Chromium Market?
The projected CAGR is approximately 5.5%.
2. Which companies are prominent players in the Chromium Market?
Key companies in the market include Tenaris, MVC Holdings LLC, CVK Madencilik, Odisha Mining Corporation Ltd, Glencore, International Ferro Metals (IFM), Al Tamman Indsil FerroChrome L L C, Kermas Investment Group, Hernic Ferrochrome (Pty) Ltd (Hernic), YILDIRIM Group of Companies, Assmang Proprietary Limited.
3. What are the main segments of the Chromium Market?
The market segments include Application.
4. Can you provide details about the market size?
The market size is estimated to be USD 22.6 Billion as of 2022.
5. What are some drivers contributing to market growth?
Growing Demand for Metallurgical Uses; Increasing Refractory Applications in Industries; Other Drivers.
6. What are the notable trends driving market growth?
Metallurgical Applications to Witness Growth in Future.
7. Are there any restraints impacting market growth?
Associated Health Effects; Other Restraints.
8. Can you provide examples of recent developments in the market?
November 2022: Yildirim Group announced the acquisition of 100% shares of Elementis plc's chromium business for an enterprise value of USD 170 million. With this agreement in place, Yildirim Group has acquired Elementis Chromium's two production facilities in Corpus Christi (TX) and Castle Hayne (NC), as well as three facilities in Amarillo (TX), Dakota (NE) and Milwaukee (WI).
9. What pricing options are available for accessing the report?
Pricing options include single-user, multi-user, and enterprise licenses priced at USD 3,950, USD 4,950, and USD 6,950 respectively.
10. Is the market size provided in terms of value or volume?
The market size is provided in terms of value, measured in Billion and volume, measured in K Tons.
11. Are there any specific market keywords associated with the report?
Yes, the market keyword associated with the report is "Chromium Market," which aids in identifying and referencing the specific market segment covered.
12. How do I determine which pricing option suits my needs best?
The pricing options vary based on user requirements and access needs. Individual users may opt for single-user licenses, while businesses requiring broader access may choose multi-user or enterprise licenses for cost-effective access to the report.
13. Are there any additional resources or data provided in the Chromium Market report?
While the report offers comprehensive insights, it's advisable to review the specific contents or supplementary materials provided to ascertain if additional resources or data are available.
14. How can I stay updated on further developments or reports in the Chromium Market?
To stay informed about further developments, trends, and reports in the Chromium Market, consider subscribing to industry newsletters, following relevant companies and organizations, or regularly checking reputable industry news sources and publications.
Methodology
Step 1 - Identification of Relevant Samples Size from Population Database


Step 2 - Approaches for Defining Global Market Size (Value, Volume* & Price*)

Note*: In applicable scenarios
Step 3 - Data Sources
Primary Research
- Web Analytics
- Survey Reports
- Research Institute
- Latest Research Reports
- Opinion Leaders
Secondary Research
- Annual Reports
- White Paper
- Latest Press Release
- Industry Association
- Paid Database
- Investor Presentations

Step 4 - Data Triangulation
Involves using different sources of information in order to increase the validity of a study
These sources are likely to be stakeholders in a program - participants, other researchers, program staff, other community members, and so on.
Then we put all data in single framework & apply various statistical tools to find out the dynamic on the market.
During the analysis stage, feedback from the stakeholder groups would be compared to determine areas of agreement as well as areas of divergence
