

Key Insights
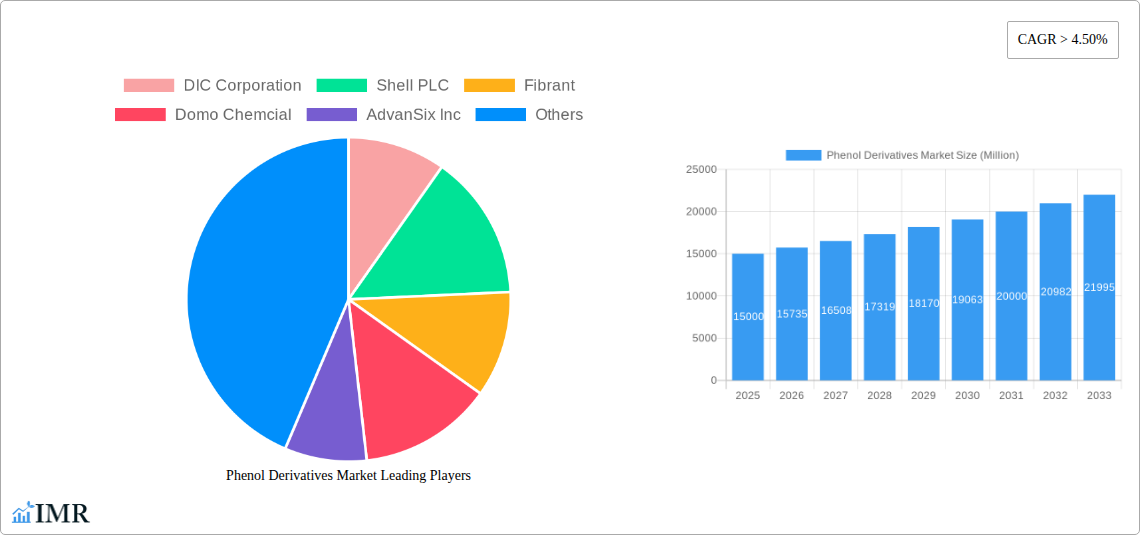
The Phenol Derivatives market is experiencing robust growth, projected to maintain a Compound Annual Growth Rate (CAGR) exceeding 4.50% from 2025 to 2033. This expansion is fueled by increasing demand from diverse end-use sectors, including the automotive, construction, and electronics industries. The rising adoption of bisphenol-A in polycarbonate production for lightweight automotive components and durable electronics housings is a significant driver. Furthermore, the growing popularity of phenolic resins in composites for construction applications, and the consistent demand for caprolactam and adipic acid in nylon production are contributing factors. Regional variations exist, with the Asia-Pacific region, particularly China and India, expected to lead market growth due to rapid industrialization and expanding infrastructure development. However, fluctuating raw material prices and stringent environmental regulations pose challenges to market expansion. Competitive dynamics are shaped by the presence of both established multinational corporations like BASF SE and DIC Corporation and regional players, leading to a diverse landscape of production capacities and technological advancements. The market segmentation, characterized by various derivatives like bisphenol-A, phenolic resin, caprolactam, and adipic acid, reflects the wide-ranging applications of phenol derivatives and the specialized nature of their production. This creates opportunities for manufacturers who can effectively cater to the specific needs of different industries.
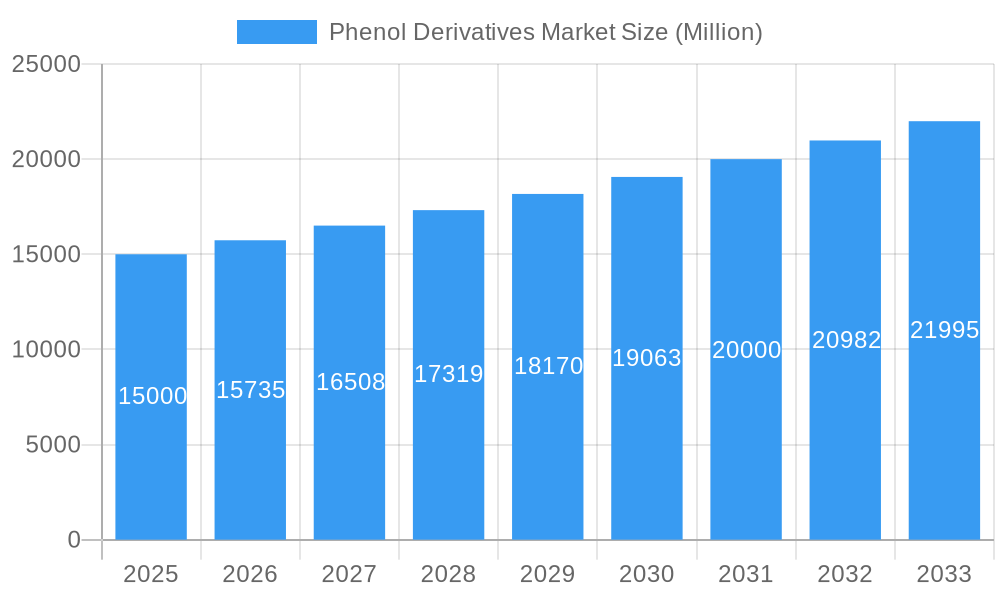
Phenol Derivatives Market Market Size (In Billion)
The future trajectory of the Phenol Derivatives market hinges on several factors. Technological advancements in production processes aiming for enhanced efficiency and reduced environmental impact will play a crucial role. Government policies promoting sustainable materials and encouraging innovation in material science will further influence market growth. The increasing emphasis on lightweighting in the automotive and aerospace sectors will continue to drive demand for specific phenol derivatives. Maintaining a balance between meeting the growing global demand and mitigating the environmental concerns associated with production will be key for industry stakeholders. The market is expected to consolidate further, with larger players potentially acquiring smaller companies to gain market share and expand their product portfolios. Strategic partnerships and collaborations are anticipated to drive innovation and accelerate market penetration.
Phenol Derivatives Market Company Market Share
Phenol Derivatives Market: A Comprehensive Market Report (2019-2033)
This comprehensive report provides a detailed analysis of the Phenol Derivatives market, encompassing market dynamics, growth trends, regional dominance, product landscape, key challenges, emerging opportunities, and key players. The study period spans from 2019 to 2033, with 2025 serving as the base and estimated year. The report offers invaluable insights for industry professionals, investors, and strategic decision-makers seeking to navigate this dynamic market. The market is segmented by derivatives, including Bisphenol-A, Phenolic Resin, Caprolactam, Adipic Acid, and Other Derivatives. The total market size is projected to reach xx Million by 2033.
Parent Market: Chemical Industry Child Market: Specialty Chemicals
Phenol Derivatives Market Dynamics & Structure
This section analyzes the competitive landscape of the Phenol Derivatives market, including market concentration, technological advancements, regulatory influences, and M&A activities. The report delves into the factors shaping market dynamics, providing both quantitative and qualitative insights.
- Market Concentration: The market exhibits a moderately concentrated structure, with key players holding significant market share. The top five players account for approximately xx% of the global market (2024). This concentration is influenced by economies of scale and significant capital investment requirements.
- Technological Innovation: Continuous innovation in production processes and the development of new derivatives are key drivers. The transition towards bio-based feedstocks is gaining momentum, presenting both opportunities and challenges. Innovation barriers include high R&D costs and regulatory compliance requirements.
- Regulatory Frameworks: Stringent environmental regulations regarding emissions and waste disposal are shaping production processes. Furthermore, safety regulations concerning handling and storage of phenol derivatives play a crucial role. Government policies promoting sustainable chemicals also impact market growth.
- Competitive Product Substitutes: The market faces competition from alternative materials in specific applications. The degree of competition varies depending on the derivative and its application.
- End-User Demographics: The diverse end-use industries (e.g., construction, automotive, electronics) create varied demand patterns. Growth in certain end-use sectors directly influences the market demand for specific phenol derivatives.
- M&A Trends: Consolidation through mergers and acquisitions has been observed in recent years. The number of M&A deals in the period 2019-2024 totaled xx, primarily driven by companies seeking to expand their product portfolios and market reach.
Phenol Derivatives Market Growth Trends & Insights
This section examines the historical and projected growth trajectory of the Phenol Derivatives market. Leveraging comprehensive data analysis and market research methodologies, this segment illuminates the dynamic interplay between market size evolution, adoption rates, technological shifts, and evolving consumer preferences. Specific metrics such as Compound Annual Growth Rate (CAGR), market penetration, and market share are provided. The market has witnessed a CAGR of xx% during 2019-2024, and is projected to experience a CAGR of xx% during the forecast period (2025-2033), reaching a market size of xx Million by 2033. This growth is driven by increased demand from key end-use sectors, technological advancements, and emerging applications.
Dominant Regions, Countries, or Segments in Phenol Derivatives Market
This section identifies the leading regions and segments driving market growth.
- Bisphenol-A: The Asia-Pacific region, specifically China and India, dominates the Bisphenol-A segment due to rapid industrialization and substantial demand from the construction and automotive industries. The opening of a new production facility in Pune, India in August 2022 further exemplifies this regional dominance.
- Phenolic Resin: North America and Europe hold significant market shares in the Phenolic Resin segment, driven by established manufacturing infrastructure and robust demand from the construction industry.
- Caprolactam: Asia-Pacific dominates this segment due to its large textile industry.
- Adipic Acid: Similar to Caprolactam, Asia-Pacific holds significant market share.
- Other Derivatives: Market growth in this segment is driven by emerging applications and diversification across various end-use industries. The global distribution of this segment is influenced by the specific derivatives and their associated applications.
Key Drivers:
- Favorable economic policies in developing economies.
- Growing infrastructure development.
- Increasing demand from key end-use sectors.
Phenol Derivatives Market Product Landscape
The Phenol Derivatives market offers a diverse range of products with varying applications and performance characteristics. Recent innovations focus on improving product performance, sustainability, and cost-effectiveness. The development of bio-attributed phenol products, such as those launched by INEOS Phenol in June 2022, represents a significant advancement, addressing environmental concerns and offering unique selling propositions. These bio-based alternatives reduce reliance on fossil fuels, appealing to environmentally conscious consumers and industries. Advancements in resin formulation provide enhanced properties like improved strength, durability and heat resistance.
Key Drivers, Barriers & Challenges in Phenol Derivatives Market
Key Drivers:
- Growing demand from various end-use industries, particularly construction, automotive, and electronics.
- Technological advancements leading to improved product performance and efficiency.
- Government initiatives and policies promoting sustainable chemicals.
Key Challenges & Restraints:
- Fluctuations in raw material prices significantly impact production costs.
- Stringent environmental regulations require significant investments in emission control technologies.
- Intense competition among established players and the emergence of new entrants.
- Supply chain disruptions (e.g., xx% increase in transportation costs in 2022) can impact production and availability.
Emerging Opportunities in Phenol Derivatives Market
Emerging opportunities include:
- Expanding into untapped markets in developing economies.
- Development of new derivatives with specialized applications in high-growth sectors such as renewable energy and advanced materials.
- Meeting the growing demand for bio-based and sustainable alternatives.
- Collaborations and strategic partnerships to leverage technological advancements and improve supply chain efficiency.
Growth Accelerators in the Phenol Derivatives Market Industry
Long-term growth will be fueled by ongoing technological advancements in production processes, the development of novel applications, and strategic alliances fostering innovation and market expansion. Investment in R&D to develop high-performance and sustainable derivatives will further accelerate market growth. Increased adoption in emerging markets will significantly contribute to market expansion.
Key Players Shaping the Phenol Derivatives Market Market
- DIC Corporation
- Shell PLC
- Fibrant
- Domo Chemical
- AdvanSix Inc
- Cepsa
- Altivia
- BASF SE
- INEOS Capital Ltd
- Fujian Yongrong Jinjiang Co Ltd
- PTT Phenol Company Limited
- Solvay SA
- Mitsubishi Chemical Corporation
- Mitsui Chemicals Inc
Notable Milestones in Phenol Derivatives Market Sector
- August 2022: A new bisphenol-A production facility opened in Pune, India, reducing reliance on imports (1.35 lakh tons annually from the US and China).
- June 2022: INEOS Phenol launched its first bio-attributed product line (INVIRIDIS brand), reducing fossil fuel reliance.
In-Depth Phenol Derivatives Market Market Outlook
The Phenol Derivatives market is poised for robust growth in the coming years, driven by continued demand from diverse industries and technological advancements. Strategic partnerships, expansion into new markets, and the development of sustainable and high-performance derivatives will shape the future market landscape. The market presents significant opportunities for established players and new entrants seeking to capitalize on the growing demand for innovative and sustainable solutions.
Phenol Derivatives Market Segmentation
-
1. Derivatives
- 1.1. Bisphenol-A
- 1.2. Phenolic Resin
- 1.3. Caprolactam
- 1.4. Adipic Acid
- 1.5. Other Derivatives
Phenol Derivatives Market Segmentation By Geography
-
1. Asia Pacific
- 1.1. China
- 1.2. India
- 1.3. Japan
- 1.4. South Korea
- 1.5. Rest of Asia Pacific
-
2. North America
- 2.1. United States
- 2.2. Canada
- 2.3. Mexico
-
3. Europe
- 3.1. Germany
- 3.2. France
- 3.3. United Kingdom
- 3.4. Italy
- 3.5. Rest of the Europe
-
4. South America
- 4.1. Brazil
- 4.2. Argentina
- 4.3. Rest of South America
-
5. Middle East and Africa
- 5.1. Saudi Arabia
- 5.2. South Africa
- 5.3. Rest of Middle East and Africa
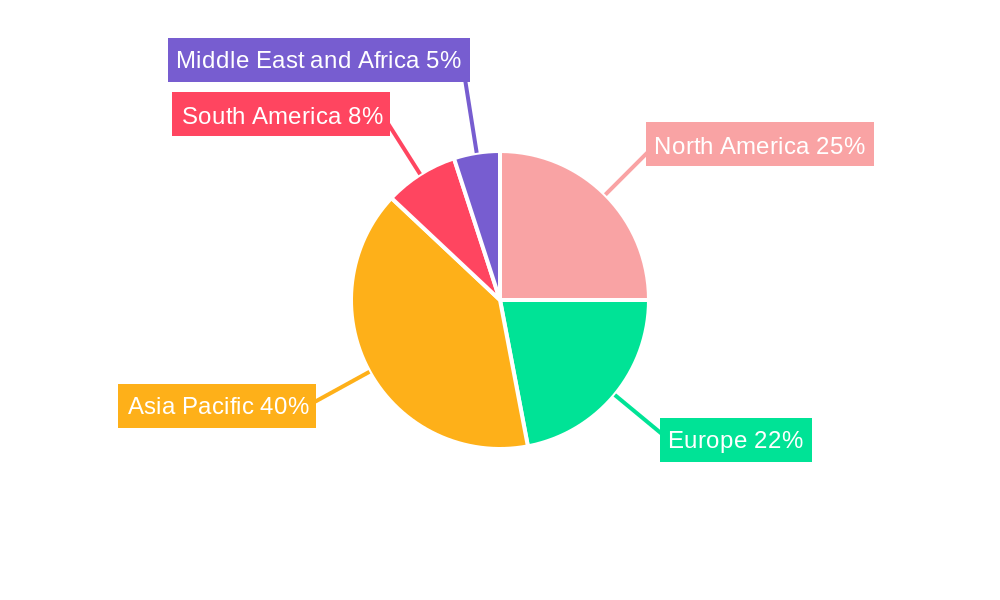
Phenol Derivatives Market Regional Market Share
Geographic Coverage of Phenol Derivatives Market
Phenol Derivatives Market REPORT HIGHLIGHTS
| Aspects | Details |
|---|---|
| Study Period | 2020-2034 |
| Base Year | 2025 |
| Estimated Year | 2026 |
| Forecast Period | 2026-2034 |
| Historical Period | 2020-2025 |
| Growth Rate | CAGR of 4.3% from 2020-2034 |
| Segmentation |
|
Table of Contents
- 1. Introduction
- 1.1. Research Scope
- 1.2. Market Segmentation
- 1.3. Research Objective
- 1.4. Definitions and Assumptions
- 2. Executive Summary
- 2.1. Market Snapshot
- 3. Market Dynamics
- 3.1. Market Drivers
- 3.2. Market Restrains
- 3.3. Market Trends
- 3.4. Market Opportunities
- 4. Market Factor Analysis
- 4.1. Porters Five Forces
- 4.1.1. Bargaining Power of Suppliers
- 4.1.2. Bargaining Power of Buyers
- 4.1.3. Threat of New Entrants
- 4.1.4. Threat of Substitutes
- 4.1.5. Competitive Rivalry
- 4.2. PESTEL analysis
- 4.3. BCG Analysis
- 4.3.1. Stars (High Growth, High Market Share)
- 4.3.2. Cash Cows (Low Growth, High Market Share)
- 4.3.3. Question Mark (High Growth, Low Market Share)
- 4.3.4. Dogs (Low Growth, Low Market Share)
- 4.4. Ansoff Matrix Analysis
- 4.5. Supply Chain Analysis
- 4.6. Regulatory Landscape
- 4.7. Current Market Potential and Opportunity Assessment (TAM–SAM–SOM Framework)
- 4.8. IMR Analyst Note
- 4.1. Porters Five Forces
- 5. Market Analysis, Insights and Forecast 2021-2033
- 5.1. Market Analysis, Insights and Forecast - by Derivatives
- 5.1.1. Bisphenol-A
- 5.1.2. Phenolic Resin
- 5.1.3. Caprolactam
- 5.1.4. Adipic Acid
- 5.1.5. Other Derivatives
- 5.2. Market Analysis, Insights and Forecast - by Region
- 5.2.1. Asia Pacific
- 5.2.2. North America
- 5.2.3. Europe
- 5.2.4. South America
- 5.2.5. Middle East and Africa
- 5.1. Market Analysis, Insights and Forecast - by Derivatives
- 6. Global Phenol Derivatives Market Analysis, Insights and Forecast, 2021-2033
- 6.1. Market Analysis, Insights and Forecast - by Derivatives
- 6.1.1. Bisphenol-A
- 6.1.2. Phenolic Resin
- 6.1.3. Caprolactam
- 6.1.4. Adipic Acid
- 6.1.5. Other Derivatives
- 6.1. Market Analysis, Insights and Forecast - by Derivatives
- 7. Asia Pacific Phenol Derivatives Market Analysis, Insights and Forecast, 2020-2032
- 7.1. Market Analysis, Insights and Forecast - by Derivatives
- 7.1.1. Bisphenol-A
- 7.1.2. Phenolic Resin
- 7.1.3. Caprolactam
- 7.1.4. Adipic Acid
- 7.1.5. Other Derivatives
- 7.1. Market Analysis, Insights and Forecast - by Derivatives
- 8. North America Phenol Derivatives Market Analysis, Insights and Forecast, 2020-2032
- 8.1. Market Analysis, Insights and Forecast - by Derivatives
- 8.1.1. Bisphenol-A
- 8.1.2. Phenolic Resin
- 8.1.3. Caprolactam
- 8.1.4. Adipic Acid
- 8.1.5. Other Derivatives
- 8.1. Market Analysis, Insights and Forecast - by Derivatives
- 9. Europe Phenol Derivatives Market Analysis, Insights and Forecast, 2020-2032
- 9.1. Market Analysis, Insights and Forecast - by Derivatives
- 9.1.1. Bisphenol-A
- 9.1.2. Phenolic Resin
- 9.1.3. Caprolactam
- 9.1.4. Adipic Acid
- 9.1.5. Other Derivatives
- 9.1. Market Analysis, Insights and Forecast - by Derivatives
- 10. South America Phenol Derivatives Market Analysis, Insights and Forecast, 2020-2032
- 10.1. Market Analysis, Insights and Forecast - by Derivatives
- 10.1.1. Bisphenol-A
- 10.1.2. Phenolic Resin
- 10.1.3. Caprolactam
- 10.1.4. Adipic Acid
- 10.1.5. Other Derivatives
- 10.1. Market Analysis, Insights and Forecast - by Derivatives
- 11. Middle East and Africa Phenol Derivatives Market Analysis, Insights and Forecast, 2020-2032
- 11.1. Market Analysis, Insights and Forecast - by Derivatives
- 11.1.1. Bisphenol-A
- 11.1.2. Phenolic Resin
- 11.1.3. Caprolactam
- 11.1.4. Adipic Acid
- 11.1.5. Other Derivatives
- 11.1. Market Analysis, Insights and Forecast - by Derivatives
- 12. Competitive Analysis
- 12.1. Company Profiles
- 12.1.1 DIC Corporation
- 12.1.1.1. Company Overview
- 12.1.1.2. Products
- 12.1.1.3. Company Financials
- 12.1.1.4. SWOT Analysis
- 12.1.2 Shell PLC
- 12.1.2.1. Company Overview
- 12.1.2.2. Products
- 12.1.2.3. Company Financials
- 12.1.2.4. SWOT Analysis
- 12.1.3 Fibrant
- 12.1.3.1. Company Overview
- 12.1.3.2. Products
- 12.1.3.3. Company Financials
- 12.1.3.4. SWOT Analysis
- 12.1.4 Domo Chemcial
- 12.1.4.1. Company Overview
- 12.1.4.2. Products
- 12.1.4.3. Company Financials
- 12.1.4.4. SWOT Analysis
- 12.1.5 AdvanSix Inc
- 12.1.5.1. Company Overview
- 12.1.5.2. Products
- 12.1.5.3. Company Financials
- 12.1.5.4. SWOT Analysis
- 12.1.6 Cepsa
- 12.1.6.1. Company Overview
- 12.1.6.2. Products
- 12.1.6.3. Company Financials
- 12.1.6.4. SWOT Analysis
- 12.1.7 Altivia
- 12.1.7.1. Company Overview
- 12.1.7.2. Products
- 12.1.7.3. Company Financials
- 12.1.7.4. SWOT Analysis
- 12.1.8 BASF SE
- 12.1.8.1. Company Overview
- 12.1.8.2. Products
- 12.1.8.3. Company Financials
- 12.1.8.4. SWOT Analysis
- 12.1.9 INEOS Capital Ltd
- 12.1.9.1. Company Overview
- 12.1.9.2. Products
- 12.1.9.3. Company Financials
- 12.1.9.4. SWOT Analysis
- 12.1.10 Fujian Yongrong Jinjiang Co Ltd
- 12.1.10.1. Company Overview
- 12.1.10.2. Products
- 12.1.10.3. Company Financials
- 12.1.10.4. SWOT Analysis
- 12.1.11 PTT Phenol Company Limited
- 12.1.11.1. Company Overview
- 12.1.11.2. Products
- 12.1.11.3. Company Financials
- 12.1.11.4. SWOT Analysis
- 12.1.12 Solvay SA*List Not Exhaustive
- 12.1.12.1. Company Overview
- 12.1.12.2. Products
- 12.1.12.3. Company Financials
- 12.1.12.4. SWOT Analysis
- 12.1.13 Mitsubishi Chemcial Corporation
- 12.1.13.1. Company Overview
- 12.1.13.2. Products
- 12.1.13.3. Company Financials
- 12.1.13.4. SWOT Analysis
- 12.1.14 Mitsui Chemcials Inc
- 12.1.14.1. Company Overview
- 12.1.14.2. Products
- 12.1.14.3. Company Financials
- 12.1.14.4. SWOT Analysis
- 12.1.1 DIC Corporation
- 12.2. Market Entropy
- 12.2.1 Company's Key Areas Served
- 12.2.2 Recent Developments
- 12.3. Company Market Share Analysis 2025
- 12.3.1 Top 5 Companies Market Share Analysis
- 12.3.2 Top 3 Companies Market Share Analysis
- 12.4. List of Potential Customers
- 13. Research Methodology
List of Figures
- Figure 1: Global Phenol Derivatives Market Revenue Breakdown (billion, %) by Region 2025 & 2033
- Figure 2: Asia Pacific Phenol Derivatives Market Revenue (billion), by Derivatives 2025 & 2033
- Figure 3: Asia Pacific Phenol Derivatives Market Revenue Share (%), by Derivatives 2025 & 2033
- Figure 4: Asia Pacific Phenol Derivatives Market Revenue (billion), by Country 2025 & 2033
- Figure 5: Asia Pacific Phenol Derivatives Market Revenue Share (%), by Country 2025 & 2033
- Figure 6: North America Phenol Derivatives Market Revenue (billion), by Derivatives 2025 & 2033
- Figure 7: North America Phenol Derivatives Market Revenue Share (%), by Derivatives 2025 & 2033
- Figure 8: North America Phenol Derivatives Market Revenue (billion), by Country 2025 & 2033
- Figure 9: North America Phenol Derivatives Market Revenue Share (%), by Country 2025 & 2033
- Figure 10: Europe Phenol Derivatives Market Revenue (billion), by Derivatives 2025 & 2033
- Figure 11: Europe Phenol Derivatives Market Revenue Share (%), by Derivatives 2025 & 2033
- Figure 12: Europe Phenol Derivatives Market Revenue (billion), by Country 2025 & 2033
- Figure 13: Europe Phenol Derivatives Market Revenue Share (%), by Country 2025 & 2033
- Figure 14: South America Phenol Derivatives Market Revenue (billion), by Derivatives 2025 & 2033
- Figure 15: South America Phenol Derivatives Market Revenue Share (%), by Derivatives 2025 & 2033
- Figure 16: South America Phenol Derivatives Market Revenue (billion), by Country 2025 & 2033
- Figure 17: South America Phenol Derivatives Market Revenue Share (%), by Country 2025 & 2033
- Figure 18: Middle East and Africa Phenol Derivatives Market Revenue (billion), by Derivatives 2025 & 2033
- Figure 19: Middle East and Africa Phenol Derivatives Market Revenue Share (%), by Derivatives 2025 & 2033
- Figure 20: Middle East and Africa Phenol Derivatives Market Revenue (billion), by Country 2025 & 2033
- Figure 21: Middle East and Africa Phenol Derivatives Market Revenue Share (%), by Country 2025 & 2033
List of Tables
- Table 1: Global Phenol Derivatives Market Revenue billion Forecast, by Derivatives 2020 & 2033
- Table 2: Global Phenol Derivatives Market Revenue billion Forecast, by Region 2020 & 2033
- Table 3: Global Phenol Derivatives Market Revenue billion Forecast, by Derivatives 2020 & 2033
- Table 4: Global Phenol Derivatives Market Revenue billion Forecast, by Country 2020 & 2033
- Table 5: China Phenol Derivatives Market Revenue (billion) Forecast, by Application 2020 & 2033
- Table 6: India Phenol Derivatives Market Revenue (billion) Forecast, by Application 2020 & 2033
- Table 7: Japan Phenol Derivatives Market Revenue (billion) Forecast, by Application 2020 & 2033
- Table 8: South Korea Phenol Derivatives Market Revenue (billion) Forecast, by Application 2020 & 2033
- Table 9: Rest of Asia Pacific Phenol Derivatives Market Revenue (billion) Forecast, by Application 2020 & 2033
- Table 10: Global Phenol Derivatives Market Revenue billion Forecast, by Derivatives 2020 & 2033
- Table 11: Global Phenol Derivatives Market Revenue billion Forecast, by Country 2020 & 2033
- Table 12: United States Phenol Derivatives Market Revenue (billion) Forecast, by Application 2020 & 2033
- Table 13: Canada Phenol Derivatives Market Revenue (billion) Forecast, by Application 2020 & 2033
- Table 14: Mexico Phenol Derivatives Market Revenue (billion) Forecast, by Application 2020 & 2033
- Table 15: Global Phenol Derivatives Market Revenue billion Forecast, by Derivatives 2020 & 2033
- Table 16: Global Phenol Derivatives Market Revenue billion Forecast, by Country 2020 & 2033
- Table 17: Germany Phenol Derivatives Market Revenue (billion) Forecast, by Application 2020 & 2033
- Table 18: France Phenol Derivatives Market Revenue (billion) Forecast, by Application 2020 & 2033
- Table 19: United Kingdom Phenol Derivatives Market Revenue (billion) Forecast, by Application 2020 & 2033
- Table 20: Italy Phenol Derivatives Market Revenue (billion) Forecast, by Application 2020 & 2033
- Table 21: Rest of the Europe Phenol Derivatives Market Revenue (billion) Forecast, by Application 2020 & 2033
- Table 22: Global Phenol Derivatives Market Revenue billion Forecast, by Derivatives 2020 & 2033
- Table 23: Global Phenol Derivatives Market Revenue billion Forecast, by Country 2020 & 2033
- Table 24: Brazil Phenol Derivatives Market Revenue (billion) Forecast, by Application 2020 & 2033
- Table 25: Argentina Phenol Derivatives Market Revenue (billion) Forecast, by Application 2020 & 2033
- Table 26: Rest of South America Phenol Derivatives Market Revenue (billion) Forecast, by Application 2020 & 2033
- Table 27: Global Phenol Derivatives Market Revenue billion Forecast, by Derivatives 2020 & 2033
- Table 28: Global Phenol Derivatives Market Revenue billion Forecast, by Country 2020 & 2033
- Table 29: Saudi Arabia Phenol Derivatives Market Revenue (billion) Forecast, by Application 2020 & 2033
- Table 30: South Africa Phenol Derivatives Market Revenue (billion) Forecast, by Application 2020 & 2033
- Table 31: Rest of Middle East and Africa Phenol Derivatives Market Revenue (billion) Forecast, by Application 2020 & 2033
Frequently Asked Questions
1. What is the projected Compound Annual Growth Rate (CAGR) of the Phenol Derivatives Market?
The projected CAGR is approximately 4.3%.
2. Which companies are prominent players in the Phenol Derivatives Market?
Key companies in the market include DIC Corporation, Shell PLC, Fibrant, Domo Chemcial, AdvanSix Inc, Cepsa, Altivia, BASF SE, INEOS Capital Ltd, Fujian Yongrong Jinjiang Co Ltd, PTT Phenol Company Limited, Solvay SA*List Not Exhaustive, Mitsubishi Chemcial Corporation, Mitsui Chemcials Inc.
3. What are the main segments of the Phenol Derivatives Market?
The market segments include Derivatives.
4. Can you provide details about the market size?
The market size is estimated to be USD 13.3 billion as of 2022.
5. What are some drivers contributing to market growth?
Growing Demand from the Pharmaceutical Industry; Increasing Use of Phenol Derivatives in the Production of Agrochemicals. Dyes. and Other Specialty Chemicals..
6. What are the notable trends driving market growth?
Soaring Demand for Phenolic Resin.
7. Are there any restraints impacting market growth?
Stringent Environmental Regulations; Volatility in Raw Material Prices.
8. Can you provide examples of recent developments in the market?
August 2022: A new bisphenol-A production facility was opened in Pune, India. This facility will reduce imports of bisphenol-A to India by promoting domestic manufacturing. 1.35 lakh tons of bisphenol-A are imported into India from the United States and China.
9. What pricing options are available for accessing the report?
Pricing options include single-user, multi-user, and enterprise licenses priced at USD 4750, USD 5250, and USD 8750 respectively.
10. Is the market size provided in terms of value or volume?
The market size is provided in terms of value, measured in billion.
11. Are there any specific market keywords associated with the report?
Yes, the market keyword associated with the report is "Phenol Derivatives Market," which aids in identifying and referencing the specific market segment covered.
12. How do I determine which pricing option suits my needs best?
The pricing options vary based on user requirements and access needs. Individual users may opt for single-user licenses, while businesses requiring broader access may choose multi-user or enterprise licenses for cost-effective access to the report.
13. Are there any additional resources or data provided in the Phenol Derivatives Market report?
While the report offers comprehensive insights, it's advisable to review the specific contents or supplementary materials provided to ascertain if additional resources or data are available.
14. How can I stay updated on further developments or reports in the Phenol Derivatives Market?
To stay informed about further developments, trends, and reports in the Phenol Derivatives Market, consider subscribing to industry newsletters, following relevant companies and organizations, or regularly checking reputable industry news sources and publications.
Methodology
Step 1 - Identification of Relevant Samples Size from Population Database


Step 2 - Approaches for Defining Global Market Size (Value, Volume* & Price*)

Note*: In applicable scenarios
Step 3 - Data Sources
Primary Research
- Web Analytics
- Survey Reports
- Research Institute
- Latest Research Reports
- Opinion Leaders
Secondary Research
- Annual Reports
- White Paper
- Latest Press Release
- Industry Association
- Paid Database
- Investor Presentations

Step 4 - Data Triangulation
Involves using different sources of information in order to increase the validity of a study
These sources are likely to be stakeholders in a program - participants, other researchers, program staff, other community members, and so on.
Then we put all data in single framework & apply various statistical tools to find out the dynamic on the market.
During the analysis stage, feedback from the stakeholder groups would be compared to determine areas of agreement as well as areas of divergence