

Key Insights
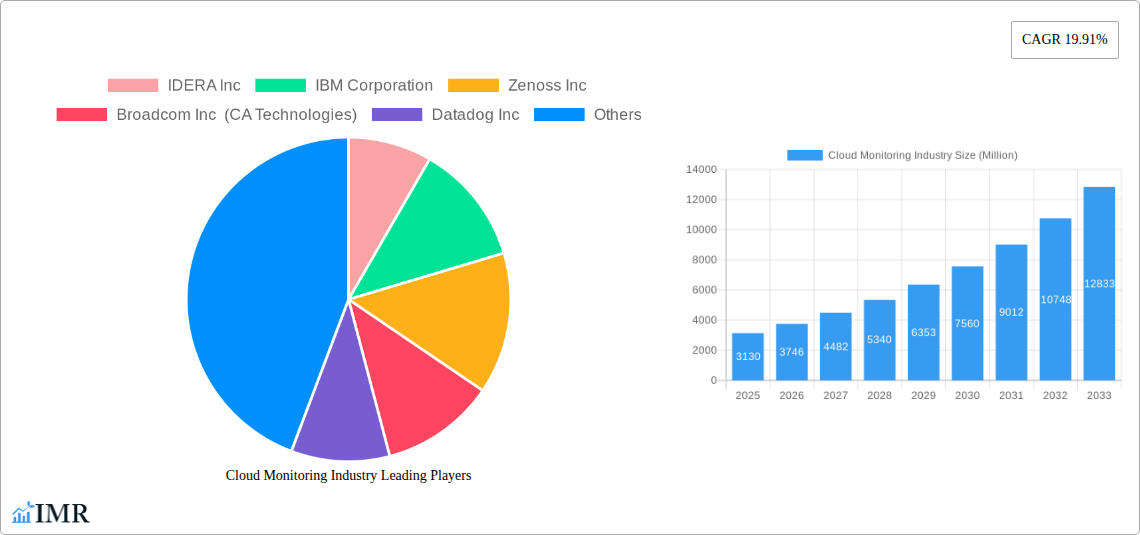
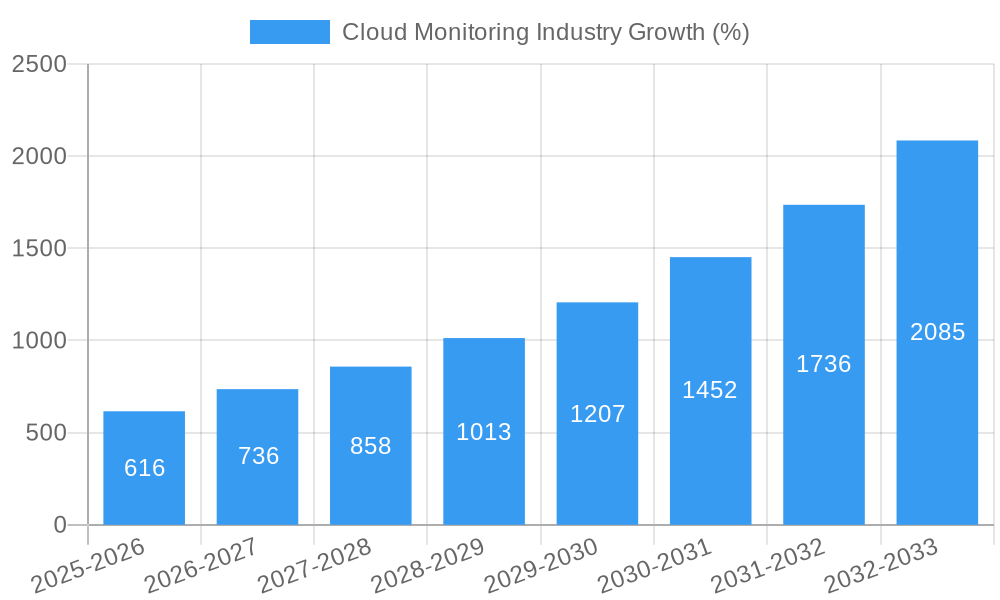
The global cloud monitoring market is experiencing robust growth, projected to reach $3.13 billion in 2025 and maintain a Compound Annual Growth Rate (CAGR) of 19.91% from 2025 to 2033. This expansion is driven by several key factors. The increasing adoption of cloud-based services across diverse industries, including BFSI (Banking, Financial Services, and Insurance), retail, IT and telecommunications, healthcare, and government, fuels the demand for comprehensive monitoring solutions. Furthermore, the rising complexity of cloud environments necessitates sophisticated tools to ensure performance, security, and cost optimization. The shift towards hybrid and multi-cloud deployments adds another layer of complexity, further driving the need for advanced monitoring capabilities. Key market trends include the integration of Artificial Intelligence (AI) and Machine Learning (ML) for predictive analytics and automation, enhancing efficiency and reducing operational costs. The adoption of serverless architectures and containerization also contributes to market growth, demanding specific monitoring solutions for these technologies. While challenges remain, such as the need for skilled professionals and the complexities of integrating monitoring tools across various cloud platforms, the overall market outlook remains extremely positive.
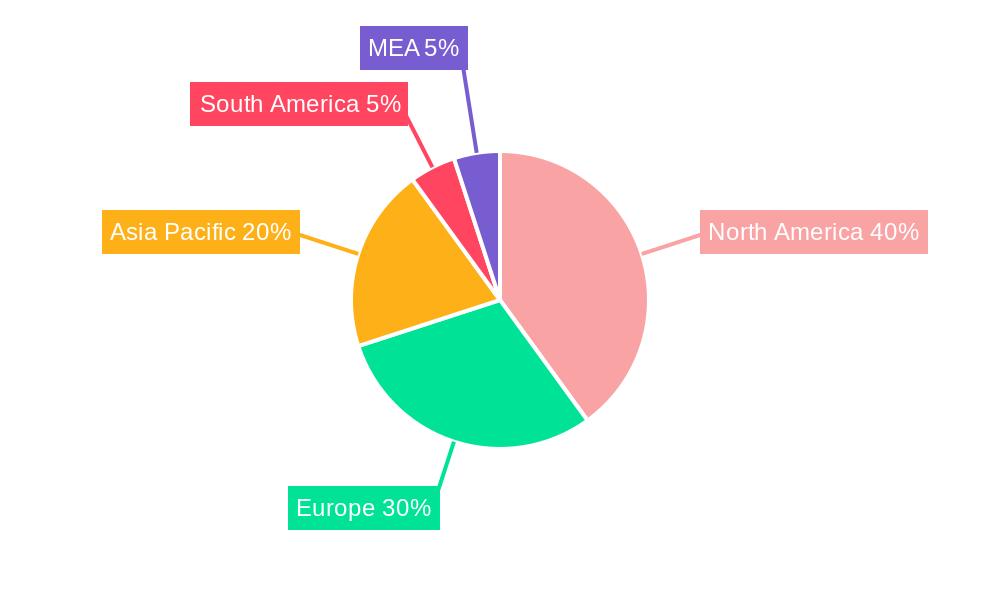
The competitive landscape is characterized by a mix of established players like IBM, Microsoft, and Oracle, alongside emerging innovative companies like Datadog and LogicMonitor. These companies are constantly innovating to offer enhanced features, including real-time dashboards, customizable alerts, and advanced analytics. Geographic distribution reflects the global nature of cloud adoption, with North America currently holding a significant market share due to early adoption and a robust technology infrastructure. However, rapid growth is expected in Asia-Pacific and other regions as cloud adoption matures. The market segmentation by model (IaaS, SaaS, PaaS) and end-user industry reveals distinct growth patterns within each segment, with the BFSI and IT & Telecommunications sectors leading the charge due to their high reliance on critical cloud infrastructure. The forecast period of 2025-2033 promises continued expansion as businesses increasingly rely on cloud computing for their core operations.
This comprehensive report provides an in-depth analysis of the Cloud Monitoring industry, encompassing market dynamics, growth trends, dominant segments, and key players. With a study period spanning 2019-2033, a base year of 2025, and a forecast period of 2025-2033, this report offers invaluable insights for industry professionals, investors, and strategic decision-makers. The report analyzes the parent market of Cloud Computing and the child market of Cloud Monitoring, offering a granular view of market segmentation by Model (IaaS, SaaS, PaaS) and End-User Industry (BFSI, Retail, IT & Telecommunications, Healthcare, Government, Manufacturing, Other). The market size is valued in Million units.
Cloud Monitoring Industry Market Dynamics & Structure
The cloud monitoring market is characterized by moderate concentration, with several major players holding significant market share, while numerous smaller companies cater to niche segments. Market growth is fueled by increasing cloud adoption across various industries, the rising complexity of cloud environments, and the demand for enhanced security and performance monitoring. Technological innovation, particularly in areas like AI-powered anomaly detection and automation, is a key driver. Regulatory frameworks related to data privacy and security significantly impact market dynamics, while competitive pressures from alternative monitoring solutions exist, but are limited by the specialized nature of the services. Mergers and acquisitions (M&A) activity has been moderate, with larger players acquiring smaller companies to enhance their product offerings and expand their market reach. The historical period (2019-2024) saw a CAGR of xx%, with the estimated year (2025) at $xx Million.
- Market Concentration: Moderately concentrated, with top 5 players holding approximately xx% market share in 2025.
- Technological Innovation: AI/ML-driven anomaly detection, automated remediation, and enhanced observability are driving innovation.
- Regulatory Landscape: GDPR, CCPA, and other data privacy regulations influence vendor strategies and customer choices.
- Competitive Substitutes: Limited direct substitutes, mainly from legacy on-premise monitoring systems, with a decreasing market share.
- M&A Activity: Moderate activity, with approximately xx deals closed between 2019 and 2024.
Cloud Monitoring Industry Growth Trends & Insights
The global cloud monitoring market is experiencing robust growth, driven by the increasing adoption of cloud computing services across diverse industries. The shift from on-premise infrastructure to cloud-based solutions is a major catalyst, leading to a surge in demand for effective monitoring tools. Technological advancements, such as AI-powered analytics and automation, are further enhancing the capabilities of cloud monitoring platforms, making them more efficient and cost-effective. Consumer behavior is shifting towards more sophisticated monitoring solutions, emphasizing real-time insights and proactive alerts. The market exhibited a CAGR of xx% during the historical period (2019-2024), reaching an estimated value of $xx Million in 2025. This positive trend is projected to continue during the forecast period (2025-2033), driven by increasing cloud adoption across all segments. Market penetration is currently at xx%, with significant potential for further growth, particularly in emerging markets.
Dominant Regions, Countries, or Segments in Cloud Monitoring Industry
North America currently holds the largest market share in the cloud monitoring industry, driven by high cloud adoption rates and the presence of major technology companies. Within North America, the United States is the leading market, benefiting from robust IT infrastructure and a strong focus on digital transformation. However, the Asia-Pacific region is expected to witness the fastest growth during the forecast period, fueled by increasing cloud adoption in countries like China and India. The SaaS model dominates the cloud monitoring market in terms of revenue share due to its scalability, accessibility and ease of deployment. The BFSI sector exhibits the highest spending on cloud monitoring due to stringent regulatory compliance and the critical nature of financial data security. The IT and Telecommunications sector also holds a significant share, reflecting the increasing reliance on cloud infrastructure.
- North America: High cloud adoption, presence of major technology vendors, robust IT infrastructure.
- Asia-Pacific: Fastest-growing region, driven by emerging markets like India and China.
- SaaS Model: Leading revenue share due to ease of deployment and scalability.
- BFSI Sector: Highest spending due to regulatory compliance and data security needs.
- IT & Telecommunications: Significant market share due to reliance on cloud infrastructure.
Cloud Monitoring Industry Product Landscape
The cloud monitoring market offers a diverse range of products, from basic monitoring tools to sophisticated platforms incorporating AI and machine learning. These products cater to various needs, including infrastructure monitoring, application performance management, security monitoring, and log management. Key features include real-time dashboards, automated alerts, customizable reporting, and integration with various cloud platforms. Continuous innovation introduces improved scalability, enhanced security measures, and more intelligent analytics capabilities. Unique selling propositions often focus on superior performance, user-friendliness, and seamless integration with existing IT infrastructure.
Key Drivers, Barriers & Challenges in Cloud Monitoring Industry
Key Drivers:
- Increasing cloud adoption across various industries.
- Growing complexity of cloud environments.
- Demand for improved security and compliance.
- Technological advancements, particularly in AI and automation.
Key Barriers & Challenges:
- High initial investment costs for implementing cloud monitoring solutions.
- Complexity of integrating with existing IT infrastructure.
- Shortage of skilled professionals in cloud monitoring.
- Data privacy and security concerns.
- Competition from legacy on-premise monitoring systems. The transition to cloud-based systems can be challenging for some companies due to integration complexities and training requirements. This leads to slower adoption rates than expected.
Emerging Opportunities in Cloud Monitoring Industry
- Growth in IoT and edge computing driving the need for specialized monitoring solutions.
- Expanding demand for AI-powered predictive analytics for proactive problem resolution.
- Growing adoption of serverless computing necessitating specific monitoring tools.
- Increased focus on AIOps and automation to reduce operational costs.
- Emergence of cloud-native monitoring solutions tailored to specific cloud platforms.
Growth Accelerators in the Cloud Monitoring Industry Industry
The long-term growth of the cloud monitoring market is fueled by continuous technological innovation, strategic partnerships between vendors and cloud providers, and the expansion of cloud computing into new industries and geographies. Breakthroughs in areas like AI-powered anomaly detection and predictive maintenance enhance the value proposition of cloud monitoring tools, driving adoption. Strategic alliances between monitoring vendors and cloud providers provide seamless integration and broader reach, while market expansion into untapped sectors, especially in emerging economies, offers substantial growth opportunities.
Key Players Shaping the Cloud Monitoring Industry Market
- IDERA Inc
- IBM Corporation
- Zenoss Inc
- Broadcom Inc (CA Technologies)
- Datadog Inc
- Microsoft Corporation
- Oracle Corporation
- AWS
- LogicMonitor Inc
Notable Milestones in Cloud Monitoring Industry Sector
- June 2022: Cisco expanded its cloud-based management solutions with Nexus and Catalyst switches and a cloud-native AppDynamics APM. This enhanced its competitive position in the market by offering a more comprehensive cloud management solution.
- April 2023: Sumo Logic earned the AWS cloud operations competency in monitoring and observability. This validates Sumo Logic's expertise in cloud monitoring and strengthens its market presence.
In-Depth Cloud Monitoring Industry Market Outlook
The cloud monitoring market is poised for continued robust growth, driven by the ongoing expansion of cloud adoption and technological innovation. The focus on AI-powered analytics, automation, and enhanced security will be key growth drivers. Strategic partnerships and expansions into emerging markets will further accelerate market expansion. This translates to significant opportunities for both established players and emerging companies, creating a dynamic and competitive landscape ripe for investment and innovation. The forecast period (2025-2033) is anticipated to witness a CAGR of xx%, resulting in a market size of $xx Million by 2033.
Cloud Monitoring Industry Segmentation
-
1. Model
- 1.1. IaaS
- 1.2. SaaS
- 1.3. PaaS
-
2. End-User Industry
- 2.1. BFSI
- 2.2. Retail
- 2.3. IT and Telecommunications
- 2.4. Healthcare
- 2.5. Government
- 2.6. Manufacturing
- 2.7. Other End-User Industries
Cloud Monitoring Industry Segmentation By Geography
-
1. North America
- 1.1. United States
- 1.2. Canada
-
2. Europe
- 2.1. United Kingdom
- 2.2. Germany
- 2.3. France
- 2.4. Spain
-
3. Asia
- 3.1. China
- 3.2. Japan
- 3.3. Singapore
- 3.4. Australia and New Zealand
-
4. Latin America
- 4.1. Mexico
- 4.2. Brazil
-
5. Middle East and Africa
- 5.1. United Arab Emirates
- 5.2. Saudi Arabia
Cloud Monitoring Industry REPORT HIGHLIGHTS
| Aspects | Details |
|---|---|
| Study Period | 2019-2033 |
| Base Year | 2024 |
| Estimated Year | 2025 |
| Forecast Period | 2025-2033 |
| Historical Period | 2019-2024 |
| Growth Rate | CAGR of 19.91% from 2019-2033 |
| Segmentation |
|
Table of Contents
- 1. Introduction
- 1.1. Research Scope
- 1.2. Market Segmentation
- 1.3. Research Methodology
- 1.4. Definitions and Assumptions
- 2. Executive Summary
- 2.1. Introduction
- 3. Market Dynamics
- 3.1. Introduction
- 3.2. Market Drivers
- 3.2.1. Growth in Cloud Adoption Across End Users; Rising Need for Efficiently Managing the Performance and Security of Cloud Platforms
- 3.3. Market Restrains
- 3.3.1. Diminishing Profit Margins and Ongoing Changes in Macro-environment
- 3.4. Market Trends
- 3.4.1. Growth in Cloud Adoption Across End Users is Expected to Drive the Market Growth
- 4. Market Factor Analysis
- 4.1. Porters Five Forces
- 4.2. Supply/Value Chain
- 4.3. PESTEL analysis
- 4.4. Market Entropy
- 4.5. Patent/Trademark Analysis
- 5. Global Cloud Monitoring Industry Analysis, Insights and Forecast, 2019-2031
- 5.1. Market Analysis, Insights and Forecast - by Model
- 5.1.1. IaaS
- 5.1.2. SaaS
- 5.1.3. PaaS
- 5.2. Market Analysis, Insights and Forecast - by End-User Industry
- 5.2.1. BFSI
- 5.2.2. Retail
- 5.2.3. IT and Telecommunications
- 5.2.4. Healthcare
- 5.2.5. Government
- 5.2.6. Manufacturing
- 5.2.7. Other End-User Industries
- 5.3. Market Analysis, Insights and Forecast - by Region
- 5.3.1. North America
- 5.3.2. Europe
- 5.3.3. Asia
- 5.3.4. Latin America
- 5.3.5. Middle East and Africa
- 5.1. Market Analysis, Insights and Forecast - by Model
- 6. North America Cloud Monitoring Industry Analysis, Insights and Forecast, 2019-2031
- 6.1. Market Analysis, Insights and Forecast - by Model
- 6.1.1. IaaS
- 6.1.2. SaaS
- 6.1.3. PaaS
- 6.2. Market Analysis, Insights and Forecast - by End-User Industry
- 6.2.1. BFSI
- 6.2.2. Retail
- 6.2.3. IT and Telecommunications
- 6.2.4. Healthcare
- 6.2.5. Government
- 6.2.6. Manufacturing
- 6.2.7. Other End-User Industries
- 6.1. Market Analysis, Insights and Forecast - by Model
- 7. Europe Cloud Monitoring Industry Analysis, Insights and Forecast, 2019-2031
- 7.1. Market Analysis, Insights and Forecast - by Model
- 7.1.1. IaaS
- 7.1.2. SaaS
- 7.1.3. PaaS
- 7.2. Market Analysis, Insights and Forecast - by End-User Industry
- 7.2.1. BFSI
- 7.2.2. Retail
- 7.2.3. IT and Telecommunications
- 7.2.4. Healthcare
- 7.2.5. Government
- 7.2.6. Manufacturing
- 7.2.7. Other End-User Industries
- 7.1. Market Analysis, Insights and Forecast - by Model
- 8. Asia Cloud Monitoring Industry Analysis, Insights and Forecast, 2019-2031
- 8.1. Market Analysis, Insights and Forecast - by Model
- 8.1.1. IaaS
- 8.1.2. SaaS
- 8.1.3. PaaS
- 8.2. Market Analysis, Insights and Forecast - by End-User Industry
- 8.2.1. BFSI
- 8.2.2. Retail
- 8.2.3. IT and Telecommunications
- 8.2.4. Healthcare
- 8.2.5. Government
- 8.2.6. Manufacturing
- 8.2.7. Other End-User Industries
- 8.1. Market Analysis, Insights and Forecast - by Model
- 9. Latin America Cloud Monitoring Industry Analysis, Insights and Forecast, 2019-2031
- 9.1. Market Analysis, Insights and Forecast - by Model
- 9.1.1. IaaS
- 9.1.2. SaaS
- 9.1.3. PaaS
- 9.2. Market Analysis, Insights and Forecast - by End-User Industry
- 9.2.1. BFSI
- 9.2.2. Retail
- 9.2.3. IT and Telecommunications
- 9.2.4. Healthcare
- 9.2.5. Government
- 9.2.6. Manufacturing
- 9.2.7. Other End-User Industries
- 9.1. Market Analysis, Insights and Forecast - by Model
- 10. Middle East and Africa Cloud Monitoring Industry Analysis, Insights and Forecast, 2019-2031
- 10.1. Market Analysis, Insights and Forecast - by Model
- 10.1.1. IaaS
- 10.1.2. SaaS
- 10.1.3. PaaS
- 10.2. Market Analysis, Insights and Forecast - by End-User Industry
- 10.2.1. BFSI
- 10.2.2. Retail
- 10.2.3. IT and Telecommunications
- 10.2.4. Healthcare
- 10.2.5. Government
- 10.2.6. Manufacturing
- 10.2.7. Other End-User Industries
- 10.1. Market Analysis, Insights and Forecast - by Model
- 11. North America Cloud Monitoring Industry Analysis, Insights and Forecast, 2019-2031
- 11.1. Market Analysis, Insights and Forecast - By Country/Sub-region
- 11.1.1 United States
- 11.1.2 Canada
- 11.1.3 Mexico
- 12. Europe Cloud Monitoring Industry Analysis, Insights and Forecast, 2019-2031
- 12.1. Market Analysis, Insights and Forecast - By Country/Sub-region
- 12.1.1 Germany
- 12.1.2 United Kingdom
- 12.1.3 France
- 12.1.4 Spain
- 12.1.5 Italy
- 12.1.6 Spain
- 12.1.7 Belgium
- 12.1.8 Netherland
- 12.1.9 Nordics
- 12.1.10 Rest of Europe
- 13. Asia Pacific Cloud Monitoring Industry Analysis, Insights and Forecast, 2019-2031
- 13.1. Market Analysis, Insights and Forecast - By Country/Sub-region
- 13.1.1 China
- 13.1.2 Japan
- 13.1.3 India
- 13.1.4 South Korea
- 13.1.5 Southeast Asia
- 13.1.6 Australia
- 13.1.7 Indonesia
- 13.1.8 Phillipes
- 13.1.9 Singapore
- 13.1.10 Thailandc
- 13.1.11 Rest of Asia Pacific
- 14. South America Cloud Monitoring Industry Analysis, Insights and Forecast, 2019-2031
- 14.1. Market Analysis, Insights and Forecast - By Country/Sub-region
- 14.1.1 Brazil
- 14.1.2 Argentina
- 14.1.3 Peru
- 14.1.4 Chile
- 14.1.5 Colombia
- 14.1.6 Ecuador
- 14.1.7 Venezuela
- 14.1.8 Rest of South America
- 15. North America Cloud Monitoring Industry Analysis, Insights and Forecast, 2019-2031
- 15.1. Market Analysis, Insights and Forecast - By Country/Sub-region
- 15.1.1 United States
- 15.1.2 Canada
- 15.1.3 Mexico
- 16. MEA Cloud Monitoring Industry Analysis, Insights and Forecast, 2019-2031
- 16.1. Market Analysis, Insights and Forecast - By Country/Sub-region
- 16.1.1 United Arab Emirates
- 16.1.2 Saudi Arabia
- 16.1.3 South Africa
- 16.1.4 Rest of Middle East and Africa
- 17. Competitive Analysis
- 17.1. Global Market Share Analysis 2024
- 17.2. Company Profiles
- 17.2.1 IDERA Inc
- 17.2.1.1. Overview
- 17.2.1.2. Products
- 17.2.1.3. SWOT Analysis
- 17.2.1.4. Recent Developments
- 17.2.1.5. Financials (Based on Availability)
- 17.2.2 IBM Corporation
- 17.2.2.1. Overview
- 17.2.2.2. Products
- 17.2.2.3. SWOT Analysis
- 17.2.2.4. Recent Developments
- 17.2.2.5. Financials (Based on Availability)
- 17.2.3 Zenoss Inc
- 17.2.3.1. Overview
- 17.2.3.2. Products
- 17.2.3.3. SWOT Analysis
- 17.2.3.4. Recent Developments
- 17.2.3.5. Financials (Based on Availability)
- 17.2.4 Broadcom Inc (CA Technologies)
- 17.2.4.1. Overview
- 17.2.4.2. Products
- 17.2.4.3. SWOT Analysis
- 17.2.4.4. Recent Developments
- 17.2.4.5. Financials (Based on Availability)
- 17.2.5 Datadog Inc
- 17.2.5.1. Overview
- 17.2.5.2. Products
- 17.2.5.3. SWOT Analysis
- 17.2.5.4. Recent Developments
- 17.2.5.5. Financials (Based on Availability)
- 17.2.6 Microsoft Corporation
- 17.2.6.1. Overview
- 17.2.6.2. Products
- 17.2.6.3. SWOT Analysis
- 17.2.6.4. Recent Developments
- 17.2.6.5. Financials (Based on Availability)
- 17.2.7 Oracle Corporation
- 17.2.7.1. Overview
- 17.2.7.2. Products
- 17.2.7.3. SWOT Analysis
- 17.2.7.4. Recent Developments
- 17.2.7.5. Financials (Based on Availability)
- 17.2.8 AWS
- 17.2.8.1. Overview
- 17.2.8.2. Products
- 17.2.8.3. SWOT Analysis
- 17.2.8.4. Recent Developments
- 17.2.8.5. Financials (Based on Availability)
- 17.2.9 LogicMonitor Inc
- 17.2.9.1. Overview
- 17.2.9.2. Products
- 17.2.9.3. SWOT Analysis
- 17.2.9.4. Recent Developments
- 17.2.9.5. Financials (Based on Availability)
- 17.2.1 IDERA Inc
List of Figures
- Figure 1: Global Cloud Monitoring Industry Revenue Breakdown (Million, %) by Region 2024 & 2032
- Figure 2: Global Cloud Monitoring Industry Volume Breakdown (K Unit, %) by Region 2024 & 2032
- Figure 3: North America Cloud Monitoring Industry Revenue (Million), by Country 2024 & 2032
- Figure 4: North America Cloud Monitoring Industry Volume (K Unit), by Country 2024 & 2032
- Figure 5: North America Cloud Monitoring Industry Revenue Share (%), by Country 2024 & 2032
- Figure 6: North America Cloud Monitoring Industry Volume Share (%), by Country 2024 & 2032
- Figure 7: Europe Cloud Monitoring Industry Revenue (Million), by Country 2024 & 2032
- Figure 8: Europe Cloud Monitoring Industry Volume (K Unit), by Country 2024 & 2032
- Figure 9: Europe Cloud Monitoring Industry Revenue Share (%), by Country 2024 & 2032
- Figure 10: Europe Cloud Monitoring Industry Volume Share (%), by Country 2024 & 2032
- Figure 11: Asia Pacific Cloud Monitoring Industry Revenue (Million), by Country 2024 & 2032
- Figure 12: Asia Pacific Cloud Monitoring Industry Volume (K Unit), by Country 2024 & 2032
- Figure 13: Asia Pacific Cloud Monitoring Industry Revenue Share (%), by Country 2024 & 2032
- Figure 14: Asia Pacific Cloud Monitoring Industry Volume Share (%), by Country 2024 & 2032
- Figure 15: South America Cloud Monitoring Industry Revenue (Million), by Country 2024 & 2032
- Figure 16: South America Cloud Monitoring Industry Volume (K Unit), by Country 2024 & 2032
- Figure 17: South America Cloud Monitoring Industry Revenue Share (%), by Country 2024 & 2032
- Figure 18: South America Cloud Monitoring Industry Volume Share (%), by Country 2024 & 2032
- Figure 19: North America Cloud Monitoring Industry Revenue (Million), by Country 2024 & 2032
- Figure 20: North America Cloud Monitoring Industry Volume (K Unit), by Country 2024 & 2032
- Figure 21: North America Cloud Monitoring Industry Revenue Share (%), by Country 2024 & 2032
- Figure 22: North America Cloud Monitoring Industry Volume Share (%), by Country 2024 & 2032
- Figure 23: MEA Cloud Monitoring Industry Revenue (Million), by Country 2024 & 2032
- Figure 24: MEA Cloud Monitoring Industry Volume (K Unit), by Country 2024 & 2032
- Figure 25: MEA Cloud Monitoring Industry Revenue Share (%), by Country 2024 & 2032
- Figure 26: MEA Cloud Monitoring Industry Volume Share (%), by Country 2024 & 2032
- Figure 27: North America Cloud Monitoring Industry Revenue (Million), by Model 2024 & 2032
- Figure 28: North America Cloud Monitoring Industry Volume (K Unit), by Model 2024 & 2032
- Figure 29: North America Cloud Monitoring Industry Revenue Share (%), by Model 2024 & 2032
- Figure 30: North America Cloud Monitoring Industry Volume Share (%), by Model 2024 & 2032
- Figure 31: North America Cloud Monitoring Industry Revenue (Million), by End-User Industry 2024 & 2032
- Figure 32: North America Cloud Monitoring Industry Volume (K Unit), by End-User Industry 2024 & 2032
- Figure 33: North America Cloud Monitoring Industry Revenue Share (%), by End-User Industry 2024 & 2032
- Figure 34: North America Cloud Monitoring Industry Volume Share (%), by End-User Industry 2024 & 2032
- Figure 35: North America Cloud Monitoring Industry Revenue (Million), by Country 2024 & 2032
- Figure 36: North America Cloud Monitoring Industry Volume (K Unit), by Country 2024 & 2032
- Figure 37: North America Cloud Monitoring Industry Revenue Share (%), by Country 2024 & 2032
- Figure 38: North America Cloud Monitoring Industry Volume Share (%), by Country 2024 & 2032
- Figure 39: Europe Cloud Monitoring Industry Revenue (Million), by Model 2024 & 2032
- Figure 40: Europe Cloud Monitoring Industry Volume (K Unit), by Model 2024 & 2032
- Figure 41: Europe Cloud Monitoring Industry Revenue Share (%), by Model 2024 & 2032
- Figure 42: Europe Cloud Monitoring Industry Volume Share (%), by Model 2024 & 2032
- Figure 43: Europe Cloud Monitoring Industry Revenue (Million), by End-User Industry 2024 & 2032
- Figure 44: Europe Cloud Monitoring Industry Volume (K Unit), by End-User Industry 2024 & 2032
- Figure 45: Europe Cloud Monitoring Industry Revenue Share (%), by End-User Industry 2024 & 2032
- Figure 46: Europe Cloud Monitoring Industry Volume Share (%), by End-User Industry 2024 & 2032
- Figure 47: Europe Cloud Monitoring Industry Revenue (Million), by Country 2024 & 2032
- Figure 48: Europe Cloud Monitoring Industry Volume (K Unit), by Country 2024 & 2032
- Figure 49: Europe Cloud Monitoring Industry Revenue Share (%), by Country 2024 & 2032
- Figure 50: Europe Cloud Monitoring Industry Volume Share (%), by Country 2024 & 2032
- Figure 51: Asia Cloud Monitoring Industry Revenue (Million), by Model 2024 & 2032
- Figure 52: Asia Cloud Monitoring Industry Volume (K Unit), by Model 2024 & 2032
- Figure 53: Asia Cloud Monitoring Industry Revenue Share (%), by Model 2024 & 2032
- Figure 54: Asia Cloud Monitoring Industry Volume Share (%), by Model 2024 & 2032
- Figure 55: Asia Cloud Monitoring Industry Revenue (Million), by End-User Industry 2024 & 2032
- Figure 56: Asia Cloud Monitoring Industry Volume (K Unit), by End-User Industry 2024 & 2032
- Figure 57: Asia Cloud Monitoring Industry Revenue Share (%), by End-User Industry 2024 & 2032
- Figure 58: Asia Cloud Monitoring Industry Volume Share (%), by End-User Industry 2024 & 2032
- Figure 59: Asia Cloud Monitoring Industry Revenue (Million), by Country 2024 & 2032
- Figure 60: Asia Cloud Monitoring Industry Volume (K Unit), by Country 2024 & 2032
- Figure 61: Asia Cloud Monitoring Industry Revenue Share (%), by Country 2024 & 2032
- Figure 62: Asia Cloud Monitoring Industry Volume Share (%), by Country 2024 & 2032
- Figure 63: Latin America Cloud Monitoring Industry Revenue (Million), by Model 2024 & 2032
- Figure 64: Latin America Cloud Monitoring Industry Volume (K Unit), by Model 2024 & 2032
- Figure 65: Latin America Cloud Monitoring Industry Revenue Share (%), by Model 2024 & 2032
- Figure 66: Latin America Cloud Monitoring Industry Volume Share (%), by Model 2024 & 2032
- Figure 67: Latin America Cloud Monitoring Industry Revenue (Million), by End-User Industry 2024 & 2032
- Figure 68: Latin America Cloud Monitoring Industry Volume (K Unit), by End-User Industry 2024 & 2032
- Figure 69: Latin America Cloud Monitoring Industry Revenue Share (%), by End-User Industry 2024 & 2032
- Figure 70: Latin America Cloud Monitoring Industry Volume Share (%), by End-User Industry 2024 & 2032
- Figure 71: Latin America Cloud Monitoring Industry Revenue (Million), by Country 2024 & 2032
- Figure 72: Latin America Cloud Monitoring Industry Volume (K Unit), by Country 2024 & 2032
- Figure 73: Latin America Cloud Monitoring Industry Revenue Share (%), by Country 2024 & 2032
- Figure 74: Latin America Cloud Monitoring Industry Volume Share (%), by Country 2024 & 2032
- Figure 75: Middle East and Africa Cloud Monitoring Industry Revenue (Million), by Model 2024 & 2032
- Figure 76: Middle East and Africa Cloud Monitoring Industry Volume (K Unit), by Model 2024 & 2032
- Figure 77: Middle East and Africa Cloud Monitoring Industry Revenue Share (%), by Model 2024 & 2032
- Figure 78: Middle East and Africa Cloud Monitoring Industry Volume Share (%), by Model 2024 & 2032
- Figure 79: Middle East and Africa Cloud Monitoring Industry Revenue (Million), by End-User Industry 2024 & 2032
- Figure 80: Middle East and Africa Cloud Monitoring Industry Volume (K Unit), by End-User Industry 2024 & 2032
- Figure 81: Middle East and Africa Cloud Monitoring Industry Revenue Share (%), by End-User Industry 2024 & 2032
- Figure 82: Middle East and Africa Cloud Monitoring Industry Volume Share (%), by End-User Industry 2024 & 2032
- Figure 83: Middle East and Africa Cloud Monitoring Industry Revenue (Million), by Country 2024 & 2032
- Figure 84: Middle East and Africa Cloud Monitoring Industry Volume (K Unit), by Country 2024 & 2032
- Figure 85: Middle East and Africa Cloud Monitoring Industry Revenue Share (%), by Country 2024 & 2032
- Figure 86: Middle East and Africa Cloud Monitoring Industry Volume Share (%), by Country 2024 & 2032
List of Tables
- Table 1: Global Cloud Monitoring Industry Revenue Million Forecast, by Region 2019 & 2032
- Table 2: Global Cloud Monitoring Industry Volume K Unit Forecast, by Region 2019 & 2032
- Table 3: Global Cloud Monitoring Industry Revenue Million Forecast, by Model 2019 & 2032
- Table 4: Global Cloud Monitoring Industry Volume K Unit Forecast, by Model 2019 & 2032
- Table 5: Global Cloud Monitoring Industry Revenue Million Forecast, by End-User Industry 2019 & 2032
- Table 6: Global Cloud Monitoring Industry Volume K Unit Forecast, by End-User Industry 2019 & 2032
- Table 7: Global Cloud Monitoring Industry Revenue Million Forecast, by Region 2019 & 2032
- Table 8: Global Cloud Monitoring Industry Volume K Unit Forecast, by Region 2019 & 2032
- Table 9: Global Cloud Monitoring Industry Revenue Million Forecast, by Country 2019 & 2032
- Table 10: Global Cloud Monitoring Industry Volume K Unit Forecast, by Country 2019 & 2032
- Table 11: United States Cloud Monitoring Industry Revenue (Million) Forecast, by Application 2019 & 2032
- Table 12: United States Cloud Monitoring Industry Volume (K Unit) Forecast, by Application 2019 & 2032
- Table 13: Canada Cloud Monitoring Industry Revenue (Million) Forecast, by Application 2019 & 2032
- Table 14: Canada Cloud Monitoring Industry Volume (K Unit) Forecast, by Application 2019 & 2032
- Table 15: Mexico Cloud Monitoring Industry Revenue (Million) Forecast, by Application 2019 & 2032
- Table 16: Mexico Cloud Monitoring Industry Volume (K Unit) Forecast, by Application 2019 & 2032
- Table 17: Global Cloud Monitoring Industry Revenue Million Forecast, by Country 2019 & 2032
- Table 18: Global Cloud Monitoring Industry Volume K Unit Forecast, by Country 2019 & 2032
- Table 19: Germany Cloud Monitoring Industry Revenue (Million) Forecast, by Application 2019 & 2032
- Table 20: Germany Cloud Monitoring Industry Volume (K Unit) Forecast, by Application 2019 & 2032
- Table 21: United Kingdom Cloud Monitoring Industry Revenue (Million) Forecast, by Application 2019 & 2032
- Table 22: United Kingdom Cloud Monitoring Industry Volume (K Unit) Forecast, by Application 2019 & 2032
- Table 23: France Cloud Monitoring Industry Revenue (Million) Forecast, by Application 2019 & 2032
- Table 24: France Cloud Monitoring Industry Volume (K Unit) Forecast, by Application 2019 & 2032
- Table 25: Spain Cloud Monitoring Industry Revenue (Million) Forecast, by Application 2019 & 2032
- Table 26: Spain Cloud Monitoring Industry Volume (K Unit) Forecast, by Application 2019 & 2032
- Table 27: Italy Cloud Monitoring Industry Revenue (Million) Forecast, by Application 2019 & 2032
- Table 28: Italy Cloud Monitoring Industry Volume (K Unit) Forecast, by Application 2019 & 2032
- Table 29: Spain Cloud Monitoring Industry Revenue (Million) Forecast, by Application 2019 & 2032
- Table 30: Spain Cloud Monitoring Industry Volume (K Unit) Forecast, by Application 2019 & 2032
- Table 31: Belgium Cloud Monitoring Industry Revenue (Million) Forecast, by Application 2019 & 2032
- Table 32: Belgium Cloud Monitoring Industry Volume (K Unit) Forecast, by Application 2019 & 2032
- Table 33: Netherland Cloud Monitoring Industry Revenue (Million) Forecast, by Application 2019 & 2032
- Table 34: Netherland Cloud Monitoring Industry Volume (K Unit) Forecast, by Application 2019 & 2032
- Table 35: Nordics Cloud Monitoring Industry Revenue (Million) Forecast, by Application 2019 & 2032
- Table 36: Nordics Cloud Monitoring Industry Volume (K Unit) Forecast, by Application 2019 & 2032
- Table 37: Rest of Europe Cloud Monitoring Industry Revenue (Million) Forecast, by Application 2019 & 2032
- Table 38: Rest of Europe Cloud Monitoring Industry Volume (K Unit) Forecast, by Application 2019 & 2032
- Table 39: Global Cloud Monitoring Industry Revenue Million Forecast, by Country 2019 & 2032
- Table 40: Global Cloud Monitoring Industry Volume K Unit Forecast, by Country 2019 & 2032
- Table 41: China Cloud Monitoring Industry Revenue (Million) Forecast, by Application 2019 & 2032
- Table 42: China Cloud Monitoring Industry Volume (K Unit) Forecast, by Application 2019 & 2032
- Table 43: Japan Cloud Monitoring Industry Revenue (Million) Forecast, by Application 2019 & 2032
- Table 44: Japan Cloud Monitoring Industry Volume (K Unit) Forecast, by Application 2019 & 2032
- Table 45: India Cloud Monitoring Industry Revenue (Million) Forecast, by Application 2019 & 2032
- Table 46: India Cloud Monitoring Industry Volume (K Unit) Forecast, by Application 2019 & 2032
- Table 47: South Korea Cloud Monitoring Industry Revenue (Million) Forecast, by Application 2019 & 2032
- Table 48: South Korea Cloud Monitoring Industry Volume (K Unit) Forecast, by Application 2019 & 2032
- Table 49: Southeast Asia Cloud Monitoring Industry Revenue (Million) Forecast, by Application 2019 & 2032
- Table 50: Southeast Asia Cloud Monitoring Industry Volume (K Unit) Forecast, by Application 2019 & 2032
- Table 51: Australia Cloud Monitoring Industry Revenue (Million) Forecast, by Application 2019 & 2032
- Table 52: Australia Cloud Monitoring Industry Volume (K Unit) Forecast, by Application 2019 & 2032
- Table 53: Indonesia Cloud Monitoring Industry Revenue (Million) Forecast, by Application 2019 & 2032
- Table 54: Indonesia Cloud Monitoring Industry Volume (K Unit) Forecast, by Application 2019 & 2032
- Table 55: Phillipes Cloud Monitoring Industry Revenue (Million) Forecast, by Application 2019 & 2032
- Table 56: Phillipes Cloud Monitoring Industry Volume (K Unit) Forecast, by Application 2019 & 2032
- Table 57: Singapore Cloud Monitoring Industry Revenue (Million) Forecast, by Application 2019 & 2032
- Table 58: Singapore Cloud Monitoring Industry Volume (K Unit) Forecast, by Application 2019 & 2032
- Table 59: Thailandc Cloud Monitoring Industry Revenue (Million) Forecast, by Application 2019 & 2032
- Table 60: Thailandc Cloud Monitoring Industry Volume (K Unit) Forecast, by Application 2019 & 2032
- Table 61: Rest of Asia Pacific Cloud Monitoring Industry Revenue (Million) Forecast, by Application 2019 & 2032
- Table 62: Rest of Asia Pacific Cloud Monitoring Industry Volume (K Unit) Forecast, by Application 2019 & 2032
- Table 63: Global Cloud Monitoring Industry Revenue Million Forecast, by Country 2019 & 2032
- Table 64: Global Cloud Monitoring Industry Volume K Unit Forecast, by Country 2019 & 2032
- Table 65: Brazil Cloud Monitoring Industry Revenue (Million) Forecast, by Application 2019 & 2032
- Table 66: Brazil Cloud Monitoring Industry Volume (K Unit) Forecast, by Application 2019 & 2032
- Table 67: Argentina Cloud Monitoring Industry Revenue (Million) Forecast, by Application 2019 & 2032
- Table 68: Argentina Cloud Monitoring Industry Volume (K Unit) Forecast, by Application 2019 & 2032
- Table 69: Peru Cloud Monitoring Industry Revenue (Million) Forecast, by Application 2019 & 2032
- Table 70: Peru Cloud Monitoring Industry Volume (K Unit) Forecast, by Application 2019 & 2032
- Table 71: Chile Cloud Monitoring Industry Revenue (Million) Forecast, by Application 2019 & 2032
- Table 72: Chile Cloud Monitoring Industry Volume (K Unit) Forecast, by Application 2019 & 2032
- Table 73: Colombia Cloud Monitoring Industry Revenue (Million) Forecast, by Application 2019 & 2032
- Table 74: Colombia Cloud Monitoring Industry Volume (K Unit) Forecast, by Application 2019 & 2032
- Table 75: Ecuador Cloud Monitoring Industry Revenue (Million) Forecast, by Application 2019 & 2032
- Table 76: Ecuador Cloud Monitoring Industry Volume (K Unit) Forecast, by Application 2019 & 2032
- Table 77: Venezuela Cloud Monitoring Industry Revenue (Million) Forecast, by Application 2019 & 2032
- Table 78: Venezuela Cloud Monitoring Industry Volume (K Unit) Forecast, by Application 2019 & 2032
- Table 79: Rest of South America Cloud Monitoring Industry Revenue (Million) Forecast, by Application 2019 & 2032
- Table 80: Rest of South America Cloud Monitoring Industry Volume (K Unit) Forecast, by Application 2019 & 2032
- Table 81: Global Cloud Monitoring Industry Revenue Million Forecast, by Country 2019 & 2032
- Table 82: Global Cloud Monitoring Industry Volume K Unit Forecast, by Country 2019 & 2032
- Table 83: United States Cloud Monitoring Industry Revenue (Million) Forecast, by Application 2019 & 2032
- Table 84: United States Cloud Monitoring Industry Volume (K Unit) Forecast, by Application 2019 & 2032
- Table 85: Canada Cloud Monitoring Industry Revenue (Million) Forecast, by Application 2019 & 2032
- Table 86: Canada Cloud Monitoring Industry Volume (K Unit) Forecast, by Application 2019 & 2032
- Table 87: Mexico Cloud Monitoring Industry Revenue (Million) Forecast, by Application 2019 & 2032
- Table 88: Mexico Cloud Monitoring Industry Volume (K Unit) Forecast, by Application 2019 & 2032
- Table 89: Global Cloud Monitoring Industry Revenue Million Forecast, by Country 2019 & 2032
- Table 90: Global Cloud Monitoring Industry Volume K Unit Forecast, by Country 2019 & 2032
- Table 91: United Arab Emirates Cloud Monitoring Industry Revenue (Million) Forecast, by Application 2019 & 2032
- Table 92: United Arab Emirates Cloud Monitoring Industry Volume (K Unit) Forecast, by Application 2019 & 2032
- Table 93: Saudi Arabia Cloud Monitoring Industry Revenue (Million) Forecast, by Application 2019 & 2032
- Table 94: Saudi Arabia Cloud Monitoring Industry Volume (K Unit) Forecast, by Application 2019 & 2032
- Table 95: South Africa Cloud Monitoring Industry Revenue (Million) Forecast, by Application 2019 & 2032
- Table 96: South Africa Cloud Monitoring Industry Volume (K Unit) Forecast, by Application 2019 & 2032
- Table 97: Rest of Middle East and Africa Cloud Monitoring Industry Revenue (Million) Forecast, by Application 2019 & 2032
- Table 98: Rest of Middle East and Africa Cloud Monitoring Industry Volume (K Unit) Forecast, by Application 2019 & 2032
- Table 99: Global Cloud Monitoring Industry Revenue Million Forecast, by Model 2019 & 2032
- Table 100: Global Cloud Monitoring Industry Volume K Unit Forecast, by Model 2019 & 2032
- Table 101: Global Cloud Monitoring Industry Revenue Million Forecast, by End-User Industry 2019 & 2032
- Table 102: Global Cloud Monitoring Industry Volume K Unit Forecast, by End-User Industry 2019 & 2032
- Table 103: Global Cloud Monitoring Industry Revenue Million Forecast, by Country 2019 & 2032
- Table 104: Global Cloud Monitoring Industry Volume K Unit Forecast, by Country 2019 & 2032
- Table 105: United States Cloud Monitoring Industry Revenue (Million) Forecast, by Application 2019 & 2032
- Table 106: United States Cloud Monitoring Industry Volume (K Unit) Forecast, by Application 2019 & 2032
- Table 107: Canada Cloud Monitoring Industry Revenue (Million) Forecast, by Application 2019 & 2032
- Table 108: Canada Cloud Monitoring Industry Volume (K Unit) Forecast, by Application 2019 & 2032
- Table 109: Global Cloud Monitoring Industry Revenue Million Forecast, by Model 2019 & 2032
- Table 110: Global Cloud Monitoring Industry Volume K Unit Forecast, by Model 2019 & 2032
- Table 111: Global Cloud Monitoring Industry Revenue Million Forecast, by End-User Industry 2019 & 2032
- Table 112: Global Cloud Monitoring Industry Volume K Unit Forecast, by End-User Industry 2019 & 2032
- Table 113: Global Cloud Monitoring Industry Revenue Million Forecast, by Country 2019 & 2032
- Table 114: Global Cloud Monitoring Industry Volume K Unit Forecast, by Country 2019 & 2032
- Table 115: United Kingdom Cloud Monitoring Industry Revenue (Million) Forecast, by Application 2019 & 2032
- Table 116: United Kingdom Cloud Monitoring Industry Volume (K Unit) Forecast, by Application 2019 & 2032
- Table 117: Germany Cloud Monitoring Industry Revenue (Million) Forecast, by Application 2019 & 2032
- Table 118: Germany Cloud Monitoring Industry Volume (K Unit) Forecast, by Application 2019 & 2032
- Table 119: France Cloud Monitoring Industry Revenue (Million) Forecast, by Application 2019 & 2032
- Table 120: France Cloud Monitoring Industry Volume (K Unit) Forecast, by Application 2019 & 2032
- Table 121: Spain Cloud Monitoring Industry Revenue (Million) Forecast, by Application 2019 & 2032
- Table 122: Spain Cloud Monitoring Industry Volume (K Unit) Forecast, by Application 2019 & 2032
- Table 123: Global Cloud Monitoring Industry Revenue Million Forecast, by Model 2019 & 2032
- Table 124: Global Cloud Monitoring Industry Volume K Unit Forecast, by Model 2019 & 2032
- Table 125: Global Cloud Monitoring Industry Revenue Million Forecast, by End-User Industry 2019 & 2032
- Table 126: Global Cloud Monitoring Industry Volume K Unit Forecast, by End-User Industry 2019 & 2032
- Table 127: Global Cloud Monitoring Industry Revenue Million Forecast, by Country 2019 & 2032
- Table 128: Global Cloud Monitoring Industry Volume K Unit Forecast, by Country 2019 & 2032
- Table 129: China Cloud Monitoring Industry Revenue (Million) Forecast, by Application 2019 & 2032
- Table 130: China Cloud Monitoring Industry Volume (K Unit) Forecast, by Application 2019 & 2032
- Table 131: Japan Cloud Monitoring Industry Revenue (Million) Forecast, by Application 2019 & 2032
- Table 132: Japan Cloud Monitoring Industry Volume (K Unit) Forecast, by Application 2019 & 2032
- Table 133: Singapore Cloud Monitoring Industry Revenue (Million) Forecast, by Application 2019 & 2032
- Table 134: Singapore Cloud Monitoring Industry Volume (K Unit) Forecast, by Application 2019 & 2032
- Table 135: Australia and New Zealand Cloud Monitoring Industry Revenue (Million) Forecast, by Application 2019 & 2032
- Table 136: Australia and New Zealand Cloud Monitoring Industry Volume (K Unit) Forecast, by Application 2019 & 2032
- Table 137: Global Cloud Monitoring Industry Revenue Million Forecast, by Model 2019 & 2032
- Table 138: Global Cloud Monitoring Industry Volume K Unit Forecast, by Model 2019 & 2032
- Table 139: Global Cloud Monitoring Industry Revenue Million Forecast, by End-User Industry 2019 & 2032
- Table 140: Global Cloud Monitoring Industry Volume K Unit Forecast, by End-User Industry 2019 & 2032
- Table 141: Global Cloud Monitoring Industry Revenue Million Forecast, by Country 2019 & 2032
- Table 142: Global Cloud Monitoring Industry Volume K Unit Forecast, by Country 2019 & 2032
- Table 143: Mexico Cloud Monitoring Industry Revenue (Million) Forecast, by Application 2019 & 2032
- Table 144: Mexico Cloud Monitoring Industry Volume (K Unit) Forecast, by Application 2019 & 2032
- Table 145: Brazil Cloud Monitoring Industry Revenue (Million) Forecast, by Application 2019 & 2032
- Table 146: Brazil Cloud Monitoring Industry Volume (K Unit) Forecast, by Application 2019 & 2032
- Table 147: Global Cloud Monitoring Industry Revenue Million Forecast, by Model 2019 & 2032
- Table 148: Global Cloud Monitoring Industry Volume K Unit Forecast, by Model 2019 & 2032
- Table 149: Global Cloud Monitoring Industry Revenue Million Forecast, by End-User Industry 2019 & 2032
- Table 150: Global Cloud Monitoring Industry Volume K Unit Forecast, by End-User Industry 2019 & 2032
- Table 151: Global Cloud Monitoring Industry Revenue Million Forecast, by Country 2019 & 2032
- Table 152: Global Cloud Monitoring Industry Volume K Unit Forecast, by Country 2019 & 2032
- Table 153: United Arab Emirates Cloud Monitoring Industry Revenue (Million) Forecast, by Application 2019 & 2032
- Table 154: United Arab Emirates Cloud Monitoring Industry Volume (K Unit) Forecast, by Application 2019 & 2032
- Table 155: Saudi Arabia Cloud Monitoring Industry Revenue (Million) Forecast, by Application 2019 & 2032
- Table 156: Saudi Arabia Cloud Monitoring Industry Volume (K Unit) Forecast, by Application 2019 & 2032
Frequently Asked Questions
1. What is the projected Compound Annual Growth Rate (CAGR) of the Cloud Monitoring Industry?
The projected CAGR is approximately 19.91%.
2. Which companies are prominent players in the Cloud Monitoring Industry?
Key companies in the market include IDERA Inc, IBM Corporation, Zenoss Inc , Broadcom Inc (CA Technologies), Datadog Inc, Microsoft Corporation, Oracle Corporation, AWS, LogicMonitor Inc.
3. What are the main segments of the Cloud Monitoring Industry?
The market segments include Model, End-User Industry.
4. Can you provide details about the market size?
The market size is estimated to be USD 3.13 Million as of 2022.
5. What are some drivers contributing to market growth?
Growth in Cloud Adoption Across End Users; Rising Need for Efficiently Managing the Performance and Security of Cloud Platforms.
6. What are the notable trends driving market growth?
Growth in Cloud Adoption Across End Users is Expected to Drive the Market Growth.
7. Are there any restraints impacting market growth?
Diminishing Profit Margins and Ongoing Changes in Macro-environment.
8. Can you provide examples of recent developments in the market?
April 2023: Sumo Logic, a software-as-a-service (SaaS) analytics platform enabling dependable and secure cloud-native applications, announced that it had earned the Amazon Web Services (AWS) cloud operations competency in monitoring and observability. Sumo Logic has proven competence in assisting customers in establishing a robust and scalable foundation for end-to-end cloud operations as an AWS cloud operations competency partner.
9. What pricing options are available for accessing the report?
Pricing options include single-user, multi-user, and enterprise licenses priced at USD 4750, USD 5250, and USD 8750 respectively.
10. Is the market size provided in terms of value or volume?
The market size is provided in terms of value, measured in Million and volume, measured in K Unit.
11. Are there any specific market keywords associated with the report?
Yes, the market keyword associated with the report is "Cloud Monitoring Industry," which aids in identifying and referencing the specific market segment covered.
12. How do I determine which pricing option suits my needs best?
The pricing options vary based on user requirements and access needs. Individual users may opt for single-user licenses, while businesses requiring broader access may choose multi-user or enterprise licenses for cost-effective access to the report.
13. Are there any additional resources or data provided in the Cloud Monitoring Industry report?
While the report offers comprehensive insights, it's advisable to review the specific contents or supplementary materials provided to ascertain if additional resources or data are available.
14. How can I stay updated on further developments or reports in the Cloud Monitoring Industry?
To stay informed about further developments, trends, and reports in the Cloud Monitoring Industry, consider subscribing to industry newsletters, following relevant companies and organizations, or regularly checking reputable industry news sources and publications.
Methodology
Step 1 - Identification of Relevant Samples Size from Population Database


Step 2 - Approaches for Defining Global Market Size (Value, Volume* & Price*)

Note*: In applicable scenarios
Step 3 - Data Sources
Primary Research
- Web Analytics
- Survey Reports
- Research Institute
- Latest Research Reports
- Opinion Leaders
Secondary Research
- Annual Reports
- White Paper
- Latest Press Release
- Industry Association
- Paid Database
- Investor Presentations

Step 4 - Data Triangulation
Involves using different sources of information in order to increase the validity of a study
These sources are likely to be stakeholders in a program - participants, other researchers, program staff, other community members, and so on.
Then we put all data in single framework & apply various statistical tools to find out the dynamic on the market.
During the analysis stage, feedback from the stakeholder groups would be compared to determine areas of agreement as well as areas of divergence
