

Key Insights
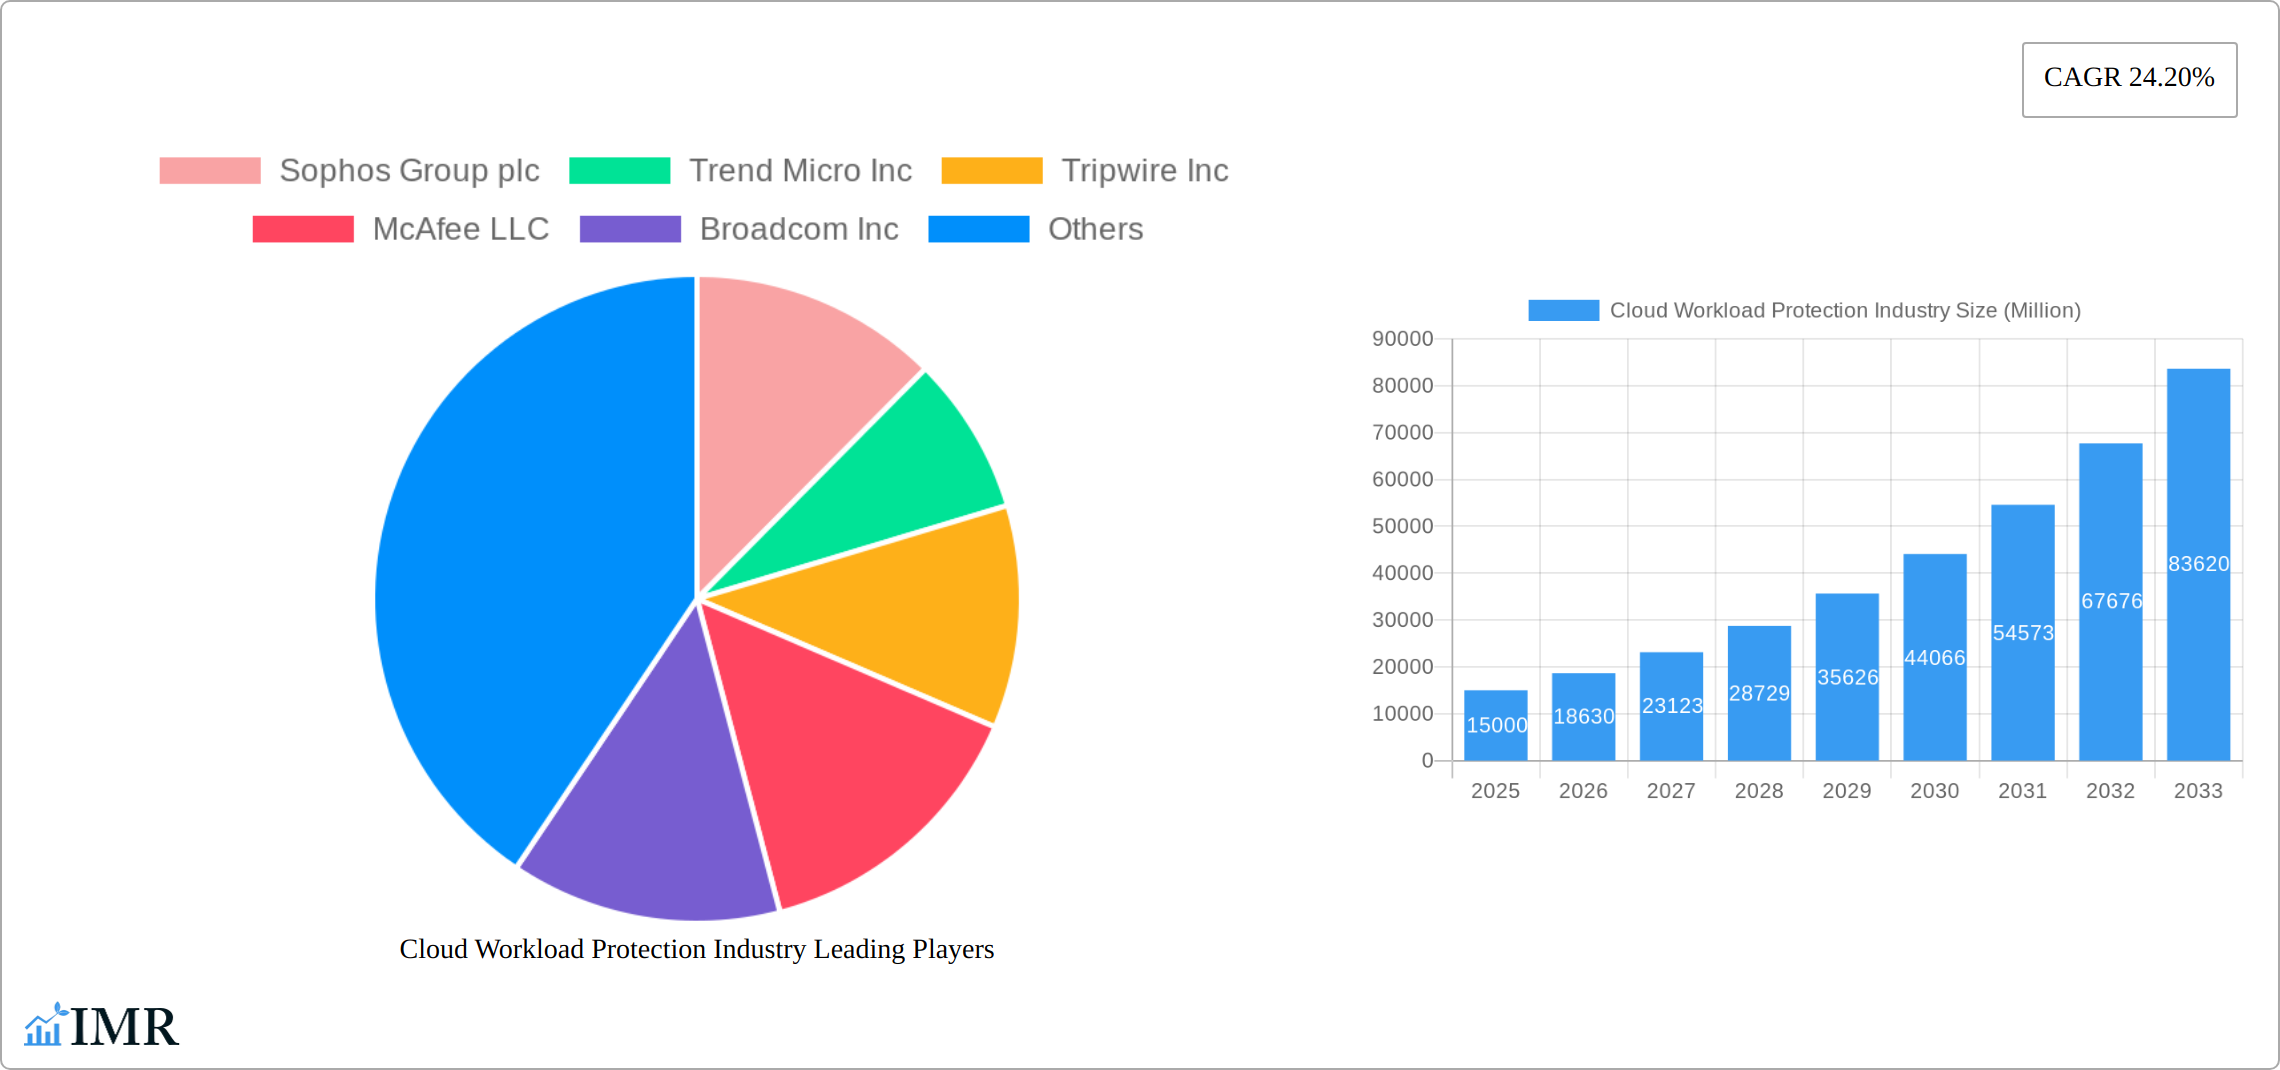
The Cloud Workload Protection (CWP) market is experiencing robust growth, driven by the increasing adoption of cloud computing and the rising need for robust security solutions to safeguard sensitive data and applications residing in cloud environments. The market's 24.20% CAGR indicates significant expansion, projected to reach a substantial value over the forecast period (2025-2033). Key drivers include the escalating frequency and sophistication of cyber threats targeting cloud workloads, coupled with stringent regulatory compliance mandates demanding enhanced data security. The shift towards hybrid and multi-cloud environments further fuels market expansion, as organizations seek unified security solutions across diverse deployment models. While the lack of skilled cybersecurity professionals presents a challenge, the increasing automation and integration capabilities of CWP solutions are mitigating this constraint. Market segmentation reveals strong demand across various end-user verticals, with BFSI, Healthcare and Life Sciences, and IT and Telecommunications sectors leading the charge, demonstrating the critical role CWP plays in safeguarding mission-critical data and applications. The solutions component of the market likely dominates due to the inherent complexity of securing cloud environments and the need for sophisticated security tools.
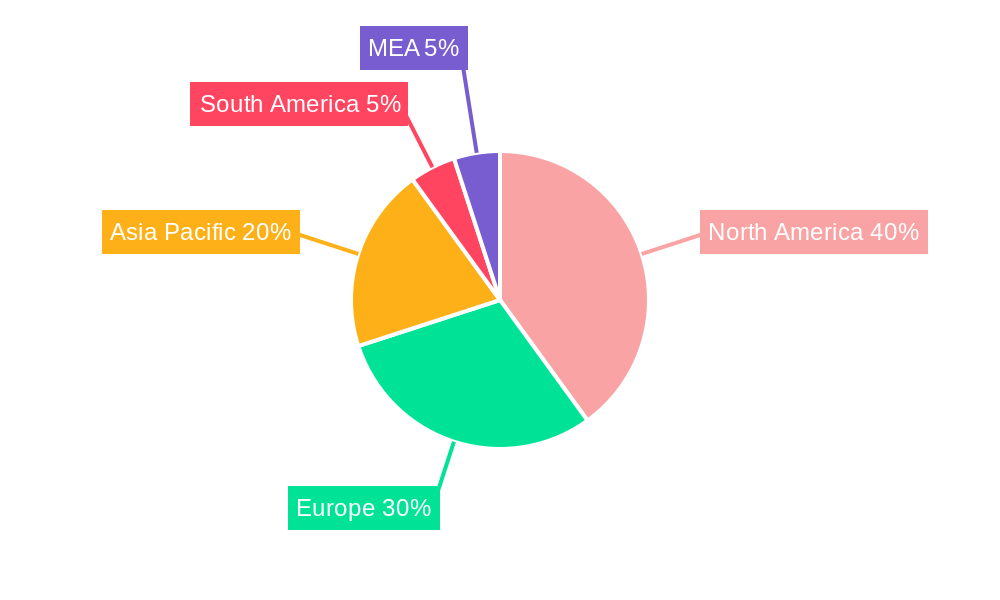
The market's geographical distribution showcases strong performance across North America and Europe, reflecting the high adoption rates of cloud services and robust cybersecurity infrastructure in these regions. However, rapid growth is expected in the Asia-Pacific region driven by increasing cloud infrastructure deployments and digital transformation initiatives. Companies such as Sophos, Trend Micro, and McAfee are key players shaping the market landscape through innovative solutions and strategic partnerships. The competitive landscape is characterized by both established players and emerging startups, leading to continuous innovation and improvement in CWP technologies. Looking ahead, the market is poised for continued growth fueled by the expansion of cloud adoption, heightened cybersecurity threats, and ongoing technological advancements in areas such as AI-powered threat detection and automation. The focus will increasingly be on solutions that offer seamless integration, enhanced visibility, and proactive threat mitigation capabilities.
Cloud Workload Protection Industry Market Report: 2019-2033
This comprehensive report provides a detailed analysis of the Cloud Workload Protection industry, offering valuable insights for businesses, investors, and industry professionals. Covering the period 2019-2033, with a focus on 2025, this report leverages extensive research to deliver a clear understanding of market dynamics, growth trends, and future opportunities. The market size is projected to reach xx Million by 2033.
Note: Values represented as "xx" indicate data unavailable at this time and are subject to change in the full report.
Cloud Workload Protection Industry Market Dynamics & Structure
The Cloud Workload Protection market is experiencing significant growth, driven by the increasing adoption of cloud computing and the rising need for robust security solutions. Market concentration is moderate, with several key players competing for market share. Technological innovation, particularly in areas like AI-powered threat detection and automated response, is a major driver. Regulatory frameworks, such as GDPR and CCPA, are influencing the development and adoption of cloud security solutions. Competitive product substitutes include traditional on-premise security solutions, but cloud-native solutions offer superior scalability and flexibility. End-user demographics are shifting towards a greater reliance on cloud services across various sectors. M&A activity is frequent, with larger players acquiring smaller companies to expand their product portfolios and market reach. The total value of M&A deals between 2019 and 2024 is estimated at xx Million.
- Market Concentration: Moderately consolidated, with top 5 players holding approximately xx% market share in 2025.
- Technological Innovation: AI, machine learning, and automation are key drivers of innovation.
- Regulatory Frameworks: GDPR, CCPA, and other regulations are shaping security requirements.
- Competitive Substitutes: On-premise solutions face increasing competition from cloud-native alternatives.
- M&A Activity: High level of mergers and acquisitions to consolidate the market and expand capabilities.
Cloud Workload Protection Industry Growth Trends & Insights
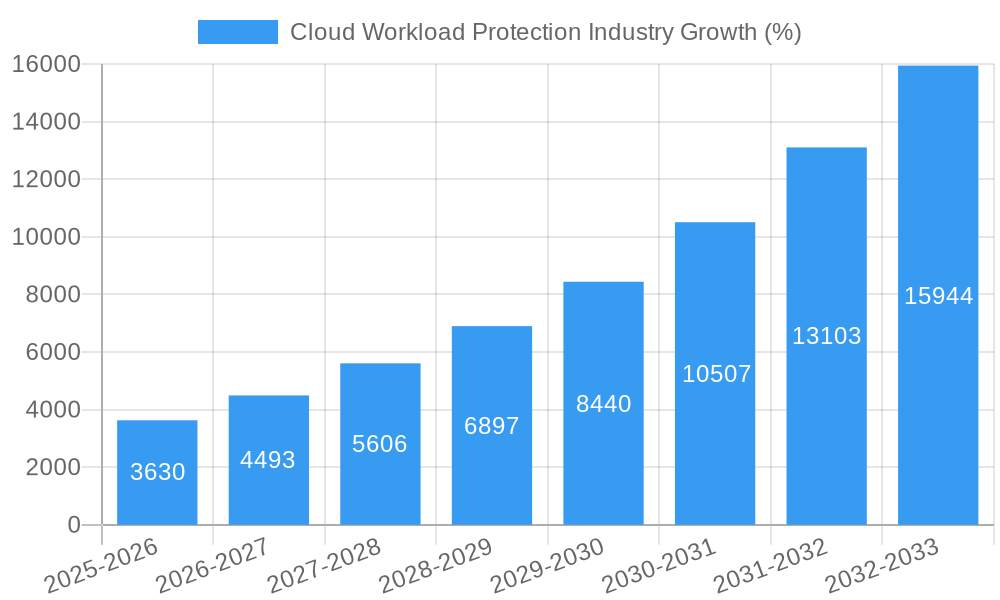
The Cloud Workload Protection market has experienced substantial growth over the historical period (2019-2024), with a Compound Annual Growth Rate (CAGR) of xx%. This growth is expected to continue during the forecast period (2025-2033), driven by factors including the increasing adoption of cloud services across diverse industries, rising cybersecurity threats, and the need for comprehensive workload protection solutions. Market penetration is currently estimated at xx% in 2025, and is projected to reach xx% by 2033. This reflects a growing awareness of the vulnerabilities associated with cloud workloads and the need for robust security measures. Technological disruptions, such as the emergence of serverless computing and edge computing, are also shaping the market landscape, creating new opportunities and challenges for vendors. Consumer behavior is increasingly driven by a preference for cloud-based solutions that offer flexibility, scalability, and cost-effectiveness. This preference is expected to fuel market expansion throughout the forecast period.
Dominant Regions, Countries, or Segments in Cloud Workload Protection Industry
North America is currently the dominant region in the Cloud Workload Protection market, followed by Europe. Within North America, the United States holds the largest market share, owing to high cloud adoption rates and robust IT infrastructure. However, Asia-Pacific is expected to witness the highest growth rate during the forecast period, driven by rapid digital transformation and increasing investments in cloud infrastructure across developing economies.
By Segment:
- By Deployment: Public cloud deployments dominate the market due to ease of access and scalability. However, hybrid cloud deployments are rapidly gaining traction.
- By End-User: The BFSI, Healthcare and Life Sciences, and IT and Telecommunications sectors are major drivers, due to stringent regulatory compliance and sensitive data.
- By Component: Solutions (qualitative data only, see full report for details)
- Others (Encryption, Tokenisation, and Key Management): Services: (qualitative data only, see full report for details)
Key Drivers:
- Strong government support for digital transformation initiatives
- Robust IT infrastructure and high internet penetration
- Increasing adoption of cloud-native applications
- Growing awareness of cybersecurity threats
Cloud Workload Protection Industry Product Landscape
The Cloud Workload Protection market offers a wide array of solutions, including cloud security posture management (CSPM), cloud workload protection platforms (CWPP), and various security information and event management (SIEM) tools. These solutions are constantly evolving, with new features and capabilities being added to address emerging threats. Key innovations include advanced threat detection using AI and machine learning, automated response mechanisms, and integrated vulnerability management. Unique selling propositions often involve ease of use, comprehensive protection, and seamless integration with existing cloud environments.
Key Drivers, Barriers & Challenges in Cloud Workload Protection Industry
Key Drivers:
- Increased cloud adoption: The migration of workloads to the cloud fuels demand for security solutions.
- Growing cyber threats: The rise in sophisticated attacks necessitates robust protection.
- Government regulations: Compliance requirements drive adoption of security solutions.
Challenges & Restraints:
- Complexity of cloud environments: Managing security across diverse cloud platforms is challenging.
- Integration issues: Seamless integration with existing systems is crucial for adoption.
- High initial costs: Implementing comprehensive security solutions can be expensive. The estimated impact of these factors on market growth is xx%.
Emerging Opportunities in Cloud Workload Protection Industry
Significant opportunities exist in several areas, including expanding into emerging markets, developing solutions for serverless and edge computing environments, and integrating AI and machine learning for more effective threat detection and response. The convergence of security and DevOps practices (DevSecOps) is also creating new opportunities for specialized solutions.
Growth Accelerators in the Cloud Workload Protection Industry
Strategic partnerships between cloud providers and security vendors, the development of cloud-native security solutions, and investments in research and development to stay ahead of evolving threats are key growth accelerators. Increased awareness of cloud security risks and regulatory pressure are further boosting market growth.
Key Players Shaping the Cloud Workload Protection Industry Market
- Sophos Group plc
- Trend Micro Inc
- Tripwire Inc
- McAfee LLC
- Broadcom Inc
- HyTrust
- Guardicore
- Dome9 Security Inc
- LogRhythm Inc
- CloudPassage
Notable Milestones in Cloud Workload Protection Industry Sector
- 2020: Increased adoption of cloud security posture management (CSPM) solutions.
- 2021: Significant investments in AI-powered threat detection technologies.
- 2022: Several mergers and acquisitions to expand market share and capabilities.
- 2023: Growing adoption of cloud workload protection platforms (CWPP).
- 2024: Focus on DevSecOps and automation in cloud security.
In-Depth Cloud Workload Protection Industry Market Outlook
The Cloud Workload Protection market is poised for continued growth, driven by the factors mentioned above. Strategic opportunities lie in focusing on emerging technologies, expanding into new markets, and forging strong partnerships. The long-term outlook is positive, with significant potential for growth and innovation in this crucial sector. The market is expected to maintain a healthy CAGR during the forecast period, offering substantial opportunities for businesses and investors alike.
Cloud Workload Protection Industry Segmentation
-
1. Component
-
1.1. Solution
- 1.1.1. Monitoring and Logging
- 1.1.2. Policy and Compliance Management
- 1.1.3. Vulnerability Assessment
- 1.1.4. Threat Detection and Incident Response
- 1.1.5. Others
-
1.2. Services
- 1.2.1. Managed Services
- 1.2.2. Professional Services
-
1.1. Solution
-
2. Deployment
- 2.1. Public
- 2.2. Private
- 2.3. Hybrid
-
3. End-User
- 3.1. BFSI
- 3.2. Healthcare and Life Sciences
- 3.3. IT and Telecommunications
- 3.4. Retail and Consumer Goods
- 3.5. Media and Entertainment
- 3.6. Energy and Utilities
- 3.7. Other End Users
Cloud Workload Protection Industry Segmentation By Geography
- 1. North America
- 2. Europe
- 3. Asia Pacific
- 4. Rest of the Word
Cloud Workload Protection Industry REPORT HIGHLIGHTS
| Aspects | Details |
|---|---|
| Study Period | 2019-2033 |
| Base Year | 2024 |
| Estimated Year | 2025 |
| Forecast Period | 2025-2033 |
| Historical Period | 2019-2024 |
| Growth Rate | CAGR of 24.20% from 2019-2033 |
| Segmentation |
|
Table of Contents
- 1. Introduction
- 1.1. Research Scope
- 1.2. Market Segmentation
- 1.3. Research Methodology
- 1.4. Definitions and Assumptions
- 2. Executive Summary
- 2.1. Introduction
- 3. Market Dynamics
- 3.1. Introduction
- 3.2. Market Drivers
- 3.2.1. ; Increasing Adoption of the Multi-Cloud Strategy Among Enterprises; Seamless Scalability and Reduced Operational Costs
- 3.3. Market Restrains
- 3.3.1. ; Adherence to Multiple Regulatory Compliances
- 3.4. Market Trends
- 3.4.1. Hybrid Cloud Deployment to Drive the Market Growth
- 4. Market Factor Analysis
- 4.1. Porters Five Forces
- 4.2. Supply/Value Chain
- 4.3. PESTEL analysis
- 4.4. Market Entropy
- 4.5. Patent/Trademark Analysis
- 5. Global Cloud Workload Protection Industry Analysis, Insights and Forecast, 2019-2031
- 5.1. Market Analysis, Insights and Forecast - by Component
- 5.1.1. Solution
- 5.1.1.1. Monitoring and Logging
- 5.1.1.2. Policy and Compliance Management
- 5.1.1.3. Vulnerability Assessment
- 5.1.1.4. Threat Detection and Incident Response
- 5.1.1.5. Others
- 5.1.2. Services
- 5.1.2.1. Managed Services
- 5.1.2.2. Professional Services
- 5.1.1. Solution
- 5.2. Market Analysis, Insights and Forecast - by Deployment
- 5.2.1. Public
- 5.2.2. Private
- 5.2.3. Hybrid
- 5.3. Market Analysis, Insights and Forecast - by End-User
- 5.3.1. BFSI
- 5.3.2. Healthcare and Life Sciences
- 5.3.3. IT and Telecommunications
- 5.3.4. Retail and Consumer Goods
- 5.3.5. Media and Entertainment
- 5.3.6. Energy and Utilities
- 5.3.7. Other End Users
- 5.4. Market Analysis, Insights and Forecast - by Region
- 5.4.1. North America
- 5.4.2. Europe
- 5.4.3. Asia Pacific
- 5.4.4. Rest of the Word
- 5.1. Market Analysis, Insights and Forecast - by Component
- 6. North America Cloud Workload Protection Industry Analysis, Insights and Forecast, 2019-2031
- 6.1. Market Analysis, Insights and Forecast - by Component
- 6.1.1. Solution
- 6.1.1.1. Monitoring and Logging
- 6.1.1.2. Policy and Compliance Management
- 6.1.1.3. Vulnerability Assessment
- 6.1.1.4. Threat Detection and Incident Response
- 6.1.1.5. Others
- 6.1.2. Services
- 6.1.2.1. Managed Services
- 6.1.2.2. Professional Services
- 6.1.1. Solution
- 6.2. Market Analysis, Insights and Forecast - by Deployment
- 6.2.1. Public
- 6.2.2. Private
- 6.2.3. Hybrid
- 6.3. Market Analysis, Insights and Forecast - by End-User
- 6.3.1. BFSI
- 6.3.2. Healthcare and Life Sciences
- 6.3.3. IT and Telecommunications
- 6.3.4. Retail and Consumer Goods
- 6.3.5. Media and Entertainment
- 6.3.6. Energy and Utilities
- 6.3.7. Other End Users
- 6.1. Market Analysis, Insights and Forecast - by Component
- 7. Europe Cloud Workload Protection Industry Analysis, Insights and Forecast, 2019-2031
- 7.1. Market Analysis, Insights and Forecast - by Component
- 7.1.1. Solution
- 7.1.1.1. Monitoring and Logging
- 7.1.1.2. Policy and Compliance Management
- 7.1.1.3. Vulnerability Assessment
- 7.1.1.4. Threat Detection and Incident Response
- 7.1.1.5. Others
- 7.1.2. Services
- 7.1.2.1. Managed Services
- 7.1.2.2. Professional Services
- 7.1.1. Solution
- 7.2. Market Analysis, Insights and Forecast - by Deployment
- 7.2.1. Public
- 7.2.2. Private
- 7.2.3. Hybrid
- 7.3. Market Analysis, Insights and Forecast - by End-User
- 7.3.1. BFSI
- 7.3.2. Healthcare and Life Sciences
- 7.3.3. IT and Telecommunications
- 7.3.4. Retail and Consumer Goods
- 7.3.5. Media and Entertainment
- 7.3.6. Energy and Utilities
- 7.3.7. Other End Users
- 7.1. Market Analysis, Insights and Forecast - by Component
- 8. Asia Pacific Cloud Workload Protection Industry Analysis, Insights and Forecast, 2019-2031
- 8.1. Market Analysis, Insights and Forecast - by Component
- 8.1.1. Solution
- 8.1.1.1. Monitoring and Logging
- 8.1.1.2. Policy and Compliance Management
- 8.1.1.3. Vulnerability Assessment
- 8.1.1.4. Threat Detection and Incident Response
- 8.1.1.5. Others
- 8.1.2. Services
- 8.1.2.1. Managed Services
- 8.1.2.2. Professional Services
- 8.1.1. Solution
- 8.2. Market Analysis, Insights and Forecast - by Deployment
- 8.2.1. Public
- 8.2.2. Private
- 8.2.3. Hybrid
- 8.3. Market Analysis, Insights and Forecast - by End-User
- 8.3.1. BFSI
- 8.3.2. Healthcare and Life Sciences
- 8.3.3. IT and Telecommunications
- 8.3.4. Retail and Consumer Goods
- 8.3.5. Media and Entertainment
- 8.3.6. Energy and Utilities
- 8.3.7. Other End Users
- 8.1. Market Analysis, Insights and Forecast - by Component
- 9. Rest of the Word Cloud Workload Protection Industry Analysis, Insights and Forecast, 2019-2031
- 9.1. Market Analysis, Insights and Forecast - by Component
- 9.1.1. Solution
- 9.1.1.1. Monitoring and Logging
- 9.1.1.2. Policy and Compliance Management
- 9.1.1.3. Vulnerability Assessment
- 9.1.1.4. Threat Detection and Incident Response
- 9.1.1.5. Others
- 9.1.2. Services
- 9.1.2.1. Managed Services
- 9.1.2.2. Professional Services
- 9.1.1. Solution
- 9.2. Market Analysis, Insights and Forecast - by Deployment
- 9.2.1. Public
- 9.2.2. Private
- 9.2.3. Hybrid
- 9.3. Market Analysis, Insights and Forecast - by End-User
- 9.3.1. BFSI
- 9.3.2. Healthcare and Life Sciences
- 9.3.3. IT and Telecommunications
- 9.3.4. Retail and Consumer Goods
- 9.3.5. Media and Entertainment
- 9.3.6. Energy and Utilities
- 9.3.7. Other End Users
- 9.1. Market Analysis, Insights and Forecast - by Component
- 10. North America Cloud Workload Protection Industry Analysis, Insights and Forecast, 2019-2031
- 10.1. Market Analysis, Insights and Forecast - By Country/Sub-region
- 10.1.1 United States
- 10.1.2 Canada
- 10.1.3 Mexico
- 11. Europe Cloud Workload Protection Industry Analysis, Insights and Forecast, 2019-2031
- 11.1. Market Analysis, Insights and Forecast - By Country/Sub-region
- 11.1.1 Germany
- 11.1.2 United Kingdom
- 11.1.3 France
- 11.1.4 Spain
- 11.1.5 Italy
- 11.1.6 Spain
- 11.1.7 Belgium
- 11.1.8 Netherland
- 11.1.9 Nordics
- 11.1.10 Rest of Europe
- 12. Asia Pacific Cloud Workload Protection Industry Analysis, Insights and Forecast, 2019-2031
- 12.1. Market Analysis, Insights and Forecast - By Country/Sub-region
- 12.1.1 China
- 12.1.2 Japan
- 12.1.3 India
- 12.1.4 South Korea
- 12.1.5 Southeast Asia
- 12.1.6 Australia
- 12.1.7 Indonesia
- 12.1.8 Phillipes
- 12.1.9 Singapore
- 12.1.10 Thailandc
- 12.1.11 Rest of Asia Pacific
- 13. South America Cloud Workload Protection Industry Analysis, Insights and Forecast, 2019-2031
- 13.1. Market Analysis, Insights and Forecast - By Country/Sub-region
- 13.1.1 Brazil
- 13.1.2 Argentina
- 13.1.3 Peru
- 13.1.4 Chile
- 13.1.5 Colombia
- 13.1.6 Ecuador
- 13.1.7 Venezuela
- 13.1.8 Rest of South America
- 14. North America Cloud Workload Protection Industry Analysis, Insights and Forecast, 2019-2031
- 14.1. Market Analysis, Insights and Forecast - By Country/Sub-region
- 14.1.1 United States
- 14.1.2 Canada
- 14.1.3 Mexico
- 15. MEA Cloud Workload Protection Industry Analysis, Insights and Forecast, 2019-2031
- 15.1. Market Analysis, Insights and Forecast - By Country/Sub-region
- 15.1.1 United Arab Emirates
- 15.1.2 Saudi Arabia
- 15.1.3 South Africa
- 15.1.4 Rest of Middle East and Africa
- 16. Competitive Analysis
- 16.1. Global Market Share Analysis 2024
- 16.2. Company Profiles
- 16.2.1 Sophos Group plc
- 16.2.1.1. Overview
- 16.2.1.2. Products
- 16.2.1.3. SWOT Analysis
- 16.2.1.4. Recent Developments
- 16.2.1.5. Financials (Based on Availability)
- 16.2.2 Trend Micro Inc
- 16.2.2.1. Overview
- 16.2.2.2. Products
- 16.2.2.3. SWOT Analysis
- 16.2.2.4. Recent Developments
- 16.2.2.5. Financials (Based on Availability)
- 16.2.3 Tripwire Inc
- 16.2.3.1. Overview
- 16.2.3.2. Products
- 16.2.3.3. SWOT Analysis
- 16.2.3.4. Recent Developments
- 16.2.3.5. Financials (Based on Availability)
- 16.2.4 McAfee LLC
- 16.2.4.1. Overview
- 16.2.4.2. Products
- 16.2.4.3. SWOT Analysis
- 16.2.4.4. Recent Developments
- 16.2.4.5. Financials (Based on Availability)
- 16.2.5 Broadcom Inc
- 16.2.5.1. Overview
- 16.2.5.2. Products
- 16.2.5.3. SWOT Analysis
- 16.2.5.4. Recent Developments
- 16.2.5.5. Financials (Based on Availability)
- 16.2.6 HyTrust
- 16.2.6.1. Overview
- 16.2.6.2. Products
- 16.2.6.3. SWOT Analysis
- 16.2.6.4. Recent Developments
- 16.2.6.5. Financials (Based on Availability)
- 16.2.7 Guardicore
- 16.2.7.1. Overview
- 16.2.7.2. Products
- 16.2.7.3. SWOT Analysis
- 16.2.7.4. Recent Developments
- 16.2.7.5. Financials (Based on Availability)
- 16.2.8 Dome9 Security Inc
- 16.2.8.1. Overview
- 16.2.8.2. Products
- 16.2.8.3. SWOT Analysis
- 16.2.8.4. Recent Developments
- 16.2.8.5. Financials (Based on Availability)
- 16.2.9 LogRhythm Inc
- 16.2.9.1. Overview
- 16.2.9.2. Products
- 16.2.9.3. SWOT Analysis
- 16.2.9.4. Recent Developments
- 16.2.9.5. Financials (Based on Availability)
- 16.2.10 CloudPassage
- 16.2.10.1. Overview
- 16.2.10.2. Products
- 16.2.10.3. SWOT Analysis
- 16.2.10.4. Recent Developments
- 16.2.10.5. Financials (Based on Availability)
- 16.2.1 Sophos Group plc
List of Figures
- Figure 1: Global Cloud Workload Protection Industry Revenue Breakdown (Million, %) by Region 2024 & 2032
- Figure 2: North America Cloud Workload Protection Industry Revenue (Million), by Country 2024 & 2032
- Figure 3: North America Cloud Workload Protection Industry Revenue Share (%), by Country 2024 & 2032
- Figure 4: Europe Cloud Workload Protection Industry Revenue (Million), by Country 2024 & 2032
- Figure 5: Europe Cloud Workload Protection Industry Revenue Share (%), by Country 2024 & 2032
- Figure 6: Asia Pacific Cloud Workload Protection Industry Revenue (Million), by Country 2024 & 2032
- Figure 7: Asia Pacific Cloud Workload Protection Industry Revenue Share (%), by Country 2024 & 2032
- Figure 8: South America Cloud Workload Protection Industry Revenue (Million), by Country 2024 & 2032
- Figure 9: South America Cloud Workload Protection Industry Revenue Share (%), by Country 2024 & 2032
- Figure 10: North America Cloud Workload Protection Industry Revenue (Million), by Country 2024 & 2032
- Figure 11: North America Cloud Workload Protection Industry Revenue Share (%), by Country 2024 & 2032
- Figure 12: MEA Cloud Workload Protection Industry Revenue (Million), by Country 2024 & 2032
- Figure 13: MEA Cloud Workload Protection Industry Revenue Share (%), by Country 2024 & 2032
- Figure 14: North America Cloud Workload Protection Industry Revenue (Million), by Component 2024 & 2032
- Figure 15: North America Cloud Workload Protection Industry Revenue Share (%), by Component 2024 & 2032
- Figure 16: North America Cloud Workload Protection Industry Revenue (Million), by Deployment 2024 & 2032
- Figure 17: North America Cloud Workload Protection Industry Revenue Share (%), by Deployment 2024 & 2032
- Figure 18: North America Cloud Workload Protection Industry Revenue (Million), by End-User 2024 & 2032
- Figure 19: North America Cloud Workload Protection Industry Revenue Share (%), by End-User 2024 & 2032
- Figure 20: North America Cloud Workload Protection Industry Revenue (Million), by Country 2024 & 2032
- Figure 21: North America Cloud Workload Protection Industry Revenue Share (%), by Country 2024 & 2032
- Figure 22: Europe Cloud Workload Protection Industry Revenue (Million), by Component 2024 & 2032
- Figure 23: Europe Cloud Workload Protection Industry Revenue Share (%), by Component 2024 & 2032
- Figure 24: Europe Cloud Workload Protection Industry Revenue (Million), by Deployment 2024 & 2032
- Figure 25: Europe Cloud Workload Protection Industry Revenue Share (%), by Deployment 2024 & 2032
- Figure 26: Europe Cloud Workload Protection Industry Revenue (Million), by End-User 2024 & 2032
- Figure 27: Europe Cloud Workload Protection Industry Revenue Share (%), by End-User 2024 & 2032
- Figure 28: Europe Cloud Workload Protection Industry Revenue (Million), by Country 2024 & 2032
- Figure 29: Europe Cloud Workload Protection Industry Revenue Share (%), by Country 2024 & 2032
- Figure 30: Asia Pacific Cloud Workload Protection Industry Revenue (Million), by Component 2024 & 2032
- Figure 31: Asia Pacific Cloud Workload Protection Industry Revenue Share (%), by Component 2024 & 2032
- Figure 32: Asia Pacific Cloud Workload Protection Industry Revenue (Million), by Deployment 2024 & 2032
- Figure 33: Asia Pacific Cloud Workload Protection Industry Revenue Share (%), by Deployment 2024 & 2032
- Figure 34: Asia Pacific Cloud Workload Protection Industry Revenue (Million), by End-User 2024 & 2032
- Figure 35: Asia Pacific Cloud Workload Protection Industry Revenue Share (%), by End-User 2024 & 2032
- Figure 36: Asia Pacific Cloud Workload Protection Industry Revenue (Million), by Country 2024 & 2032
- Figure 37: Asia Pacific Cloud Workload Protection Industry Revenue Share (%), by Country 2024 & 2032
- Figure 38: Rest of the Word Cloud Workload Protection Industry Revenue (Million), by Component 2024 & 2032
- Figure 39: Rest of the Word Cloud Workload Protection Industry Revenue Share (%), by Component 2024 & 2032
- Figure 40: Rest of the Word Cloud Workload Protection Industry Revenue (Million), by Deployment 2024 & 2032
- Figure 41: Rest of the Word Cloud Workload Protection Industry Revenue Share (%), by Deployment 2024 & 2032
- Figure 42: Rest of the Word Cloud Workload Protection Industry Revenue (Million), by End-User 2024 & 2032
- Figure 43: Rest of the Word Cloud Workload Protection Industry Revenue Share (%), by End-User 2024 & 2032
- Figure 44: Rest of the Word Cloud Workload Protection Industry Revenue (Million), by Country 2024 & 2032
- Figure 45: Rest of the Word Cloud Workload Protection Industry Revenue Share (%), by Country 2024 & 2032
List of Tables
- Table 1: Global Cloud Workload Protection Industry Revenue Million Forecast, by Region 2019 & 2032
- Table 2: Global Cloud Workload Protection Industry Revenue Million Forecast, by Component 2019 & 2032
- Table 3: Global Cloud Workload Protection Industry Revenue Million Forecast, by Deployment 2019 & 2032
- Table 4: Global Cloud Workload Protection Industry Revenue Million Forecast, by End-User 2019 & 2032
- Table 5: Global Cloud Workload Protection Industry Revenue Million Forecast, by Region 2019 & 2032
- Table 6: Global Cloud Workload Protection Industry Revenue Million Forecast, by Country 2019 & 2032
- Table 7: United States Cloud Workload Protection Industry Revenue (Million) Forecast, by Application 2019 & 2032
- Table 8: Canada Cloud Workload Protection Industry Revenue (Million) Forecast, by Application 2019 & 2032
- Table 9: Mexico Cloud Workload Protection Industry Revenue (Million) Forecast, by Application 2019 & 2032
- Table 10: Global Cloud Workload Protection Industry Revenue Million Forecast, by Country 2019 & 2032
- Table 11: Germany Cloud Workload Protection Industry Revenue (Million) Forecast, by Application 2019 & 2032
- Table 12: United Kingdom Cloud Workload Protection Industry Revenue (Million) Forecast, by Application 2019 & 2032
- Table 13: France Cloud Workload Protection Industry Revenue (Million) Forecast, by Application 2019 & 2032
- Table 14: Spain Cloud Workload Protection Industry Revenue (Million) Forecast, by Application 2019 & 2032
- Table 15: Italy Cloud Workload Protection Industry Revenue (Million) Forecast, by Application 2019 & 2032
- Table 16: Spain Cloud Workload Protection Industry Revenue (Million) Forecast, by Application 2019 & 2032
- Table 17: Belgium Cloud Workload Protection Industry Revenue (Million) Forecast, by Application 2019 & 2032
- Table 18: Netherland Cloud Workload Protection Industry Revenue (Million) Forecast, by Application 2019 & 2032
- Table 19: Nordics Cloud Workload Protection Industry Revenue (Million) Forecast, by Application 2019 & 2032
- Table 20: Rest of Europe Cloud Workload Protection Industry Revenue (Million) Forecast, by Application 2019 & 2032
- Table 21: Global Cloud Workload Protection Industry Revenue Million Forecast, by Country 2019 & 2032
- Table 22: China Cloud Workload Protection Industry Revenue (Million) Forecast, by Application 2019 & 2032
- Table 23: Japan Cloud Workload Protection Industry Revenue (Million) Forecast, by Application 2019 & 2032
- Table 24: India Cloud Workload Protection Industry Revenue (Million) Forecast, by Application 2019 & 2032
- Table 25: South Korea Cloud Workload Protection Industry Revenue (Million) Forecast, by Application 2019 & 2032
- Table 26: Southeast Asia Cloud Workload Protection Industry Revenue (Million) Forecast, by Application 2019 & 2032
- Table 27: Australia Cloud Workload Protection Industry Revenue (Million) Forecast, by Application 2019 & 2032
- Table 28: Indonesia Cloud Workload Protection Industry Revenue (Million) Forecast, by Application 2019 & 2032
- Table 29: Phillipes Cloud Workload Protection Industry Revenue (Million) Forecast, by Application 2019 & 2032
- Table 30: Singapore Cloud Workload Protection Industry Revenue (Million) Forecast, by Application 2019 & 2032
- Table 31: Thailandc Cloud Workload Protection Industry Revenue (Million) Forecast, by Application 2019 & 2032
- Table 32: Rest of Asia Pacific Cloud Workload Protection Industry Revenue (Million) Forecast, by Application 2019 & 2032
- Table 33: Global Cloud Workload Protection Industry Revenue Million Forecast, by Country 2019 & 2032
- Table 34: Brazil Cloud Workload Protection Industry Revenue (Million) Forecast, by Application 2019 & 2032
- Table 35: Argentina Cloud Workload Protection Industry Revenue (Million) Forecast, by Application 2019 & 2032
- Table 36: Peru Cloud Workload Protection Industry Revenue (Million) Forecast, by Application 2019 & 2032
- Table 37: Chile Cloud Workload Protection Industry Revenue (Million) Forecast, by Application 2019 & 2032
- Table 38: Colombia Cloud Workload Protection Industry Revenue (Million) Forecast, by Application 2019 & 2032
- Table 39: Ecuador Cloud Workload Protection Industry Revenue (Million) Forecast, by Application 2019 & 2032
- Table 40: Venezuela Cloud Workload Protection Industry Revenue (Million) Forecast, by Application 2019 & 2032
- Table 41: Rest of South America Cloud Workload Protection Industry Revenue (Million) Forecast, by Application 2019 & 2032
- Table 42: Global Cloud Workload Protection Industry Revenue Million Forecast, by Country 2019 & 2032
- Table 43: United States Cloud Workload Protection Industry Revenue (Million) Forecast, by Application 2019 & 2032
- Table 44: Canada Cloud Workload Protection Industry Revenue (Million) Forecast, by Application 2019 & 2032
- Table 45: Mexico Cloud Workload Protection Industry Revenue (Million) Forecast, by Application 2019 & 2032
- Table 46: Global Cloud Workload Protection Industry Revenue Million Forecast, by Country 2019 & 2032
- Table 47: United Arab Emirates Cloud Workload Protection Industry Revenue (Million) Forecast, by Application 2019 & 2032
- Table 48: Saudi Arabia Cloud Workload Protection Industry Revenue (Million) Forecast, by Application 2019 & 2032
- Table 49: South Africa Cloud Workload Protection Industry Revenue (Million) Forecast, by Application 2019 & 2032
- Table 50: Rest of Middle East and Africa Cloud Workload Protection Industry Revenue (Million) Forecast, by Application 2019 & 2032
- Table 51: Global Cloud Workload Protection Industry Revenue Million Forecast, by Component 2019 & 2032
- Table 52: Global Cloud Workload Protection Industry Revenue Million Forecast, by Deployment 2019 & 2032
- Table 53: Global Cloud Workload Protection Industry Revenue Million Forecast, by End-User 2019 & 2032
- Table 54: Global Cloud Workload Protection Industry Revenue Million Forecast, by Country 2019 & 2032
- Table 55: Global Cloud Workload Protection Industry Revenue Million Forecast, by Component 2019 & 2032
- Table 56: Global Cloud Workload Protection Industry Revenue Million Forecast, by Deployment 2019 & 2032
- Table 57: Global Cloud Workload Protection Industry Revenue Million Forecast, by End-User 2019 & 2032
- Table 58: Global Cloud Workload Protection Industry Revenue Million Forecast, by Country 2019 & 2032
- Table 59: Global Cloud Workload Protection Industry Revenue Million Forecast, by Component 2019 & 2032
- Table 60: Global Cloud Workload Protection Industry Revenue Million Forecast, by Deployment 2019 & 2032
- Table 61: Global Cloud Workload Protection Industry Revenue Million Forecast, by End-User 2019 & 2032
- Table 62: Global Cloud Workload Protection Industry Revenue Million Forecast, by Country 2019 & 2032
- Table 63: Global Cloud Workload Protection Industry Revenue Million Forecast, by Component 2019 & 2032
- Table 64: Global Cloud Workload Protection Industry Revenue Million Forecast, by Deployment 2019 & 2032
- Table 65: Global Cloud Workload Protection Industry Revenue Million Forecast, by End-User 2019 & 2032
- Table 66: Global Cloud Workload Protection Industry Revenue Million Forecast, by Country 2019 & 2032
Frequently Asked Questions
1. What is the projected Compound Annual Growth Rate (CAGR) of the Cloud Workload Protection Industry?
The projected CAGR is approximately 24.20%.
2. Which companies are prominent players in the Cloud Workload Protection Industry?
Key companies in the market include Sophos Group plc, Trend Micro Inc, Tripwire Inc , McAfee LLC, Broadcom Inc, HyTrust, Guardicore, Dome9 Security Inc, LogRhythm Inc, CloudPassage.
3. What are the main segments of the Cloud Workload Protection Industry?
The market segments include Component, Deployment, End-User.
4. Can you provide details about the market size?
The market size is estimated to be USD XX Million as of 2022.
5. What are some drivers contributing to market growth?
; Increasing Adoption of the Multi-Cloud Strategy Among Enterprises; Seamless Scalability and Reduced Operational Costs.
6. What are the notable trends driving market growth?
Hybrid Cloud Deployment to Drive the Market Growth.
7. Are there any restraints impacting market growth?
; Adherence to Multiple Regulatory Compliances.
8. Can you provide examples of recent developments in the market?
N/A
9. What pricing options are available for accessing the report?
Pricing options include single-user, multi-user, and enterprise licenses priced at USD 4750, USD 5250, and USD 8750 respectively.
10. Is the market size provided in terms of value or volume?
The market size is provided in terms of value, measured in Million.
11. Are there any specific market keywords associated with the report?
Yes, the market keyword associated with the report is "Cloud Workload Protection Industry," which aids in identifying and referencing the specific market segment covered.
12. How do I determine which pricing option suits my needs best?
The pricing options vary based on user requirements and access needs. Individual users may opt for single-user licenses, while businesses requiring broader access may choose multi-user or enterprise licenses for cost-effective access to the report.
13. Are there any additional resources or data provided in the Cloud Workload Protection Industry report?
While the report offers comprehensive insights, it's advisable to review the specific contents or supplementary materials provided to ascertain if additional resources or data are available.
14. How can I stay updated on further developments or reports in the Cloud Workload Protection Industry?
To stay informed about further developments, trends, and reports in the Cloud Workload Protection Industry, consider subscribing to industry newsletters, following relevant companies and organizations, or regularly checking reputable industry news sources and publications.
Methodology
Step 1 - Identification of Relevant Samples Size from Population Database


Step 2 - Approaches for Defining Global Market Size (Value, Volume* & Price*)

Note*: In applicable scenarios
Step 3 - Data Sources
Primary Research
- Web Analytics
- Survey Reports
- Research Institute
- Latest Research Reports
- Opinion Leaders
Secondary Research
- Annual Reports
- White Paper
- Latest Press Release
- Industry Association
- Paid Database
- Investor Presentations

Step 4 - Data Triangulation
Involves using different sources of information in order to increase the validity of a study
These sources are likely to be stakeholders in a program - participants, other researchers, program staff, other community members, and so on.
Then we put all data in single framework & apply various statistical tools to find out the dynamic on the market.
During the analysis stage, feedback from the stakeholder groups would be compared to determine areas of agreement as well as areas of divergence
