

Key Insights
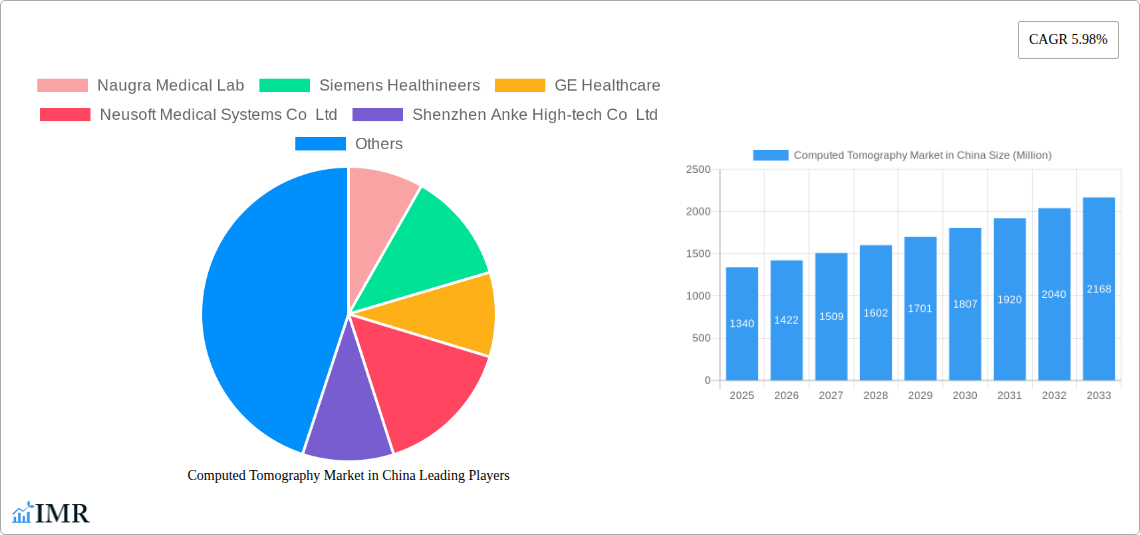
The Chinese Computed Tomography (CT) market, valued at $1.34 billion in 2025, is projected to experience robust growth, exhibiting a Compound Annual Growth Rate (CAGR) of 5.98% from 2025 to 2033. This expansion is fueled by several key factors. Rising prevalence of chronic diseases like cancer and cardiovascular ailments necessitates increased diagnostic imaging procedures, driving demand for CT scanners. Technological advancements, such as multi-slice CT technology offering faster scan times and improved image quality, are further enhancing market appeal. Government initiatives promoting healthcare infrastructure development and increased healthcare spending also contribute significantly to market growth. The market is segmented by end-user (hospitals, diagnostic centers, other), type (low, medium, and high-slice CT scanners), and application (oncology, neurology, cardiovascular, musculoskeletal, and others). Hospitals currently dominate the end-user segment, owing to their extensive diagnostic capabilities and higher patient volume. High-slice CT scanners, providing superior image resolution and detail, represent a significant portion of the market, although medium-slice scanners maintain a substantial presence due to cost-effectiveness. The oncology application segment is expected to witness particularly strong growth, mirroring the increasing incidence of cancer in China. Competition is fierce, with major players like Siemens Healthineers, GE Healthcare, and others vying for market share through technological innovation, strategic partnerships, and competitive pricing strategies.
The market's growth trajectory is, however, subject to certain constraints. High initial investment costs associated with CT scanner acquisition and maintenance can limit market penetration, especially in smaller healthcare facilities. Furthermore, stringent regulatory approvals and increasing healthcare costs pose challenges to sustained market expansion. To overcome these hurdles, manufacturers are focusing on developing cost-effective solutions and exploring innovative financing models to broaden market access. The future of the Chinese CT market hinges on technological advancements, regulatory landscape, and the evolving healthcare infrastructure. The continuous rise in chronic diseases and the government's focus on improving healthcare access will likely maintain the market's strong growth trajectory throughout the forecast period. The strategic positioning of major players and their technological innovations will also play a crucial role in shaping market dynamics.
Computed Tomography Market in China: A Comprehensive Market Report (2019-2033)
This in-depth report provides a comprehensive analysis of the Computed Tomography (CT) market in China, covering market dynamics, growth trends, regional segmentation, product landscape, key players, and future outlook. The report utilizes data from the historical period (2019-2024), base year (2025), and estimated year (2025) to forecast market trends from 2025 to 2033. This detailed analysis is crucial for industry professionals, investors, and strategic decision-makers seeking to understand and capitalize on the opportunities within this rapidly evolving market. The report segments the market by End-User (Hospitals, Diagnostic Centers, Other End-Users), Type (Low Slice, Medium Slice, High Slice), and Application (Oncology, Neurology, Cardiovascular, Musculoskeletal, Other Applications).
Computed Tomography Market in China: Market Dynamics & Structure
The Chinese CT market is characterized by a dynamic interplay of factors shaping its structure and growth. Market concentration is moderate, with several major international and domestic players vying for market share. Technological innovation, particularly in areas like multi-slice CT and AI-powered image analysis, is a key driver. The regulatory framework, while evolving, plays a significant role in market access and product approvals. Competitive substitutes, such as MRI and ultrasound, exert some pressure, while the expanding healthcare infrastructure and rising incidence of chronic diseases are strong growth catalysts. M&A activity remains a significant factor, with larger players seeking to consolidate market position and expand their product portfolios.
- Market Concentration: Moderate, with a mix of multinational and domestic players. Top 5 players hold approximately xx% of the market share in 2025.
- Technological Innovation: Driven by advancements in multi-slice technology, AI-powered image analysis, and improved radiation dose reduction techniques.
- Regulatory Framework: Evolving, impacting market access and product approvals. Stringent regulatory requirements influence technology adoption.
- Competitive Substitutes: MRI and ultrasound present some competitive pressure, particularly in specific applications.
- End-User Demographics: Growing aging population and increasing prevalence of chronic diseases fuel demand. Rapid urbanization contributes to the concentration of diagnostic centers in metropolitan areas.
- M&A Trends: Consolidation amongst players is expected to continue, driving further market concentration. The number of M&A deals in the period 2019-2024 was xx, with an estimated xx Million USD in total value. xx% of deals involved international companies.
Computed Tomography Market in China: Growth Trends & Insights
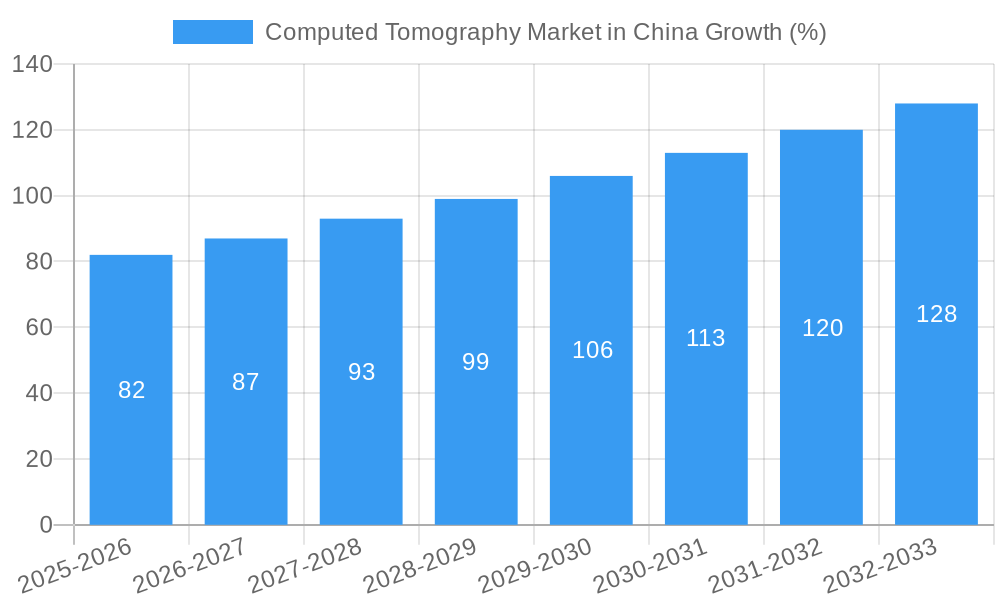
The Chinese CT market is experiencing robust growth, driven by factors including increasing healthcare expenditure, rising prevalence of chronic diseases, and government initiatives to improve healthcare infrastructure. The market size is projected to reach xx Million units by 2025 and further expand at a Compound Annual Growth Rate (CAGR) of xx% during the forecast period (2025-2033), reaching xx Million units by 2033. This growth is fueled by technological advancements, leading to higher adoption rates, particularly in advanced imaging techniques. Consumer behavior is shifting towards greater demand for faster, more accurate, and less invasive diagnostic procedures, which benefits CT technology. Market penetration remains relatively low compared to developed nations, indicating significant growth potential.
(Further detail on specific CAGR figures, market penetration rates, and technological disruptions will be provided within the full report.)
Dominant Regions, Countries, or Segments in Computed Tomography Market in China
The market is experiencing varied growth rates across different regions and segments. Tier 1 cities are currently the most significant market drivers due to higher healthcare expenditure and concentration of advanced medical facilities. However, government initiatives aimed at improving healthcare access in lower-tier cities are expected to accelerate growth in these regions. The Hospitals segment dominates the end-user landscape, holding approximately xx% market share, followed by Diagnostic Centers and Other End-Users. Among CT types, Medium Slice CTs currently hold the largest market share, but High Slice CTs are experiencing the fastest growth due to their superior image quality and capabilities. Oncology applications currently represent the largest application segment, driven by the rising incidence of cancer.
- Key Drivers:
- Expanding healthcare infrastructure, particularly in lower-tier cities.
- Government initiatives to improve access to healthcare.
- Rising prevalence of chronic diseases, including cancer, cardiovascular diseases, and neurological disorders.
- Increasing healthcare expenditure.
- Dominant Segments: Hospitals (End-User), Medium Slice (Type), Oncology (Application). (Detailed market share breakdowns for all segments and regions will be included in the complete report.)
Computed Tomography Market in China: Product Landscape
The CT market in China showcases a diverse range of products, encompassing various slice counts, technological advancements, and applications. Manufacturers are constantly innovating to enhance image quality, reduce radiation exposure, and improve diagnostic accuracy. Key features differentiating products include advanced reconstruction algorithms, improved detectors, and integration with AI-powered image analysis tools. Unique selling propositions often revolve around speed, image quality, ease of use, and patient comfort.
(Further details about specific product innovations and performance metrics will be provided in the full report.)
Key Drivers, Barriers & Challenges in Computed Tomography Market in China
Key Drivers:
- Government initiatives to expand healthcare access.
- Rising prevalence of chronic diseases.
- Technological advancements in CT technology.
- Growing healthcare expenditure.
Challenges and Restraints:
- High initial investment costs for hospitals and diagnostic centers.
- Stringent regulatory approvals and compliance requirements.
- Competition from other imaging modalities.
- Concerns regarding radiation exposure. (Further quantitative analysis on challenges and their impact will be included in the full report)
Emerging Opportunities in Computed Tomography Market in China
Emerging opportunities lie in expanding CT adoption in lower-tier cities, leveraging AI for improved image analysis and diagnostics, and developing specialized CT applications for specific disease areas. The integration of telemedicine and remote diagnosis also presents significant growth potential. Increased focus on preventative healthcare may also drive demand.
Growth Accelerators in the Computed Tomography Market in China Industry
The long-term growth of the Chinese CT market is fueled by technological advancements, strategic partnerships between international and domestic companies, and the ongoing expansion of healthcare infrastructure into previously underserved regions. Government support for medical technology innovation and investment in healthcare infrastructure serves as a crucial catalyst.
Key Players Shaping the Computed Tomography Market in China Market
- Naugra Medical Lab
- Siemens Healthineers
- GE Healthcare
- Neusoft Medical Systems Co Ltd
- Shenzhen Anke High-tech Co Ltd
- Koninklijke Philips NV
- Canon Medical Systems Corporation
- MinFound Medical Systems Co Ltd
- Planmed Oy
- Fujifilm Holdings Corporation
Notable Milestones in Computed Tomography Market in China Sector
- March 2023: Elekta launched a cooperative venture with China National Pharmaceutical Group Co., Ltd. (Sinopharm) to expand the use of radiation therapy (often integrated with CT) in lower-tier cities. This significantly increases potential market access.
- February 2022: Siemens Healthineers and Universal Medical Imaging partnered to promote 5G remote imaging diagnosis for primary care. This accelerates the adoption of CT technology in remote areas.
In-Depth Computed Tomography Market in China Market Outlook
The future of the Chinese CT market looks promising, driven by sustained growth in healthcare expenditure, technological advancements, and government support. Strategic partnerships and market expansions into underserved regions represent key opportunities for market participants. The increasing adoption of AI and remote diagnostics will shape the future landscape, creating new avenues for growth and innovation. The market is expected to maintain a robust growth trajectory throughout the forecast period.
Computed Tomography Market in China Segmentation
-
1. Type
- 1.1. Low Slice
- 1.2. Medium Slice
- 1.3. High Slice
-
2. Application
- 2.1. Oncology
- 2.2. Neurology
- 2.3. Cardiovascular
- 2.4. Musculoskeletal
- 2.5. Other Applications
-
3. End User
- 3.1. Hospitals
- 3.2. Diagnostic Centers
- 3.3. Other End Users
Computed Tomography Market in China Segmentation By Geography
-
1. North America
- 1.1. United States
- 1.2. Canada
- 1.3. Mexico
-
2. South America
- 2.1. Brazil
- 2.2. Argentina
- 2.3. Rest of South America
-
3. Europe
- 3.1. United Kingdom
- 3.2. Germany
- 3.3. France
- 3.4. Italy
- 3.5. Spain
- 3.6. Russia
- 3.7. Benelux
- 3.8. Nordics
- 3.9. Rest of Europe
-
4. Middle East & Africa
- 4.1. Turkey
- 4.2. Israel
- 4.3. GCC
- 4.4. North Africa
- 4.5. South Africa
- 4.6. Rest of Middle East & Africa
-
5. Asia Pacific
- 5.1. China
- 5.2. India
- 5.3. Japan
- 5.4. South Korea
- 5.5. ASEAN
- 5.6. Oceania
- 5.7. Rest of Asia Pacific
Computed Tomography Market in China REPORT HIGHLIGHTS
| Aspects | Details |
|---|---|
| Study Period | 2019-2033 |
| Base Year | 2024 |
| Estimated Year | 2025 |
| Forecast Period | 2025-2033 |
| Historical Period | 2019-2024 |
| Growth Rate | CAGR of 5.98% from 2019-2033 |
| Segmentation |
|
Table of Contents
- 1. Introduction
- 1.1. Research Scope
- 1.2. Market Segmentation
- 1.3. Research Methodology
- 1.4. Definitions and Assumptions
- 2. Executive Summary
- 2.1. Introduction
- 3. Market Dynamics
- 3.1. Introduction
- 3.2. Market Drivers
- 3.2.1. Increasing Geriatric Population and Chronic Disease Burden; Technological Advancements in Computed Tomography
- 3.3. Market Restrains
- 3.3.1. High Cost Associated With CT Scan Procedure and Equipment
- 3.4. Market Trends
- 3.4.1. Diagnostic Centers to Hold Significant Share in End-User Segment Over the Forecast Period
- 4. Market Factor Analysis
- 4.1. Porters Five Forces
- 4.2. Supply/Value Chain
- 4.3. PESTEL analysis
- 4.4. Market Entropy
- 4.5. Patent/Trademark Analysis
- 5. Global Computed Tomography Market in China Analysis, Insights and Forecast, 2019-2031
- 5.1. Market Analysis, Insights and Forecast - by Type
- 5.1.1. Low Slice
- 5.1.2. Medium Slice
- 5.1.3. High Slice
- 5.2. Market Analysis, Insights and Forecast - by Application
- 5.2.1. Oncology
- 5.2.2. Neurology
- 5.2.3. Cardiovascular
- 5.2.4. Musculoskeletal
- 5.2.5. Other Applications
- 5.3. Market Analysis, Insights and Forecast - by End User
- 5.3.1. Hospitals
- 5.3.2. Diagnostic Centers
- 5.3.3. Other End Users
- 5.4. Market Analysis, Insights and Forecast - by Region
- 5.4.1. North America
- 5.4.2. South America
- 5.4.3. Europe
- 5.4.4. Middle East & Africa
- 5.4.5. Asia Pacific
- 5.1. Market Analysis, Insights and Forecast - by Type
- 6. North America Computed Tomography Market in China Analysis, Insights and Forecast, 2019-2031
- 6.1. Market Analysis, Insights and Forecast - by Type
- 6.1.1. Low Slice
- 6.1.2. Medium Slice
- 6.1.3. High Slice
- 6.2. Market Analysis, Insights and Forecast - by Application
- 6.2.1. Oncology
- 6.2.2. Neurology
- 6.2.3. Cardiovascular
- 6.2.4. Musculoskeletal
- 6.2.5. Other Applications
- 6.3. Market Analysis, Insights and Forecast - by End User
- 6.3.1. Hospitals
- 6.3.2. Diagnostic Centers
- 6.3.3. Other End Users
- 6.1. Market Analysis, Insights and Forecast - by Type
- 7. South America Computed Tomography Market in China Analysis, Insights and Forecast, 2019-2031
- 7.1. Market Analysis, Insights and Forecast - by Type
- 7.1.1. Low Slice
- 7.1.2. Medium Slice
- 7.1.3. High Slice
- 7.2. Market Analysis, Insights and Forecast - by Application
- 7.2.1. Oncology
- 7.2.2. Neurology
- 7.2.3. Cardiovascular
- 7.2.4. Musculoskeletal
- 7.2.5. Other Applications
- 7.3. Market Analysis, Insights and Forecast - by End User
- 7.3.1. Hospitals
- 7.3.2. Diagnostic Centers
- 7.3.3. Other End Users
- 7.1. Market Analysis, Insights and Forecast - by Type
- 8. Europe Computed Tomography Market in China Analysis, Insights and Forecast, 2019-2031
- 8.1. Market Analysis, Insights and Forecast - by Type
- 8.1.1. Low Slice
- 8.1.2. Medium Slice
- 8.1.3. High Slice
- 8.2. Market Analysis, Insights and Forecast - by Application
- 8.2.1. Oncology
- 8.2.2. Neurology
- 8.2.3. Cardiovascular
- 8.2.4. Musculoskeletal
- 8.2.5. Other Applications
- 8.3. Market Analysis, Insights and Forecast - by End User
- 8.3.1. Hospitals
- 8.3.2. Diagnostic Centers
- 8.3.3. Other End Users
- 8.1. Market Analysis, Insights and Forecast - by Type
- 9. Middle East & Africa Computed Tomography Market in China Analysis, Insights and Forecast, 2019-2031
- 9.1. Market Analysis, Insights and Forecast - by Type
- 9.1.1. Low Slice
- 9.1.2. Medium Slice
- 9.1.3. High Slice
- 9.2. Market Analysis, Insights and Forecast - by Application
- 9.2.1. Oncology
- 9.2.2. Neurology
- 9.2.3. Cardiovascular
- 9.2.4. Musculoskeletal
- 9.2.5. Other Applications
- 9.3. Market Analysis, Insights and Forecast - by End User
- 9.3.1. Hospitals
- 9.3.2. Diagnostic Centers
- 9.3.3. Other End Users
- 9.1. Market Analysis, Insights and Forecast - by Type
- 10. Asia Pacific Computed Tomography Market in China Analysis, Insights and Forecast, 2019-2031
- 10.1. Market Analysis, Insights and Forecast - by Type
- 10.1.1. Low Slice
- 10.1.2. Medium Slice
- 10.1.3. High Slice
- 10.2. Market Analysis, Insights and Forecast - by Application
- 10.2.1. Oncology
- 10.2.2. Neurology
- 10.2.3. Cardiovascular
- 10.2.4. Musculoskeletal
- 10.2.5. Other Applications
- 10.3. Market Analysis, Insights and Forecast - by End User
- 10.3.1. Hospitals
- 10.3.2. Diagnostic Centers
- 10.3.3. Other End Users
- 10.1. Market Analysis, Insights and Forecast - by Type
- 11. Competitive Analysis
- 11.1. Global Market Share Analysis 2024
- 11.2. Company Profiles
- 11.2.1 Naugra Medical Lab
- 11.2.1.1. Overview
- 11.2.1.2. Products
- 11.2.1.3. SWOT Analysis
- 11.2.1.4. Recent Developments
- 11.2.1.5. Financials (Based on Availability)
- 11.2.2 Siemens Healthineers
- 11.2.2.1. Overview
- 11.2.2.2. Products
- 11.2.2.3. SWOT Analysis
- 11.2.2.4. Recent Developments
- 11.2.2.5. Financials (Based on Availability)
- 11.2.3 GE Healthcare
- 11.2.3.1. Overview
- 11.2.3.2. Products
- 11.2.3.3. SWOT Analysis
- 11.2.3.4. Recent Developments
- 11.2.3.5. Financials (Based on Availability)
- 11.2.4 Neusoft Medical Systems Co Ltd
- 11.2.4.1. Overview
- 11.2.4.2. Products
- 11.2.4.3. SWOT Analysis
- 11.2.4.4. Recent Developments
- 11.2.4.5. Financials (Based on Availability)
- 11.2.5 Shenzhen Anke High-tech Co Ltd
- 11.2.5.1. Overview
- 11.2.5.2. Products
- 11.2.5.3. SWOT Analysis
- 11.2.5.4. Recent Developments
- 11.2.5.5. Financials (Based on Availability)
- 11.2.6 Koninklijke Philips NV
- 11.2.6.1. Overview
- 11.2.6.2. Products
- 11.2.6.3. SWOT Analysis
- 11.2.6.4. Recent Developments
- 11.2.6.5. Financials (Based on Availability)
- 11.2.7 Canon Medical Systems Corporation
- 11.2.7.1. Overview
- 11.2.7.2. Products
- 11.2.7.3. SWOT Analysis
- 11.2.7.4. Recent Developments
- 11.2.7.5. Financials (Based on Availability)
- 11.2.8 MinFound Medical Systems Co Ltd
- 11.2.8.1. Overview
- 11.2.8.2. Products
- 11.2.8.3. SWOT Analysis
- 11.2.8.4. Recent Developments
- 11.2.8.5. Financials (Based on Availability)
- 11.2.9 Planmed Oy
- 11.2.9.1. Overview
- 11.2.9.2. Products
- 11.2.9.3. SWOT Analysis
- 11.2.9.4. Recent Developments
- 11.2.9.5. Financials (Based on Availability)
- 11.2.10 Fujifilm Holdings Corporation
- 11.2.10.1. Overview
- 11.2.10.2. Products
- 11.2.10.3. SWOT Analysis
- 11.2.10.4. Recent Developments
- 11.2.10.5. Financials (Based on Availability)
- 11.2.1 Naugra Medical Lab
List of Figures
- Figure 1: Global Computed Tomography Market in China Revenue Breakdown (Million, %) by Region 2024 & 2032
- Figure 2: China Computed Tomography Market in China Revenue (Million), by Country 2024 & 2032
- Figure 3: China Computed Tomography Market in China Revenue Share (%), by Country 2024 & 2032
- Figure 4: North America Computed Tomography Market in China Revenue (Million), by Type 2024 & 2032
- Figure 5: North America Computed Tomography Market in China Revenue Share (%), by Type 2024 & 2032
- Figure 6: North America Computed Tomography Market in China Revenue (Million), by Application 2024 & 2032
- Figure 7: North America Computed Tomography Market in China Revenue Share (%), by Application 2024 & 2032
- Figure 8: North America Computed Tomography Market in China Revenue (Million), by End User 2024 & 2032
- Figure 9: North America Computed Tomography Market in China Revenue Share (%), by End User 2024 & 2032
- Figure 10: North America Computed Tomography Market in China Revenue (Million), by Country 2024 & 2032
- Figure 11: North America Computed Tomography Market in China Revenue Share (%), by Country 2024 & 2032
- Figure 12: South America Computed Tomography Market in China Revenue (Million), by Type 2024 & 2032
- Figure 13: South America Computed Tomography Market in China Revenue Share (%), by Type 2024 & 2032
- Figure 14: South America Computed Tomography Market in China Revenue (Million), by Application 2024 & 2032
- Figure 15: South America Computed Tomography Market in China Revenue Share (%), by Application 2024 & 2032
- Figure 16: South America Computed Tomography Market in China Revenue (Million), by End User 2024 & 2032
- Figure 17: South America Computed Tomography Market in China Revenue Share (%), by End User 2024 & 2032
- Figure 18: South America Computed Tomography Market in China Revenue (Million), by Country 2024 & 2032
- Figure 19: South America Computed Tomography Market in China Revenue Share (%), by Country 2024 & 2032
- Figure 20: Europe Computed Tomography Market in China Revenue (Million), by Type 2024 & 2032
- Figure 21: Europe Computed Tomography Market in China Revenue Share (%), by Type 2024 & 2032
- Figure 22: Europe Computed Tomography Market in China Revenue (Million), by Application 2024 & 2032
- Figure 23: Europe Computed Tomography Market in China Revenue Share (%), by Application 2024 & 2032
- Figure 24: Europe Computed Tomography Market in China Revenue (Million), by End User 2024 & 2032
- Figure 25: Europe Computed Tomography Market in China Revenue Share (%), by End User 2024 & 2032
- Figure 26: Europe Computed Tomography Market in China Revenue (Million), by Country 2024 & 2032
- Figure 27: Europe Computed Tomography Market in China Revenue Share (%), by Country 2024 & 2032
- Figure 28: Middle East & Africa Computed Tomography Market in China Revenue (Million), by Type 2024 & 2032
- Figure 29: Middle East & Africa Computed Tomography Market in China Revenue Share (%), by Type 2024 & 2032
- Figure 30: Middle East & Africa Computed Tomography Market in China Revenue (Million), by Application 2024 & 2032
- Figure 31: Middle East & Africa Computed Tomography Market in China Revenue Share (%), by Application 2024 & 2032
- Figure 32: Middle East & Africa Computed Tomography Market in China Revenue (Million), by End User 2024 & 2032
- Figure 33: Middle East & Africa Computed Tomography Market in China Revenue Share (%), by End User 2024 & 2032
- Figure 34: Middle East & Africa Computed Tomography Market in China Revenue (Million), by Country 2024 & 2032
- Figure 35: Middle East & Africa Computed Tomography Market in China Revenue Share (%), by Country 2024 & 2032
- Figure 36: Asia Pacific Computed Tomography Market in China Revenue (Million), by Type 2024 & 2032
- Figure 37: Asia Pacific Computed Tomography Market in China Revenue Share (%), by Type 2024 & 2032
- Figure 38: Asia Pacific Computed Tomography Market in China Revenue (Million), by Application 2024 & 2032
- Figure 39: Asia Pacific Computed Tomography Market in China Revenue Share (%), by Application 2024 & 2032
- Figure 40: Asia Pacific Computed Tomography Market in China Revenue (Million), by End User 2024 & 2032
- Figure 41: Asia Pacific Computed Tomography Market in China Revenue Share (%), by End User 2024 & 2032
- Figure 42: Asia Pacific Computed Tomography Market in China Revenue (Million), by Country 2024 & 2032
- Figure 43: Asia Pacific Computed Tomography Market in China Revenue Share (%), by Country 2024 & 2032
List of Tables
- Table 1: Global Computed Tomography Market in China Revenue Million Forecast, by Region 2019 & 2032
- Table 2: Global Computed Tomography Market in China Revenue Million Forecast, by Type 2019 & 2032
- Table 3: Global Computed Tomography Market in China Revenue Million Forecast, by Application 2019 & 2032
- Table 4: Global Computed Tomography Market in China Revenue Million Forecast, by End User 2019 & 2032
- Table 5: Global Computed Tomography Market in China Revenue Million Forecast, by Region 2019 & 2032
- Table 6: Global Computed Tomography Market in China Revenue Million Forecast, by Country 2019 & 2032
- Table 7: Global Computed Tomography Market in China Revenue Million Forecast, by Type 2019 & 2032
- Table 8: Global Computed Tomography Market in China Revenue Million Forecast, by Application 2019 & 2032
- Table 9: Global Computed Tomography Market in China Revenue Million Forecast, by End User 2019 & 2032
- Table 10: Global Computed Tomography Market in China Revenue Million Forecast, by Country 2019 & 2032
- Table 11: United States Computed Tomography Market in China Revenue (Million) Forecast, by Application 2019 & 2032
- Table 12: Canada Computed Tomography Market in China Revenue (Million) Forecast, by Application 2019 & 2032
- Table 13: Mexico Computed Tomography Market in China Revenue (Million) Forecast, by Application 2019 & 2032
- Table 14: Global Computed Tomography Market in China Revenue Million Forecast, by Type 2019 & 2032
- Table 15: Global Computed Tomography Market in China Revenue Million Forecast, by Application 2019 & 2032
- Table 16: Global Computed Tomography Market in China Revenue Million Forecast, by End User 2019 & 2032
- Table 17: Global Computed Tomography Market in China Revenue Million Forecast, by Country 2019 & 2032
- Table 18: Brazil Computed Tomography Market in China Revenue (Million) Forecast, by Application 2019 & 2032
- Table 19: Argentina Computed Tomography Market in China Revenue (Million) Forecast, by Application 2019 & 2032
- Table 20: Rest of South America Computed Tomography Market in China Revenue (Million) Forecast, by Application 2019 & 2032
- Table 21: Global Computed Tomography Market in China Revenue Million Forecast, by Type 2019 & 2032
- Table 22: Global Computed Tomography Market in China Revenue Million Forecast, by Application 2019 & 2032
- Table 23: Global Computed Tomography Market in China Revenue Million Forecast, by End User 2019 & 2032
- Table 24: Global Computed Tomography Market in China Revenue Million Forecast, by Country 2019 & 2032
- Table 25: United Kingdom Computed Tomography Market in China Revenue (Million) Forecast, by Application 2019 & 2032
- Table 26: Germany Computed Tomography Market in China Revenue (Million) Forecast, by Application 2019 & 2032
- Table 27: France Computed Tomography Market in China Revenue (Million) Forecast, by Application 2019 & 2032
- Table 28: Italy Computed Tomography Market in China Revenue (Million) Forecast, by Application 2019 & 2032
- Table 29: Spain Computed Tomography Market in China Revenue (Million) Forecast, by Application 2019 & 2032
- Table 30: Russia Computed Tomography Market in China Revenue (Million) Forecast, by Application 2019 & 2032
- Table 31: Benelux Computed Tomography Market in China Revenue (Million) Forecast, by Application 2019 & 2032
- Table 32: Nordics Computed Tomography Market in China Revenue (Million) Forecast, by Application 2019 & 2032
- Table 33: Rest of Europe Computed Tomography Market in China Revenue (Million) Forecast, by Application 2019 & 2032
- Table 34: Global Computed Tomography Market in China Revenue Million Forecast, by Type 2019 & 2032
- Table 35: Global Computed Tomography Market in China Revenue Million Forecast, by Application 2019 & 2032
- Table 36: Global Computed Tomography Market in China Revenue Million Forecast, by End User 2019 & 2032
- Table 37: Global Computed Tomography Market in China Revenue Million Forecast, by Country 2019 & 2032
- Table 38: Turkey Computed Tomography Market in China Revenue (Million) Forecast, by Application 2019 & 2032
- Table 39: Israel Computed Tomography Market in China Revenue (Million) Forecast, by Application 2019 & 2032
- Table 40: GCC Computed Tomography Market in China Revenue (Million) Forecast, by Application 2019 & 2032
- Table 41: North Africa Computed Tomography Market in China Revenue (Million) Forecast, by Application 2019 & 2032
- Table 42: South Africa Computed Tomography Market in China Revenue (Million) Forecast, by Application 2019 & 2032
- Table 43: Rest of Middle East & Africa Computed Tomography Market in China Revenue (Million) Forecast, by Application 2019 & 2032
- Table 44: Global Computed Tomography Market in China Revenue Million Forecast, by Type 2019 & 2032
- Table 45: Global Computed Tomography Market in China Revenue Million Forecast, by Application 2019 & 2032
- Table 46: Global Computed Tomography Market in China Revenue Million Forecast, by End User 2019 & 2032
- Table 47: Global Computed Tomography Market in China Revenue Million Forecast, by Country 2019 & 2032
- Table 48: China Computed Tomography Market in China Revenue (Million) Forecast, by Application 2019 & 2032
- Table 49: India Computed Tomography Market in China Revenue (Million) Forecast, by Application 2019 & 2032
- Table 50: Japan Computed Tomography Market in China Revenue (Million) Forecast, by Application 2019 & 2032
- Table 51: South Korea Computed Tomography Market in China Revenue (Million) Forecast, by Application 2019 & 2032
- Table 52: ASEAN Computed Tomography Market in China Revenue (Million) Forecast, by Application 2019 & 2032
- Table 53: Oceania Computed Tomography Market in China Revenue (Million) Forecast, by Application 2019 & 2032
- Table 54: Rest of Asia Pacific Computed Tomography Market in China Revenue (Million) Forecast, by Application 2019 & 2032
Frequently Asked Questions
1. What is the projected Compound Annual Growth Rate (CAGR) of the Computed Tomography Market in China?
The projected CAGR is approximately 5.98%.
2. Which companies are prominent players in the Computed Tomography Market in China?
Key companies in the market include Naugra Medical Lab, Siemens Healthineers, GE Healthcare, Neusoft Medical Systems Co Ltd, Shenzhen Anke High-tech Co Ltd, Koninklijke Philips NV, Canon Medical Systems Corporation, MinFound Medical Systems Co Ltd, Planmed Oy, Fujifilm Holdings Corporation.
3. What are the main segments of the Computed Tomography Market in China?
The market segments include Type, Application, End User.
4. Can you provide details about the market size?
The market size is estimated to be USD 1.34 Million as of 2022.
5. What are some drivers contributing to market growth?
Increasing Geriatric Population and Chronic Disease Burden; Technological Advancements in Computed Tomography.
6. What are the notable trends driving market growth?
Diagnostic Centers to Hold Significant Share in End-User Segment Over the Forecast Period.
7. Are there any restraints impacting market growth?
High Cost Associated With CT Scan Procedure and Equipment.
8. Can you provide examples of recent developments in the market?
March 2023: Elekta launched a cooperative venture with China National Pharmaceutical Group Co., Ltd. (Sinopharm) to expand the use of radiation therapy in so-called lower-tier cities, where around 70% of the population lives.
9. What pricing options are available for accessing the report?
Pricing options include single-user, multi-user, and enterprise licenses priced at USD 3800, USD 4500, and USD 5800 respectively.
10. Is the market size provided in terms of value or volume?
The market size is provided in terms of value, measured in Million.
11. Are there any specific market keywords associated with the report?
Yes, the market keyword associated with the report is "Computed Tomography Market in China," which aids in identifying and referencing the specific market segment covered.
12. How do I determine which pricing option suits my needs best?
The pricing options vary based on user requirements and access needs. Individual users may opt for single-user licenses, while businesses requiring broader access may choose multi-user or enterprise licenses for cost-effective access to the report.
13. Are there any additional resources or data provided in the Computed Tomography Market in China report?
While the report offers comprehensive insights, it's advisable to review the specific contents or supplementary materials provided to ascertain if additional resources or data are available.
14. How can I stay updated on further developments or reports in the Computed Tomography Market in China?
To stay informed about further developments, trends, and reports in the Computed Tomography Market in China, consider subscribing to industry newsletters, following relevant companies and organizations, or regularly checking reputable industry news sources and publications.
Methodology
Step 1 - Identification of Relevant Samples Size from Population Database


Step 2 - Approaches for Defining Global Market Size (Value, Volume* & Price*)

Note*: In applicable scenarios
Step 3 - Data Sources
Primary Research
- Web Analytics
- Survey Reports
- Research Institute
- Latest Research Reports
- Opinion Leaders
Secondary Research
- Annual Reports
- White Paper
- Latest Press Release
- Industry Association
- Paid Database
- Investor Presentations

Step 4 - Data Triangulation
Involves using different sources of information in order to increase the validity of a study
These sources are likely to be stakeholders in a program - participants, other researchers, program staff, other community members, and so on.
Then we put all data in single framework & apply various statistical tools to find out the dynamic on the market.
During the analysis stage, feedback from the stakeholder groups would be compared to determine areas of agreement as well as areas of divergence
