

Key Insights
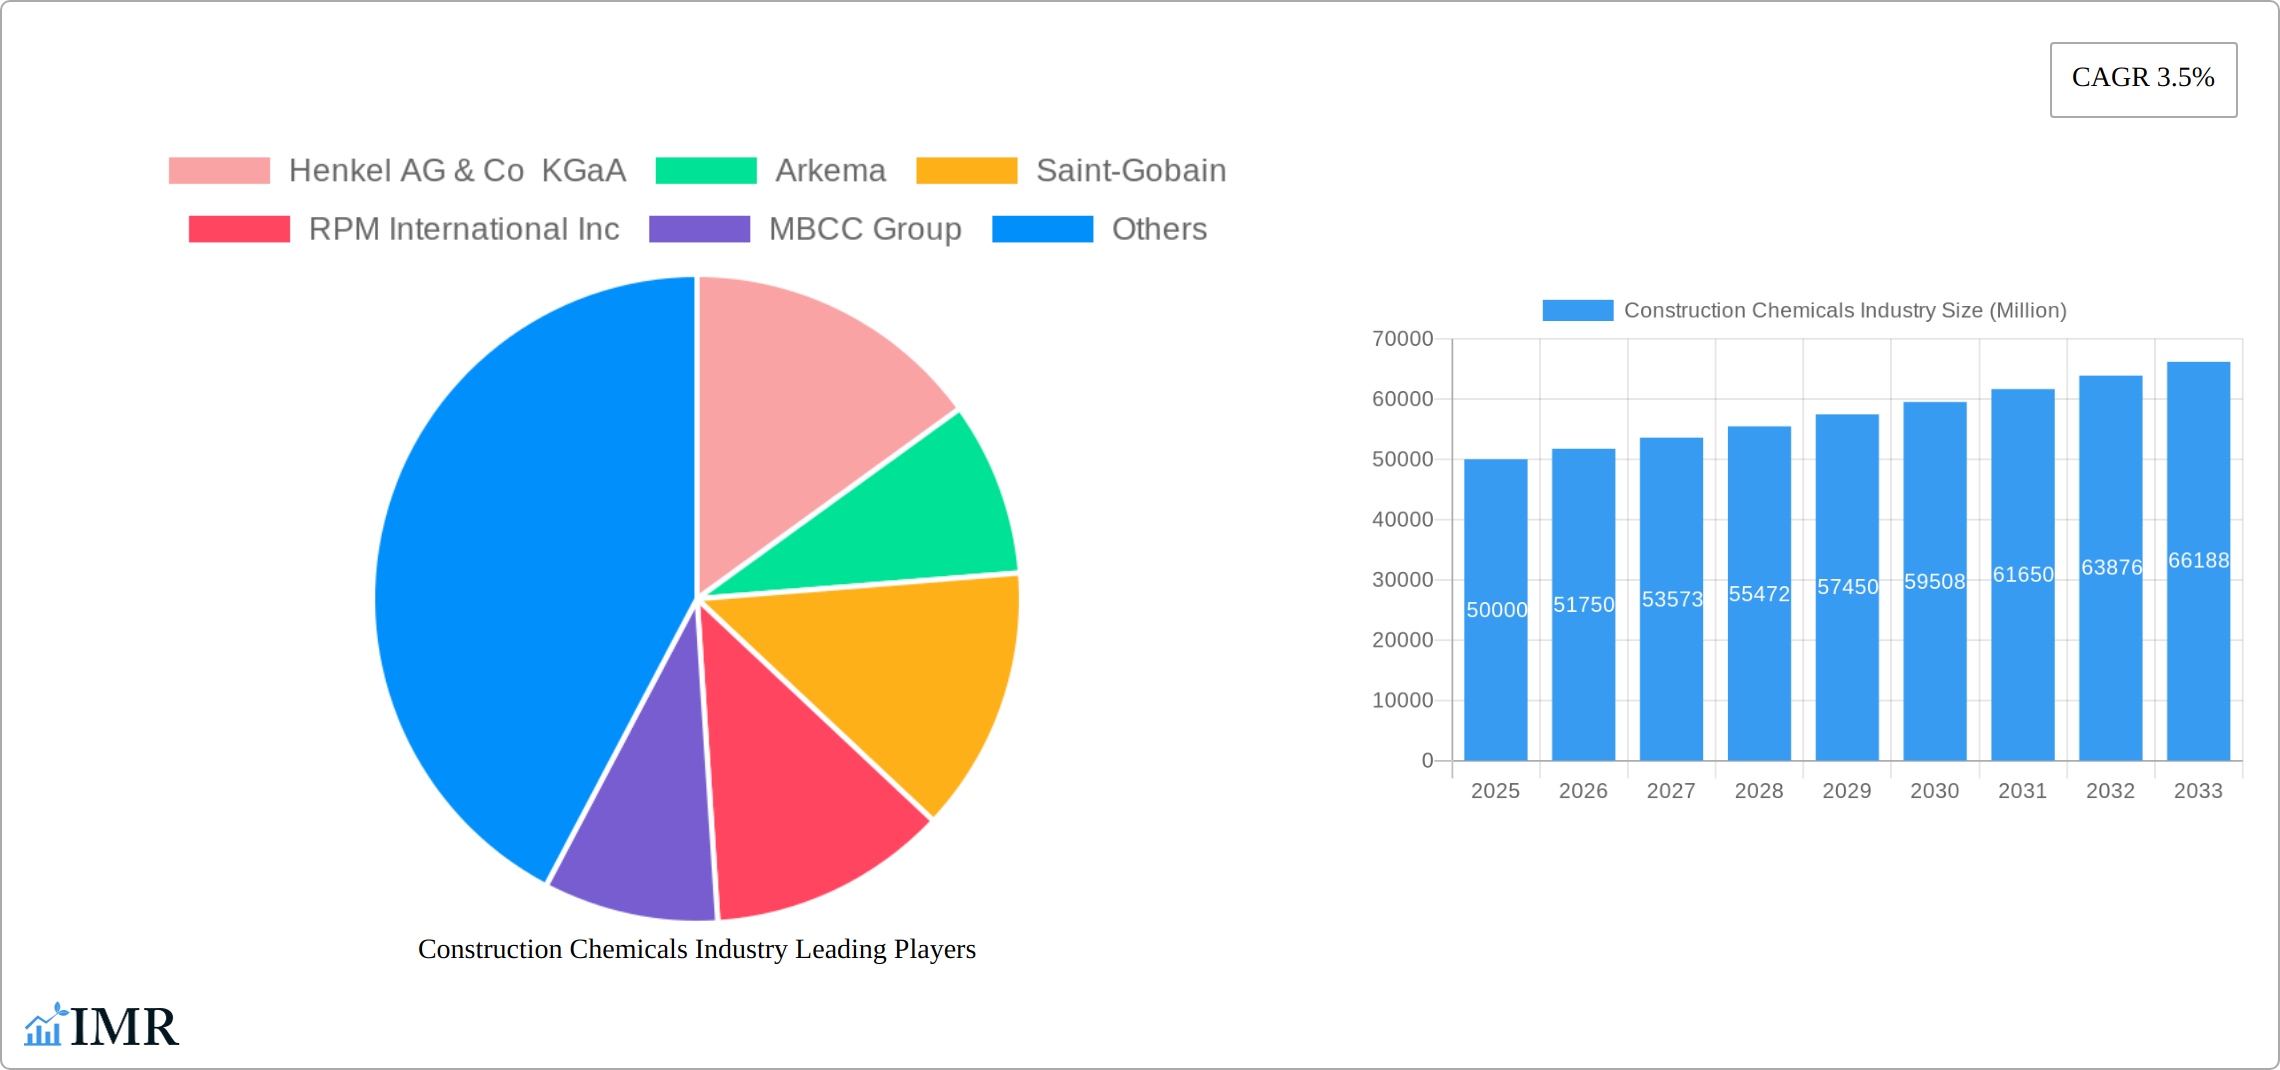
The global construction chemicals market, valued at approximately $XX million in 2025, is projected to experience steady growth, driven by a compound annual growth rate (CAGR) of 3.5% from 2025 to 2033. This growth is fueled by several key factors. Firstly, the ongoing global infrastructure development projects, particularly in emerging economies experiencing rapid urbanization, significantly boost demand for construction chemicals. Secondly, the increasing focus on sustainable and green building practices is driving adoption of eco-friendly construction chemicals that enhance durability, energy efficiency, and reduce environmental impact. This trend is particularly pronounced in developed nations with stringent environmental regulations. Thirdly, technological advancements in the formulation and application of these chemicals are leading to improved performance characteristics, such as enhanced strength, water resistance, and longevity, further stimulating market growth. However, fluctuating raw material prices and the cyclical nature of the construction industry pose challenges to consistent market expansion.
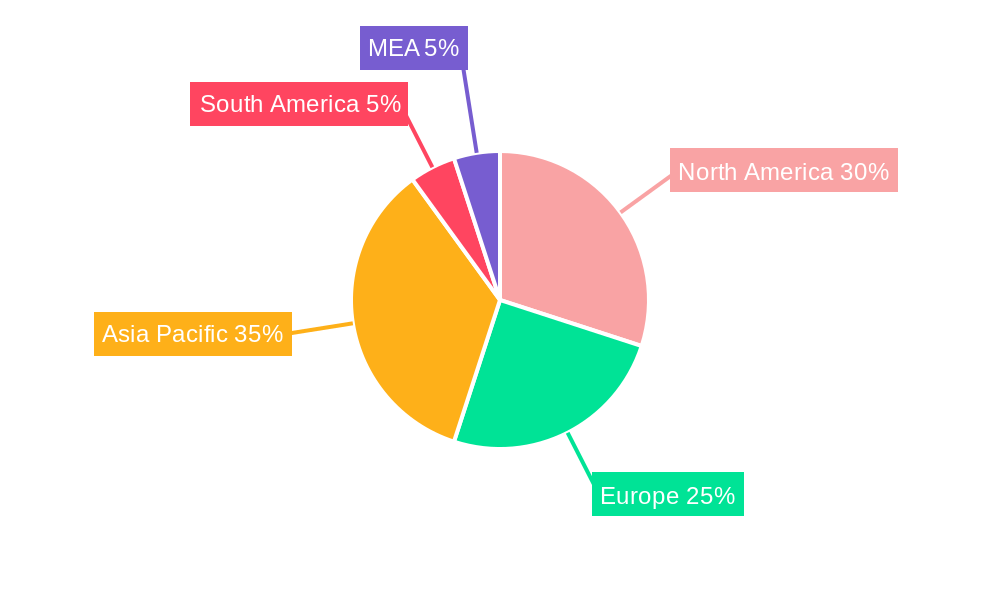
The market is segmented by end-use sector (commercial, industrial & institutional, infrastructure, residential) and product type (adhesives, membranes, sealants, coatings, concrete additives). The infrastructure and residential sectors are expected to be major growth drivers, reflecting the significant investment in both new construction and renovation projects globally. Within product segments, adhesives and sealants are projected to maintain strong growth due to their widespread use in various construction applications. Geographically, North America and Europe currently hold significant market share, driven by robust construction activity and high adoption of advanced technologies. However, Asia-Pacific is expected to witness substantial growth during the forecast period, propelled by rapid infrastructure development in countries like China and India. Key players in this competitive market include Henkel, Arkema, Saint-Gobain, RPM International, and Sika, among others, constantly innovating and expanding their product portfolios to maintain market leadership. The market is expected to remain fragmented with both large multinational companies and regional players competing for market share.
Construction Chemicals Industry Market Report: 2019-2033
This comprehensive report provides an in-depth analysis of the Construction Chemicals market, encompassing market dynamics, growth trends, regional dominance, product landscape, challenges, opportunities, and key players. The report covers the period 2019-2033, with a base year of 2025 and a forecast period of 2025-2033. The total market size in 2025 is estimated at XX Million.
Construction Chemicals Industry Market Dynamics & Structure
The global construction chemicals market exhibits moderate concentration, with several key players commanding significant market share. A primary driver of growth is technological innovation, fueled by the demand for sustainable, high-performance building materials. Stringent regulatory landscapes, prioritizing environmental protection and worker safety, significantly influence product development and market access. The industry faces competitive pressures from substitute materials and cost-optimization initiatives. Market trends are heavily shaped by end-user demographics, including the burgeoning infrastructure development in emerging economies and a rising preference for sustainable construction practices. The industry is also characterized by frequent mergers and acquisitions (M&A) activity, reflecting ongoing consolidation and expansion strategies.
- Market Concentration: The leading five players held an estimated xx% of the global market share in 2025. This concentration is expected to [increase/decrease/remain relatively stable] in the coming years due to [explain the reason, e.g., ongoing M&A activity, entry of new players, etc.].
- Technological Innovation: The focus remains on developing high-performance, sustainable, and environmentally friendly products. Challenges persist in the form of substantial R&D investment requirements and the need for strict regulatory compliance.
- Regulatory Framework: Stringent environmental regulations and safety standards are continuously evolving, impacting product formulation, manufacturing processes, and the overall cost of production. Compliance requires significant investment and expertise.
- M&A Activity: A notable number of M&A transactions have been observed in recent years, reflecting strategic expansion and industry consolidation. A prime example is Sika's acquisition of MBCC Group. The estimated value of M&A deals in 2024 was XX Million, indicating [increasing/decreasing/stable] investment in market consolidation.
- End-User Demographics: Robust demand from both the infrastructure and residential sectors is driving market growth across diverse regions. [Specify which regions are experiencing the highest growth and why].
Construction Chemicals Industry Growth Trends & Insights
The construction chemicals market demonstrated consistent growth between 2019 and 2024, achieving a CAGR of xx%. This growth trajectory is projected to continue through the forecast period (2025-2033), albeit at a slightly moderated pace, with the market expected to reach XX Million by 2033. Several factors underpin this trend. The global boom in infrastructure development, particularly in emerging economies, remains a key driver. The increasing adoption of sustainable construction practices, alongside technological advancements in product development, is fueling demand for high-performance and environmentally conscious construction chemicals. Furthermore, shifting consumer preferences, such as a greater emphasis on energy efficiency and building durability, are impacting market dynamics. While market penetration is currently highest in developed regions, developing regions present substantial growth opportunities. Disruptive technologies, such as the expanded use of 3D printing and automation in construction, are reshaping product demand and application methods.
Dominant Regions, Countries, or Segments in Construction Chemicals Industry
The Asia-Pacific region maintains its position as the leading market for construction chemicals, propelled by robust infrastructure development and rapid urbanization. North America and Europe also retain significant market shares. Within end-use sectors, infrastructure and residential construction remain the dominant segments, followed by commercial and industrial buildings. Among product categories, Adhesives and Sealants continue to hold a substantial market share due to their widespread applications.
- Key Drivers:
- Infrastructure Development: Significant and ongoing investments in infrastructure projects worldwide, particularly in [mention specific countries or regions].
- Urbanization: Rapid urbanization in developing economies fuels substantial demand for residential and commercial construction.
- Government Policies: Supportive government policies promoting sustainable construction practices and incentivizing green building technologies are boosting market growth.
- Economic Growth: Steady economic growth in several key regions directly supports increased construction activity.
- Dominant Segments:
- Asia-Pacific: Maintains high growth potential due to rapid infrastructure development and urbanization, holding an estimated xx% market share in 2025.
- Infrastructure: The largest end-use segment, driven by large-scale projects, with an estimated market value of XX Million in 2025. [Provide specific examples of large-scale projects].
- Adhesives and Sealants: Continue to experience the highest demand due to widespread applications in diverse construction projects, with an estimated market value of XX Million in 2025.
Construction Chemicals Industry Product Landscape
The construction chemicals market offers a diverse range of products, including adhesives, membranes, sealants, coatings, concrete additives, and more. Recent innovations focus on enhancing performance, durability, sustainability, and ease of application. Unique selling propositions include improved bonding strength, enhanced waterproofing capabilities, increased resistance to weathering, and reduced environmental impact. Technological advancements encompass nanotechnology applications, the use of bio-based materials, and the development of smart and self-healing materials.
Key Drivers, Barriers & Challenges in Construction Chemicals Industry
Key Drivers: Growing global infrastructure investments, increasing urbanization, rising demand for sustainable building materials, and technological advancements in product development drive market growth. Government initiatives promoting green building practices further stimulate demand.
Key Challenges & Restraints: Fluctuations in raw material prices, stringent environmental regulations, intense competition, and supply chain disruptions pose significant challenges. The impact of these challenges can be quantified through reduced profit margins, delayed project timelines, and increased manufacturing costs. Economic downturns also significantly affect demand.
Emerging Opportunities in Construction Chemicals Industry
Emerging opportunities lie in the development of innovative, sustainable products catering to green building initiatives. Untapped markets in developing economies present significant growth potential. Advanced materials with self-healing properties and improved durability offer new avenues for market expansion. Furthermore, evolving consumer preferences towards energy-efficient and eco-friendly buildings are shaping market trends.
Growth Accelerators in the Construction Chemicals Industry Industry
Technological breakthroughs in materials science and product innovation are key growth accelerators. Strategic partnerships and collaborations among industry players facilitate knowledge sharing and technological advancements. Expanding into new geographical markets and targeting niche applications further drive market expansion.
Key Players Shaping the Construction Chemicals Industry Market
- Henkel AG & Co KGaA
- Arkema
- Saint-Gobain
- RPM International Inc
- MBCC Group
- LATICRETE International Inc
- H B Fuller Company
- Fosroc Inc
- CEMEX S A B de C V
- Ardex Group
- Sika A
- MAPEI S p A
- Oriental Yuhong
- MC-Bauchemie
- Jiangsu Subote New Material Co Ltd
Notable Milestones in Construction Chemicals Industry Sector
- May 2023: Oriental Yuhong signed a strategic cooperation agreement with Hebei Aorun Shunda Group, expanding its research capabilities in waterproofing and thermal insulation.
- May 2023: Sika acquired MBCC Group, significantly expanding its market share and product portfolio.
- April 2023: Flowcrete (RPM International Inc.) extended the shelf life of its epoxy flooring resin products, improving product handling and reducing waste.
In-Depth Construction Chemicals Industry Market Outlook
The future of the construction chemicals market remains promising, driven by sustained infrastructure development, ongoing urbanization, and the increasing demand for environmentally responsible building solutions. Key strategic opportunities lie in developing innovative, high-performance, and eco-friendly products, expanding into high-growth emerging markets, and cultivating strategic partnerships and collaborations. The market is anticipated to witness continued consolidation through further M&A activity, resulting in heightened market concentration and accelerating technological advancements. [Add a specific prediction about the market, e.g., a specific technology expected to gain traction, a potential shift in regional dominance, etc.].
Construction Chemicals Industry Segmentation
-
1. End Use Sector
- 1.1. Commercial
- 1.2. Industrial and Institutional
- 1.3. Infrastructure
- 1.4. Residential
-
2. Product
-
2.1. Adhesives
-
2.1.1. By Sub Product
- 2.1.1.1. Hot Melt
- 2.1.1.2. Reactive
- 2.1.1.3. Solvent-borne
- 2.1.1.4. Water-borne
-
2.1.1. By Sub Product
-
2.2. Anchors and Grouts
- 2.2.1. Cementitious Fixing
- 2.2.2. Resin Fixing
- 2.2.3. Other Types
-
2.3. Concrete Admixtures
- 2.3.1. Accelerator
- 2.3.2. Air Entraining Admixture
- 2.3.3. High Range Water Reducer (Super Plasticizer)
- 2.3.4. Retarder
- 2.3.5. Shrinkage Reducing Admixture
- 2.3.6. Viscosity Modifier
- 2.3.7. Water Reducer (Plasticizer)
-
2.4. Concrete Protective Coatings
- 2.4.1. Acrylic
- 2.4.2. Alkyd
- 2.4.3. Epoxy
- 2.4.4. Polyurethane
- 2.4.5. Other Resin Types
-
2.5. Flooring Resins
- 2.5.1. Polyaspartic
-
2.6. Repair and Rehabilitation Chemicals
- 2.6.1. Fiber Wrapping Systems
- 2.6.2. Injection Grouting Materials
- 2.6.3. Micro-concrete Mortars
- 2.6.4. Modified Mortars
- 2.6.5. Rebar Protectors
-
2.7. Sealants
- 2.7.1. Silicone
-
2.8. Surface Treatment Chemicals
- 2.8.1. Curing Compounds
- 2.8.2. Mold Release Agents
- 2.8.3. Other Product Types
-
2.9. Waterproofing Solutions
- 2.9.1. Membranes
-
2.1. Adhesives
Construction Chemicals Industry Segmentation By Geography
-
1. North America
- 1.1. United States
- 1.2. Canada
- 1.3. Mexico
-
2. South America
- 2.1. Brazil
- 2.2. Argentina
- 2.3. Rest of South America
-
3. Europe
- 3.1. United Kingdom
- 3.2. Germany
- 3.3. France
- 3.4. Italy
- 3.5. Spain
- 3.6. Russia
- 3.7. Benelux
- 3.8. Nordics
- 3.9. Rest of Europe
-
4. Middle East & Africa
- 4.1. Turkey
- 4.2. Israel
- 4.3. GCC
- 4.4. North Africa
- 4.5. South Africa
- 4.6. Rest of Middle East & Africa
-
5. Asia Pacific
- 5.1. China
- 5.2. India
- 5.3. Japan
- 5.4. South Korea
- 5.5. ASEAN
- 5.6. Oceania
- 5.7. Rest of Asia Pacific
Construction Chemicals Industry REPORT HIGHLIGHTS
| Aspects | Details |
|---|---|
| Study Period | 2019-2033 |
| Base Year | 2024 |
| Estimated Year | 2025 |
| Forecast Period | 2025-2033 |
| Historical Period | 2019-2024 |
| Growth Rate | CAGR of 3.5% from 2019-2033 |
| Segmentation |
|
Table of Contents
- 1. Introduction
- 1.1. Research Scope
- 1.2. Market Segmentation
- 1.3. Research Methodology
- 1.4. Definitions and Assumptions
- 2. Executive Summary
- 2.1. Introduction
- 3. Market Dynamics
- 3.1. Introduction
- 3.2. Market Drivers
- 3.2.1. ; Banning/ Limiting Use of Plastics used in packaging applications
- 3.3. Market Restrains
- 3.3.1. ; Harmful Amines in Dyes; Paperless Green Initiatives
- 3.4. Market Trends
- 3.4.1. OTHER KEY INDUSTRY TRENDS COVERED IN THE REPORT
- 4. Market Factor Analysis
- 4.1. Porters Five Forces
- 4.2. Supply/Value Chain
- 4.3. PESTEL analysis
- 4.4. Market Entropy
- 4.5. Patent/Trademark Analysis
- 5. Global Construction Chemicals Industry Analysis, Insights and Forecast, 2019-2031
- 5.1. Market Analysis, Insights and Forecast - by End Use Sector
- 5.1.1. Commercial
- 5.1.2. Industrial and Institutional
- 5.1.3. Infrastructure
- 5.1.4. Residential
- 5.2. Market Analysis, Insights and Forecast - by Product
- 5.2.1. Adhesives
- 5.2.1.1. By Sub Product
- 5.2.1.1.1. Hot Melt
- 5.2.1.1.2. Reactive
- 5.2.1.1.3. Solvent-borne
- 5.2.1.1.4. Water-borne
- 5.2.1.1. By Sub Product
- 5.2.2. Anchors and Grouts
- 5.2.2.1. Cementitious Fixing
- 5.2.2.2. Resin Fixing
- 5.2.2.3. Other Types
- 5.2.3. Concrete Admixtures
- 5.2.3.1. Accelerator
- 5.2.3.2. Air Entraining Admixture
- 5.2.3.3. High Range Water Reducer (Super Plasticizer)
- 5.2.3.4. Retarder
- 5.2.3.5. Shrinkage Reducing Admixture
- 5.2.3.6. Viscosity Modifier
- 5.2.3.7. Water Reducer (Plasticizer)
- 5.2.4. Concrete Protective Coatings
- 5.2.4.1. Acrylic
- 5.2.4.2. Alkyd
- 5.2.4.3. Epoxy
- 5.2.4.4. Polyurethane
- 5.2.4.5. Other Resin Types
- 5.2.5. Flooring Resins
- 5.2.5.1. Polyaspartic
- 5.2.6. Repair and Rehabilitation Chemicals
- 5.2.6.1. Fiber Wrapping Systems
- 5.2.6.2. Injection Grouting Materials
- 5.2.6.3. Micro-concrete Mortars
- 5.2.6.4. Modified Mortars
- 5.2.6.5. Rebar Protectors
- 5.2.7. Sealants
- 5.2.7.1. Silicone
- 5.2.8. Surface Treatment Chemicals
- 5.2.8.1. Curing Compounds
- 5.2.8.2. Mold Release Agents
- 5.2.8.3. Other Product Types
- 5.2.9. Waterproofing Solutions
- 5.2.9.1. Membranes
- 5.2.1. Adhesives
- 5.3. Market Analysis, Insights and Forecast - by Region
- 5.3.1. North America
- 5.3.2. South America
- 5.3.3. Europe
- 5.3.4. Middle East & Africa
- 5.3.5. Asia Pacific
- 5.1. Market Analysis, Insights and Forecast - by End Use Sector
- 6. North America Construction Chemicals Industry Analysis, Insights and Forecast, 2019-2031
- 6.1. Market Analysis, Insights and Forecast - by End Use Sector
- 6.1.1. Commercial
- 6.1.2. Industrial and Institutional
- 6.1.3. Infrastructure
- 6.1.4. Residential
- 6.2. Market Analysis, Insights and Forecast - by Product
- 6.2.1. Adhesives
- 6.2.1.1. By Sub Product
- 6.2.1.1.1. Hot Melt
- 6.2.1.1.2. Reactive
- 6.2.1.1.3. Solvent-borne
- 6.2.1.1.4. Water-borne
- 6.2.1.1. By Sub Product
- 6.2.2. Anchors and Grouts
- 6.2.2.1. Cementitious Fixing
- 6.2.2.2. Resin Fixing
- 6.2.2.3. Other Types
- 6.2.3. Concrete Admixtures
- 6.2.3.1. Accelerator
- 6.2.3.2. Air Entraining Admixture
- 6.2.3.3. High Range Water Reducer (Super Plasticizer)
- 6.2.3.4. Retarder
- 6.2.3.5. Shrinkage Reducing Admixture
- 6.2.3.6. Viscosity Modifier
- 6.2.3.7. Water Reducer (Plasticizer)
- 6.2.4. Concrete Protective Coatings
- 6.2.4.1. Acrylic
- 6.2.4.2. Alkyd
- 6.2.4.3. Epoxy
- 6.2.4.4. Polyurethane
- 6.2.4.5. Other Resin Types
- 6.2.5. Flooring Resins
- 6.2.5.1. Polyaspartic
- 6.2.6. Repair and Rehabilitation Chemicals
- 6.2.6.1. Fiber Wrapping Systems
- 6.2.6.2. Injection Grouting Materials
- 6.2.6.3. Micro-concrete Mortars
- 6.2.6.4. Modified Mortars
- 6.2.6.5. Rebar Protectors
- 6.2.7. Sealants
- 6.2.7.1. Silicone
- 6.2.8. Surface Treatment Chemicals
- 6.2.8.1. Curing Compounds
- 6.2.8.2. Mold Release Agents
- 6.2.8.3. Other Product Types
- 6.2.9. Waterproofing Solutions
- 6.2.9.1. Membranes
- 6.2.1. Adhesives
- 6.1. Market Analysis, Insights and Forecast - by End Use Sector
- 7. South America Construction Chemicals Industry Analysis, Insights and Forecast, 2019-2031
- 7.1. Market Analysis, Insights and Forecast - by End Use Sector
- 7.1.1. Commercial
- 7.1.2. Industrial and Institutional
- 7.1.3. Infrastructure
- 7.1.4. Residential
- 7.2. Market Analysis, Insights and Forecast - by Product
- 7.2.1. Adhesives
- 7.2.1.1. By Sub Product
- 7.2.1.1.1. Hot Melt
- 7.2.1.1.2. Reactive
- 7.2.1.1.3. Solvent-borne
- 7.2.1.1.4. Water-borne
- 7.2.1.1. By Sub Product
- 7.2.2. Anchors and Grouts
- 7.2.2.1. Cementitious Fixing
- 7.2.2.2. Resin Fixing
- 7.2.2.3. Other Types
- 7.2.3. Concrete Admixtures
- 7.2.3.1. Accelerator
- 7.2.3.2. Air Entraining Admixture
- 7.2.3.3. High Range Water Reducer (Super Plasticizer)
- 7.2.3.4. Retarder
- 7.2.3.5. Shrinkage Reducing Admixture
- 7.2.3.6. Viscosity Modifier
- 7.2.3.7. Water Reducer (Plasticizer)
- 7.2.4. Concrete Protective Coatings
- 7.2.4.1. Acrylic
- 7.2.4.2. Alkyd
- 7.2.4.3. Epoxy
- 7.2.4.4. Polyurethane
- 7.2.4.5. Other Resin Types
- 7.2.5. Flooring Resins
- 7.2.5.1. Polyaspartic
- 7.2.6. Repair and Rehabilitation Chemicals
- 7.2.6.1. Fiber Wrapping Systems
- 7.2.6.2. Injection Grouting Materials
- 7.2.6.3. Micro-concrete Mortars
- 7.2.6.4. Modified Mortars
- 7.2.6.5. Rebar Protectors
- 7.2.7. Sealants
- 7.2.7.1. Silicone
- 7.2.8. Surface Treatment Chemicals
- 7.2.8.1. Curing Compounds
- 7.2.8.2. Mold Release Agents
- 7.2.8.3. Other Product Types
- 7.2.9. Waterproofing Solutions
- 7.2.9.1. Membranes
- 7.2.1. Adhesives
- 7.1. Market Analysis, Insights and Forecast - by End Use Sector
- 8. Europe Construction Chemicals Industry Analysis, Insights and Forecast, 2019-2031
- 8.1. Market Analysis, Insights and Forecast - by End Use Sector
- 8.1.1. Commercial
- 8.1.2. Industrial and Institutional
- 8.1.3. Infrastructure
- 8.1.4. Residential
- 8.2. Market Analysis, Insights and Forecast - by Product
- 8.2.1. Adhesives
- 8.2.1.1. By Sub Product
- 8.2.1.1.1. Hot Melt
- 8.2.1.1.2. Reactive
- 8.2.1.1.3. Solvent-borne
- 8.2.1.1.4. Water-borne
- 8.2.1.1. By Sub Product
- 8.2.2. Anchors and Grouts
- 8.2.2.1. Cementitious Fixing
- 8.2.2.2. Resin Fixing
- 8.2.2.3. Other Types
- 8.2.3. Concrete Admixtures
- 8.2.3.1. Accelerator
- 8.2.3.2. Air Entraining Admixture
- 8.2.3.3. High Range Water Reducer (Super Plasticizer)
- 8.2.3.4. Retarder
- 8.2.3.5. Shrinkage Reducing Admixture
- 8.2.3.6. Viscosity Modifier
- 8.2.3.7. Water Reducer (Plasticizer)
- 8.2.4. Concrete Protective Coatings
- 8.2.4.1. Acrylic
- 8.2.4.2. Alkyd
- 8.2.4.3. Epoxy
- 8.2.4.4. Polyurethane
- 8.2.4.5. Other Resin Types
- 8.2.5. Flooring Resins
- 8.2.5.1. Polyaspartic
- 8.2.6. Repair and Rehabilitation Chemicals
- 8.2.6.1. Fiber Wrapping Systems
- 8.2.6.2. Injection Grouting Materials
- 8.2.6.3. Micro-concrete Mortars
- 8.2.6.4. Modified Mortars
- 8.2.6.5. Rebar Protectors
- 8.2.7. Sealants
- 8.2.7.1. Silicone
- 8.2.8. Surface Treatment Chemicals
- 8.2.8.1. Curing Compounds
- 8.2.8.2. Mold Release Agents
- 8.2.8.3. Other Product Types
- 8.2.9. Waterproofing Solutions
- 8.2.9.1. Membranes
- 8.2.1. Adhesives
- 8.1. Market Analysis, Insights and Forecast - by End Use Sector
- 9. Middle East & Africa Construction Chemicals Industry Analysis, Insights and Forecast, 2019-2031
- 9.1. Market Analysis, Insights and Forecast - by End Use Sector
- 9.1.1. Commercial
- 9.1.2. Industrial and Institutional
- 9.1.3. Infrastructure
- 9.1.4. Residential
- 9.2. Market Analysis, Insights and Forecast - by Product
- 9.2.1. Adhesives
- 9.2.1.1. By Sub Product
- 9.2.1.1.1. Hot Melt
- 9.2.1.1.2. Reactive
- 9.2.1.1.3. Solvent-borne
- 9.2.1.1.4. Water-borne
- 9.2.1.1. By Sub Product
- 9.2.2. Anchors and Grouts
- 9.2.2.1. Cementitious Fixing
- 9.2.2.2. Resin Fixing
- 9.2.2.3. Other Types
- 9.2.3. Concrete Admixtures
- 9.2.3.1. Accelerator
- 9.2.3.2. Air Entraining Admixture
- 9.2.3.3. High Range Water Reducer (Super Plasticizer)
- 9.2.3.4. Retarder
- 9.2.3.5. Shrinkage Reducing Admixture
- 9.2.3.6. Viscosity Modifier
- 9.2.3.7. Water Reducer (Plasticizer)
- 9.2.4. Concrete Protective Coatings
- 9.2.4.1. Acrylic
- 9.2.4.2. Alkyd
- 9.2.4.3. Epoxy
- 9.2.4.4. Polyurethane
- 9.2.4.5. Other Resin Types
- 9.2.5. Flooring Resins
- 9.2.5.1. Polyaspartic
- 9.2.6. Repair and Rehabilitation Chemicals
- 9.2.6.1. Fiber Wrapping Systems
- 9.2.6.2. Injection Grouting Materials
- 9.2.6.3. Micro-concrete Mortars
- 9.2.6.4. Modified Mortars
- 9.2.6.5. Rebar Protectors
- 9.2.7. Sealants
- 9.2.7.1. Silicone
- 9.2.8. Surface Treatment Chemicals
- 9.2.8.1. Curing Compounds
- 9.2.8.2. Mold Release Agents
- 9.2.8.3. Other Product Types
- 9.2.9. Waterproofing Solutions
- 9.2.9.1. Membranes
- 9.2.1. Adhesives
- 9.1. Market Analysis, Insights and Forecast - by End Use Sector
- 10. Asia Pacific Construction Chemicals Industry Analysis, Insights and Forecast, 2019-2031
- 10.1. Market Analysis, Insights and Forecast - by End Use Sector
- 10.1.1. Commercial
- 10.1.2. Industrial and Institutional
- 10.1.3. Infrastructure
- 10.1.4. Residential
- 10.2. Market Analysis, Insights and Forecast - by Product
- 10.2.1. Adhesives
- 10.2.1.1. By Sub Product
- 10.2.1.1.1. Hot Melt
- 10.2.1.1.2. Reactive
- 10.2.1.1.3. Solvent-borne
- 10.2.1.1.4. Water-borne
- 10.2.1.1. By Sub Product
- 10.2.2. Anchors and Grouts
- 10.2.2.1. Cementitious Fixing
- 10.2.2.2. Resin Fixing
- 10.2.2.3. Other Types
- 10.2.3. Concrete Admixtures
- 10.2.3.1. Accelerator
- 10.2.3.2. Air Entraining Admixture
- 10.2.3.3. High Range Water Reducer (Super Plasticizer)
- 10.2.3.4. Retarder
- 10.2.3.5. Shrinkage Reducing Admixture
- 10.2.3.6. Viscosity Modifier
- 10.2.3.7. Water Reducer (Plasticizer)
- 10.2.4. Concrete Protective Coatings
- 10.2.4.1. Acrylic
- 10.2.4.2. Alkyd
- 10.2.4.3. Epoxy
- 10.2.4.4. Polyurethane
- 10.2.4.5. Other Resin Types
- 10.2.5. Flooring Resins
- 10.2.5.1. Polyaspartic
- 10.2.6. Repair and Rehabilitation Chemicals
- 10.2.6.1. Fiber Wrapping Systems
- 10.2.6.2. Injection Grouting Materials
- 10.2.6.3. Micro-concrete Mortars
- 10.2.6.4. Modified Mortars
- 10.2.6.5. Rebar Protectors
- 10.2.7. Sealants
- 10.2.7.1. Silicone
- 10.2.8. Surface Treatment Chemicals
- 10.2.8.1. Curing Compounds
- 10.2.8.2. Mold Release Agents
- 10.2.8.3. Other Product Types
- 10.2.9. Waterproofing Solutions
- 10.2.9.1. Membranes
- 10.2.1. Adhesives
- 10.1. Market Analysis, Insights and Forecast - by End Use Sector
- 11. North America Construction Chemicals Industry Analysis, Insights and Forecast, 2019-2031
- 11.1. Market Analysis, Insights and Forecast - By Country/Sub-region
- 11.1.1 United States
- 11.1.2 Canada
- 11.1.3 Mexico
- 12. Europe Construction Chemicals Industry Analysis, Insights and Forecast, 2019-2031
- 12.1. Market Analysis, Insights and Forecast - By Country/Sub-region
- 12.1.1 Germany
- 12.1.2 France
- 12.1.3 Italy
- 12.1.4 United Kingdom
- 12.1.5 Netherlands
- 12.1.6 Rest of Europe
- 13. Asia Pacific Construction Chemicals Industry Analysis, Insights and Forecast, 2019-2031
- 13.1. Market Analysis, Insights and Forecast - By Country/Sub-region
- 13.1.1 China
- 13.1.2 Japan
- 13.1.3 India
- 13.1.4 South Korea
- 13.1.5 Taiwan
- 13.1.6 Australia
- 13.1.7 Rest of Asia-Pacific
- 14. South America Construction Chemicals Industry Analysis, Insights and Forecast, 2019-2031
- 14.1. Market Analysis, Insights and Forecast - By Country/Sub-region
- 14.1.1 Brazil
- 14.1.2 Argentina
- 14.1.3 Rest of South America
- 15. MEA Construction Chemicals Industry Analysis, Insights and Forecast, 2019-2031
- 15.1. Market Analysis, Insights and Forecast - By Country/Sub-region
- 15.1.1 Middle East
- 15.1.2 Africa
- 16. Competitive Analysis
- 16.1. Global Market Share Analysis 2024
- 16.2. Company Profiles
- 16.2.1 Henkel AG & Co KGaA
- 16.2.1.1. Overview
- 16.2.1.2. Products
- 16.2.1.3. SWOT Analysis
- 16.2.1.4. Recent Developments
- 16.2.1.5. Financials (Based on Availability)
- 16.2.2 Arkema
- 16.2.2.1. Overview
- 16.2.2.2. Products
- 16.2.2.3. SWOT Analysis
- 16.2.2.4. Recent Developments
- 16.2.2.5. Financials (Based on Availability)
- 16.2.3 Saint-Gobain
- 16.2.3.1. Overview
- 16.2.3.2. Products
- 16.2.3.3. SWOT Analysis
- 16.2.3.4. Recent Developments
- 16.2.3.5. Financials (Based on Availability)
- 16.2.4 RPM International Inc
- 16.2.4.1. Overview
- 16.2.4.2. Products
- 16.2.4.3. SWOT Analysis
- 16.2.4.4. Recent Developments
- 16.2.4.5. Financials (Based on Availability)
- 16.2.5 MBCC Group
- 16.2.5.1. Overview
- 16.2.5.2. Products
- 16.2.5.3. SWOT Analysis
- 16.2.5.4. Recent Developments
- 16.2.5.5. Financials (Based on Availability)
- 16.2.6 LATICRETE International Inc
- 16.2.6.1. Overview
- 16.2.6.2. Products
- 16.2.6.3. SWOT Analysis
- 16.2.6.4. Recent Developments
- 16.2.6.5. Financials (Based on Availability)
- 16.2.7 H B Fuller Company
- 16.2.7.1. Overview
- 16.2.7.2. Products
- 16.2.7.3. SWOT Analysis
- 16.2.7.4. Recent Developments
- 16.2.7.5. Financials (Based on Availability)
- 16.2.8 Fosroc Inc
- 16.2.8.1. Overview
- 16.2.8.2. Products
- 16.2.8.3. SWOT Analysis
- 16.2.8.4. Recent Developments
- 16.2.8.5. Financials (Based on Availability)
- 16.2.9 CEMEX S A B de C V
- 16.2.9.1. Overview
- 16.2.9.2. Products
- 16.2.9.3. SWOT Analysis
- 16.2.9.4. Recent Developments
- 16.2.9.5. Financials (Based on Availability)
- 16.2.10 Ardex Group
- 16.2.10.1. Overview
- 16.2.10.2. Products
- 16.2.10.3. SWOT Analysis
- 16.2.10.4. Recent Developments
- 16.2.10.5. Financials (Based on Availability)
- 16.2.11 Sika A
- 16.2.11.1. Overview
- 16.2.11.2. Products
- 16.2.11.3. SWOT Analysis
- 16.2.11.4. Recent Developments
- 16.2.11.5. Financials (Based on Availability)
- 16.2.12 MAPEI S p A
- 16.2.12.1. Overview
- 16.2.12.2. Products
- 16.2.12.3. SWOT Analysis
- 16.2.12.4. Recent Developments
- 16.2.12.5. Financials (Based on Availability)
- 16.2.13 Oriental Yuhong
- 16.2.13.1. Overview
- 16.2.13.2. Products
- 16.2.13.3. SWOT Analysis
- 16.2.13.4. Recent Developments
- 16.2.13.5. Financials (Based on Availability)
- 16.2.14 MC-Bauchemie
- 16.2.14.1. Overview
- 16.2.14.2. Products
- 16.2.14.3. SWOT Analysis
- 16.2.14.4. Recent Developments
- 16.2.14.5. Financials (Based on Availability)
- 16.2.15 Jiangsu Subote New Material Co Ltd
- 16.2.15.1. Overview
- 16.2.15.2. Products
- 16.2.15.3. SWOT Analysis
- 16.2.15.4. Recent Developments
- 16.2.15.5. Financials (Based on Availability)
- 16.2.1 Henkel AG & Co KGaA
List of Figures
- Figure 1: Global Construction Chemicals Industry Revenue Breakdown (Million, %) by Region 2024 & 2032
- Figure 2: Global Construction Chemicals Industry Volume Breakdown (K Tons, %) by Region 2024 & 2032
- Figure 3: North America Construction Chemicals Industry Revenue (Million), by Country 2024 & 2032
- Figure 4: North America Construction Chemicals Industry Volume (K Tons), by Country 2024 & 2032
- Figure 5: North America Construction Chemicals Industry Revenue Share (%), by Country 2024 & 2032
- Figure 6: North America Construction Chemicals Industry Volume Share (%), by Country 2024 & 2032
- Figure 7: Europe Construction Chemicals Industry Revenue (Million), by Country 2024 & 2032
- Figure 8: Europe Construction Chemicals Industry Volume (K Tons), by Country 2024 & 2032
- Figure 9: Europe Construction Chemicals Industry Revenue Share (%), by Country 2024 & 2032
- Figure 10: Europe Construction Chemicals Industry Volume Share (%), by Country 2024 & 2032
- Figure 11: Asia Pacific Construction Chemicals Industry Revenue (Million), by Country 2024 & 2032
- Figure 12: Asia Pacific Construction Chemicals Industry Volume (K Tons), by Country 2024 & 2032
- Figure 13: Asia Pacific Construction Chemicals Industry Revenue Share (%), by Country 2024 & 2032
- Figure 14: Asia Pacific Construction Chemicals Industry Volume Share (%), by Country 2024 & 2032
- Figure 15: South America Construction Chemicals Industry Revenue (Million), by Country 2024 & 2032
- Figure 16: South America Construction Chemicals Industry Volume (K Tons), by Country 2024 & 2032
- Figure 17: South America Construction Chemicals Industry Revenue Share (%), by Country 2024 & 2032
- Figure 18: South America Construction Chemicals Industry Volume Share (%), by Country 2024 & 2032
- Figure 19: MEA Construction Chemicals Industry Revenue (Million), by Country 2024 & 2032
- Figure 20: MEA Construction Chemicals Industry Volume (K Tons), by Country 2024 & 2032
- Figure 21: MEA Construction Chemicals Industry Revenue Share (%), by Country 2024 & 2032
- Figure 22: MEA Construction Chemicals Industry Volume Share (%), by Country 2024 & 2032
- Figure 23: North America Construction Chemicals Industry Revenue (Million), by End Use Sector 2024 & 2032
- Figure 24: North America Construction Chemicals Industry Volume (K Tons), by End Use Sector 2024 & 2032
- Figure 25: North America Construction Chemicals Industry Revenue Share (%), by End Use Sector 2024 & 2032
- Figure 26: North America Construction Chemicals Industry Volume Share (%), by End Use Sector 2024 & 2032
- Figure 27: North America Construction Chemicals Industry Revenue (Million), by Product 2024 & 2032
- Figure 28: North America Construction Chemicals Industry Volume (K Tons), by Product 2024 & 2032
- Figure 29: North America Construction Chemicals Industry Revenue Share (%), by Product 2024 & 2032
- Figure 30: North America Construction Chemicals Industry Volume Share (%), by Product 2024 & 2032
- Figure 31: North America Construction Chemicals Industry Revenue (Million), by Country 2024 & 2032
- Figure 32: North America Construction Chemicals Industry Volume (K Tons), by Country 2024 & 2032
- Figure 33: North America Construction Chemicals Industry Revenue Share (%), by Country 2024 & 2032
- Figure 34: North America Construction Chemicals Industry Volume Share (%), by Country 2024 & 2032
- Figure 35: South America Construction Chemicals Industry Revenue (Million), by End Use Sector 2024 & 2032
- Figure 36: South America Construction Chemicals Industry Volume (K Tons), by End Use Sector 2024 & 2032
- Figure 37: South America Construction Chemicals Industry Revenue Share (%), by End Use Sector 2024 & 2032
- Figure 38: South America Construction Chemicals Industry Volume Share (%), by End Use Sector 2024 & 2032
- Figure 39: South America Construction Chemicals Industry Revenue (Million), by Product 2024 & 2032
- Figure 40: South America Construction Chemicals Industry Volume (K Tons), by Product 2024 & 2032
- Figure 41: South America Construction Chemicals Industry Revenue Share (%), by Product 2024 & 2032
- Figure 42: South America Construction Chemicals Industry Volume Share (%), by Product 2024 & 2032
- Figure 43: South America Construction Chemicals Industry Revenue (Million), by Country 2024 & 2032
- Figure 44: South America Construction Chemicals Industry Volume (K Tons), by Country 2024 & 2032
- Figure 45: South America Construction Chemicals Industry Revenue Share (%), by Country 2024 & 2032
- Figure 46: South America Construction Chemicals Industry Volume Share (%), by Country 2024 & 2032
- Figure 47: Europe Construction Chemicals Industry Revenue (Million), by End Use Sector 2024 & 2032
- Figure 48: Europe Construction Chemicals Industry Volume (K Tons), by End Use Sector 2024 & 2032
- Figure 49: Europe Construction Chemicals Industry Revenue Share (%), by End Use Sector 2024 & 2032
- Figure 50: Europe Construction Chemicals Industry Volume Share (%), by End Use Sector 2024 & 2032
- Figure 51: Europe Construction Chemicals Industry Revenue (Million), by Product 2024 & 2032
- Figure 52: Europe Construction Chemicals Industry Volume (K Tons), by Product 2024 & 2032
- Figure 53: Europe Construction Chemicals Industry Revenue Share (%), by Product 2024 & 2032
- Figure 54: Europe Construction Chemicals Industry Volume Share (%), by Product 2024 & 2032
- Figure 55: Europe Construction Chemicals Industry Revenue (Million), by Country 2024 & 2032
- Figure 56: Europe Construction Chemicals Industry Volume (K Tons), by Country 2024 & 2032
- Figure 57: Europe Construction Chemicals Industry Revenue Share (%), by Country 2024 & 2032
- Figure 58: Europe Construction Chemicals Industry Volume Share (%), by Country 2024 & 2032
- Figure 59: Middle East & Africa Construction Chemicals Industry Revenue (Million), by End Use Sector 2024 & 2032
- Figure 60: Middle East & Africa Construction Chemicals Industry Volume (K Tons), by End Use Sector 2024 & 2032
- Figure 61: Middle East & Africa Construction Chemicals Industry Revenue Share (%), by End Use Sector 2024 & 2032
- Figure 62: Middle East & Africa Construction Chemicals Industry Volume Share (%), by End Use Sector 2024 & 2032
- Figure 63: Middle East & Africa Construction Chemicals Industry Revenue (Million), by Product 2024 & 2032
- Figure 64: Middle East & Africa Construction Chemicals Industry Volume (K Tons), by Product 2024 & 2032
- Figure 65: Middle East & Africa Construction Chemicals Industry Revenue Share (%), by Product 2024 & 2032
- Figure 66: Middle East & Africa Construction Chemicals Industry Volume Share (%), by Product 2024 & 2032
- Figure 67: Middle East & Africa Construction Chemicals Industry Revenue (Million), by Country 2024 & 2032
- Figure 68: Middle East & Africa Construction Chemicals Industry Volume (K Tons), by Country 2024 & 2032
- Figure 69: Middle East & Africa Construction Chemicals Industry Revenue Share (%), by Country 2024 & 2032
- Figure 70: Middle East & Africa Construction Chemicals Industry Volume Share (%), by Country 2024 & 2032
- Figure 71: Asia Pacific Construction Chemicals Industry Revenue (Million), by End Use Sector 2024 & 2032
- Figure 72: Asia Pacific Construction Chemicals Industry Volume (K Tons), by End Use Sector 2024 & 2032
- Figure 73: Asia Pacific Construction Chemicals Industry Revenue Share (%), by End Use Sector 2024 & 2032
- Figure 74: Asia Pacific Construction Chemicals Industry Volume Share (%), by End Use Sector 2024 & 2032
- Figure 75: Asia Pacific Construction Chemicals Industry Revenue (Million), by Product 2024 & 2032
- Figure 76: Asia Pacific Construction Chemicals Industry Volume (K Tons), by Product 2024 & 2032
- Figure 77: Asia Pacific Construction Chemicals Industry Revenue Share (%), by Product 2024 & 2032
- Figure 78: Asia Pacific Construction Chemicals Industry Volume Share (%), by Product 2024 & 2032
- Figure 79: Asia Pacific Construction Chemicals Industry Revenue (Million), by Country 2024 & 2032
- Figure 80: Asia Pacific Construction Chemicals Industry Volume (K Tons), by Country 2024 & 2032
- Figure 81: Asia Pacific Construction Chemicals Industry Revenue Share (%), by Country 2024 & 2032
- Figure 82: Asia Pacific Construction Chemicals Industry Volume Share (%), by Country 2024 & 2032
List of Tables
- Table 1: Global Construction Chemicals Industry Revenue Million Forecast, by Region 2019 & 2032
- Table 2: Global Construction Chemicals Industry Volume K Tons Forecast, by Region 2019 & 2032
- Table 3: Global Construction Chemicals Industry Revenue Million Forecast, by End Use Sector 2019 & 2032
- Table 4: Global Construction Chemicals Industry Volume K Tons Forecast, by End Use Sector 2019 & 2032
- Table 5: Global Construction Chemicals Industry Revenue Million Forecast, by Product 2019 & 2032
- Table 6: Global Construction Chemicals Industry Volume K Tons Forecast, by Product 2019 & 2032
- Table 7: Global Construction Chemicals Industry Revenue Million Forecast, by Region 2019 & 2032
- Table 8: Global Construction Chemicals Industry Volume K Tons Forecast, by Region 2019 & 2032
- Table 9: Global Construction Chemicals Industry Revenue Million Forecast, by Country 2019 & 2032
- Table 10: Global Construction Chemicals Industry Volume K Tons Forecast, by Country 2019 & 2032
- Table 11: United States Construction Chemicals Industry Revenue (Million) Forecast, by Application 2019 & 2032
- Table 12: United States Construction Chemicals Industry Volume (K Tons) Forecast, by Application 2019 & 2032
- Table 13: Canada Construction Chemicals Industry Revenue (Million) Forecast, by Application 2019 & 2032
- Table 14: Canada Construction Chemicals Industry Volume (K Tons) Forecast, by Application 2019 & 2032
- Table 15: Mexico Construction Chemicals Industry Revenue (Million) Forecast, by Application 2019 & 2032
- Table 16: Mexico Construction Chemicals Industry Volume (K Tons) Forecast, by Application 2019 & 2032
- Table 17: Global Construction Chemicals Industry Revenue Million Forecast, by Country 2019 & 2032
- Table 18: Global Construction Chemicals Industry Volume K Tons Forecast, by Country 2019 & 2032
- Table 19: Germany Construction Chemicals Industry Revenue (Million) Forecast, by Application 2019 & 2032
- Table 20: Germany Construction Chemicals Industry Volume (K Tons) Forecast, by Application 2019 & 2032
- Table 21: France Construction Chemicals Industry Revenue (Million) Forecast, by Application 2019 & 2032
- Table 22: France Construction Chemicals Industry Volume (K Tons) Forecast, by Application 2019 & 2032
- Table 23: Italy Construction Chemicals Industry Revenue (Million) Forecast, by Application 2019 & 2032
- Table 24: Italy Construction Chemicals Industry Volume (K Tons) Forecast, by Application 2019 & 2032
- Table 25: United Kingdom Construction Chemicals Industry Revenue (Million) Forecast, by Application 2019 & 2032
- Table 26: United Kingdom Construction Chemicals Industry Volume (K Tons) Forecast, by Application 2019 & 2032
- Table 27: Netherlands Construction Chemicals Industry Revenue (Million) Forecast, by Application 2019 & 2032
- Table 28: Netherlands Construction Chemicals Industry Volume (K Tons) Forecast, by Application 2019 & 2032
- Table 29: Rest of Europe Construction Chemicals Industry Revenue (Million) Forecast, by Application 2019 & 2032
- Table 30: Rest of Europe Construction Chemicals Industry Volume (K Tons) Forecast, by Application 2019 & 2032
- Table 31: Global Construction Chemicals Industry Revenue Million Forecast, by Country 2019 & 2032
- Table 32: Global Construction Chemicals Industry Volume K Tons Forecast, by Country 2019 & 2032
- Table 33: China Construction Chemicals Industry Revenue (Million) Forecast, by Application 2019 & 2032
- Table 34: China Construction Chemicals Industry Volume (K Tons) Forecast, by Application 2019 & 2032
- Table 35: Japan Construction Chemicals Industry Revenue (Million) Forecast, by Application 2019 & 2032
- Table 36: Japan Construction Chemicals Industry Volume (K Tons) Forecast, by Application 2019 & 2032
- Table 37: India Construction Chemicals Industry Revenue (Million) Forecast, by Application 2019 & 2032
- Table 38: India Construction Chemicals Industry Volume (K Tons) Forecast, by Application 2019 & 2032
- Table 39: South Korea Construction Chemicals Industry Revenue (Million) Forecast, by Application 2019 & 2032
- Table 40: South Korea Construction Chemicals Industry Volume (K Tons) Forecast, by Application 2019 & 2032
- Table 41: Taiwan Construction Chemicals Industry Revenue (Million) Forecast, by Application 2019 & 2032
- Table 42: Taiwan Construction Chemicals Industry Volume (K Tons) Forecast, by Application 2019 & 2032
- Table 43: Australia Construction Chemicals Industry Revenue (Million) Forecast, by Application 2019 & 2032
- Table 44: Australia Construction Chemicals Industry Volume (K Tons) Forecast, by Application 2019 & 2032
- Table 45: Rest of Asia-Pacific Construction Chemicals Industry Revenue (Million) Forecast, by Application 2019 & 2032
- Table 46: Rest of Asia-Pacific Construction Chemicals Industry Volume (K Tons) Forecast, by Application 2019 & 2032
- Table 47: Global Construction Chemicals Industry Revenue Million Forecast, by Country 2019 & 2032
- Table 48: Global Construction Chemicals Industry Volume K Tons Forecast, by Country 2019 & 2032
- Table 49: Brazil Construction Chemicals Industry Revenue (Million) Forecast, by Application 2019 & 2032
- Table 50: Brazil Construction Chemicals Industry Volume (K Tons) Forecast, by Application 2019 & 2032
- Table 51: Argentina Construction Chemicals Industry Revenue (Million) Forecast, by Application 2019 & 2032
- Table 52: Argentina Construction Chemicals Industry Volume (K Tons) Forecast, by Application 2019 & 2032
- Table 53: Rest of South America Construction Chemicals Industry Revenue (Million) Forecast, by Application 2019 & 2032
- Table 54: Rest of South America Construction Chemicals Industry Volume (K Tons) Forecast, by Application 2019 & 2032
- Table 55: Global Construction Chemicals Industry Revenue Million Forecast, by Country 2019 & 2032
- Table 56: Global Construction Chemicals Industry Volume K Tons Forecast, by Country 2019 & 2032
- Table 57: Middle East Construction Chemicals Industry Revenue (Million) Forecast, by Application 2019 & 2032
- Table 58: Middle East Construction Chemicals Industry Volume (K Tons) Forecast, by Application 2019 & 2032
- Table 59: Africa Construction Chemicals Industry Revenue (Million) Forecast, by Application 2019 & 2032
- Table 60: Africa Construction Chemicals Industry Volume (K Tons) Forecast, by Application 2019 & 2032
- Table 61: Global Construction Chemicals Industry Revenue Million Forecast, by End Use Sector 2019 & 2032
- Table 62: Global Construction Chemicals Industry Volume K Tons Forecast, by End Use Sector 2019 & 2032
- Table 63: Global Construction Chemicals Industry Revenue Million Forecast, by Product 2019 & 2032
- Table 64: Global Construction Chemicals Industry Volume K Tons Forecast, by Product 2019 & 2032
- Table 65: Global Construction Chemicals Industry Revenue Million Forecast, by Country 2019 & 2032
- Table 66: Global Construction Chemicals Industry Volume K Tons Forecast, by Country 2019 & 2032
- Table 67: United States Construction Chemicals Industry Revenue (Million) Forecast, by Application 2019 & 2032
- Table 68: United States Construction Chemicals Industry Volume (K Tons) Forecast, by Application 2019 & 2032
- Table 69: Canada Construction Chemicals Industry Revenue (Million) Forecast, by Application 2019 & 2032
- Table 70: Canada Construction Chemicals Industry Volume (K Tons) Forecast, by Application 2019 & 2032
- Table 71: Mexico Construction Chemicals Industry Revenue (Million) Forecast, by Application 2019 & 2032
- Table 72: Mexico Construction Chemicals Industry Volume (K Tons) Forecast, by Application 2019 & 2032
- Table 73: Global Construction Chemicals Industry Revenue Million Forecast, by End Use Sector 2019 & 2032
- Table 74: Global Construction Chemicals Industry Volume K Tons Forecast, by End Use Sector 2019 & 2032
- Table 75: Global Construction Chemicals Industry Revenue Million Forecast, by Product 2019 & 2032
- Table 76: Global Construction Chemicals Industry Volume K Tons Forecast, by Product 2019 & 2032
- Table 77: Global Construction Chemicals Industry Revenue Million Forecast, by Country 2019 & 2032
- Table 78: Global Construction Chemicals Industry Volume K Tons Forecast, by Country 2019 & 2032
- Table 79: Brazil Construction Chemicals Industry Revenue (Million) Forecast, by Application 2019 & 2032
- Table 80: Brazil Construction Chemicals Industry Volume (K Tons) Forecast, by Application 2019 & 2032
- Table 81: Argentina Construction Chemicals Industry Revenue (Million) Forecast, by Application 2019 & 2032
- Table 82: Argentina Construction Chemicals Industry Volume (K Tons) Forecast, by Application 2019 & 2032
- Table 83: Rest of South America Construction Chemicals Industry Revenue (Million) Forecast, by Application 2019 & 2032
- Table 84: Rest of South America Construction Chemicals Industry Volume (K Tons) Forecast, by Application 2019 & 2032
- Table 85: Global Construction Chemicals Industry Revenue Million Forecast, by End Use Sector 2019 & 2032
- Table 86: Global Construction Chemicals Industry Volume K Tons Forecast, by End Use Sector 2019 & 2032
- Table 87: Global Construction Chemicals Industry Revenue Million Forecast, by Product 2019 & 2032
- Table 88: Global Construction Chemicals Industry Volume K Tons Forecast, by Product 2019 & 2032
- Table 89: Global Construction Chemicals Industry Revenue Million Forecast, by Country 2019 & 2032
- Table 90: Global Construction Chemicals Industry Volume K Tons Forecast, by Country 2019 & 2032
- Table 91: United Kingdom Construction Chemicals Industry Revenue (Million) Forecast, by Application 2019 & 2032
- Table 92: United Kingdom Construction Chemicals Industry Volume (K Tons) Forecast, by Application 2019 & 2032
- Table 93: Germany Construction Chemicals Industry Revenue (Million) Forecast, by Application 2019 & 2032
- Table 94: Germany Construction Chemicals Industry Volume (K Tons) Forecast, by Application 2019 & 2032
- Table 95: France Construction Chemicals Industry Revenue (Million) Forecast, by Application 2019 & 2032
- Table 96: France Construction Chemicals Industry Volume (K Tons) Forecast, by Application 2019 & 2032
- Table 97: Italy Construction Chemicals Industry Revenue (Million) Forecast, by Application 2019 & 2032
- Table 98: Italy Construction Chemicals Industry Volume (K Tons) Forecast, by Application 2019 & 2032
- Table 99: Spain Construction Chemicals Industry Revenue (Million) Forecast, by Application 2019 & 2032
- Table 100: Spain Construction Chemicals Industry Volume (K Tons) Forecast, by Application 2019 & 2032
- Table 101: Russia Construction Chemicals Industry Revenue (Million) Forecast, by Application 2019 & 2032
- Table 102: Russia Construction Chemicals Industry Volume (K Tons) Forecast, by Application 2019 & 2032
- Table 103: Benelux Construction Chemicals Industry Revenue (Million) Forecast, by Application 2019 & 2032
- Table 104: Benelux Construction Chemicals Industry Volume (K Tons) Forecast, by Application 2019 & 2032
- Table 105: Nordics Construction Chemicals Industry Revenue (Million) Forecast, by Application 2019 & 2032
- Table 106: Nordics Construction Chemicals Industry Volume (K Tons) Forecast, by Application 2019 & 2032
- Table 107: Rest of Europe Construction Chemicals Industry Revenue (Million) Forecast, by Application 2019 & 2032
- Table 108: Rest of Europe Construction Chemicals Industry Volume (K Tons) Forecast, by Application 2019 & 2032
- Table 109: Global Construction Chemicals Industry Revenue Million Forecast, by End Use Sector 2019 & 2032
- Table 110: Global Construction Chemicals Industry Volume K Tons Forecast, by End Use Sector 2019 & 2032
- Table 111: Global Construction Chemicals Industry Revenue Million Forecast, by Product 2019 & 2032
- Table 112: Global Construction Chemicals Industry Volume K Tons Forecast, by Product 2019 & 2032
- Table 113: Global Construction Chemicals Industry Revenue Million Forecast, by Country 2019 & 2032
- Table 114: Global Construction Chemicals Industry Volume K Tons Forecast, by Country 2019 & 2032
- Table 115: Turkey Construction Chemicals Industry Revenue (Million) Forecast, by Application 2019 & 2032
- Table 116: Turkey Construction Chemicals Industry Volume (K Tons) Forecast, by Application 2019 & 2032
- Table 117: Israel Construction Chemicals Industry Revenue (Million) Forecast, by Application 2019 & 2032
- Table 118: Israel Construction Chemicals Industry Volume (K Tons) Forecast, by Application 2019 & 2032
- Table 119: GCC Construction Chemicals Industry Revenue (Million) Forecast, by Application 2019 & 2032
- Table 120: GCC Construction Chemicals Industry Volume (K Tons) Forecast, by Application 2019 & 2032
- Table 121: North Africa Construction Chemicals Industry Revenue (Million) Forecast, by Application 2019 & 2032
- Table 122: North Africa Construction Chemicals Industry Volume (K Tons) Forecast, by Application 2019 & 2032
- Table 123: South Africa Construction Chemicals Industry Revenue (Million) Forecast, by Application 2019 & 2032
- Table 124: South Africa Construction Chemicals Industry Volume (K Tons) Forecast, by Application 2019 & 2032
- Table 125: Rest of Middle East & Africa Construction Chemicals Industry Revenue (Million) Forecast, by Application 2019 & 2032
- Table 126: Rest of Middle East & Africa Construction Chemicals Industry Volume (K Tons) Forecast, by Application 2019 & 2032
- Table 127: Global Construction Chemicals Industry Revenue Million Forecast, by End Use Sector 2019 & 2032
- Table 128: Global Construction Chemicals Industry Volume K Tons Forecast, by End Use Sector 2019 & 2032
- Table 129: Global Construction Chemicals Industry Revenue Million Forecast, by Product 2019 & 2032
- Table 130: Global Construction Chemicals Industry Volume K Tons Forecast, by Product 2019 & 2032
- Table 131: Global Construction Chemicals Industry Revenue Million Forecast, by Country 2019 & 2032
- Table 132: Global Construction Chemicals Industry Volume K Tons Forecast, by Country 2019 & 2032
- Table 133: China Construction Chemicals Industry Revenue (Million) Forecast, by Application 2019 & 2032
- Table 134: China Construction Chemicals Industry Volume (K Tons) Forecast, by Application 2019 & 2032
- Table 135: India Construction Chemicals Industry Revenue (Million) Forecast, by Application 2019 & 2032
- Table 136: India Construction Chemicals Industry Volume (K Tons) Forecast, by Application 2019 & 2032
- Table 137: Japan Construction Chemicals Industry Revenue (Million) Forecast, by Application 2019 & 2032
- Table 138: Japan Construction Chemicals Industry Volume (K Tons) Forecast, by Application 2019 & 2032
- Table 139: South Korea Construction Chemicals Industry Revenue (Million) Forecast, by Application 2019 & 2032
- Table 140: South Korea Construction Chemicals Industry Volume (K Tons) Forecast, by Application 2019 & 2032
- Table 141: ASEAN Construction Chemicals Industry Revenue (Million) Forecast, by Application 2019 & 2032
- Table 142: ASEAN Construction Chemicals Industry Volume (K Tons) Forecast, by Application 2019 & 2032
- Table 143: Oceania Construction Chemicals Industry Revenue (Million) Forecast, by Application 2019 & 2032
- Table 144: Oceania Construction Chemicals Industry Volume (K Tons) Forecast, by Application 2019 & 2032
- Table 145: Rest of Asia Pacific Construction Chemicals Industry Revenue (Million) Forecast, by Application 2019 & 2032
- Table 146: Rest of Asia Pacific Construction Chemicals Industry Volume (K Tons) Forecast, by Application 2019 & 2032
Frequently Asked Questions
1. What is the projected Compound Annual Growth Rate (CAGR) of the Construction Chemicals Industry?
The projected CAGR is approximately 3.5%.
2. Which companies are prominent players in the Construction Chemicals Industry?
Key companies in the market include Henkel AG & Co KGaA, Arkema, Saint-Gobain, RPM International Inc, MBCC Group, LATICRETE International Inc, H B Fuller Company, Fosroc Inc, CEMEX S A B de C V, Ardex Group, Sika A, MAPEI S p A, Oriental Yuhong, MC-Bauchemie, Jiangsu Subote New Material Co Ltd.
3. What are the main segments of the Construction Chemicals Industry?
The market segments include End Use Sector, Product.
4. Can you provide details about the market size?
The market size is estimated to be USD XX Million as of 2022.
5. What are some drivers contributing to market growth?
; Banning/ Limiting Use of Plastics used in packaging applications.
6. What are the notable trends driving market growth?
OTHER KEY INDUSTRY TRENDS COVERED IN THE REPORT.
7. Are there any restraints impacting market growth?
; Harmful Amines in Dyes; Paperless Green Initiatives.
8. Can you provide examples of recent developments in the market?
May 2023: Oriental Yuhong signed a strategic cooperation agreement with Hebei Aorun Shunda Group to collaborate on multi-dimensional research in the fields of waterproofing membranes and thermal insulation coatings, among other solutions.May 2023: Sika, a global leader in construction chemicals, acquired the MBCC Group, including its waterproofing solutions, anchors & grouts, flooring resins, repair & rehabilitation chemicals, and other businesses, with the exception of its concrete admixture operations in Europe, North America, Australia, and New Zealand.April 2023: Flowcrete, a subsidiary of RPM International Inc., announced that it has extended the shelf life of its epoxy flooring resin products, which can now be stored for an extra 12 months from the previously specified dates without compromising their quality or performance.
9. What pricing options are available for accessing the report?
Pricing options include single-user, multi-user, and enterprise licenses priced at USD 3800, USD 4500, and USD 5800 respectively.
10. Is the market size provided in terms of value or volume?
The market size is provided in terms of value, measured in Million and volume, measured in K Tons.
11. Are there any specific market keywords associated with the report?
Yes, the market keyword associated with the report is "Construction Chemicals Industry," which aids in identifying and referencing the specific market segment covered.
12. How do I determine which pricing option suits my needs best?
The pricing options vary based on user requirements and access needs. Individual users may opt for single-user licenses, while businesses requiring broader access may choose multi-user or enterprise licenses for cost-effective access to the report.
13. Are there any additional resources or data provided in the Construction Chemicals Industry report?
While the report offers comprehensive insights, it's advisable to review the specific contents or supplementary materials provided to ascertain if additional resources or data are available.
14. How can I stay updated on further developments or reports in the Construction Chemicals Industry?
To stay informed about further developments, trends, and reports in the Construction Chemicals Industry, consider subscribing to industry newsletters, following relevant companies and organizations, or regularly checking reputable industry news sources and publications.
Methodology
Step 1 - Identification of Relevant Samples Size from Population Database


Step 2 - Approaches for Defining Global Market Size (Value, Volume* & Price*)

Note*: In applicable scenarios
Step 3 - Data Sources
Primary Research
- Web Analytics
- Survey Reports
- Research Institute
- Latest Research Reports
- Opinion Leaders
Secondary Research
- Annual Reports
- White Paper
- Latest Press Release
- Industry Association
- Paid Database
- Investor Presentations

Step 4 - Data Triangulation
Involves using different sources of information in order to increase the validity of a study
These sources are likely to be stakeholders in a program - participants, other researchers, program staff, other community members, and so on.
Then we put all data in single framework & apply various statistical tools to find out the dynamic on the market.
During the analysis stage, feedback from the stakeholder groups would be compared to determine areas of agreement as well as areas of divergence
