

Key Insights
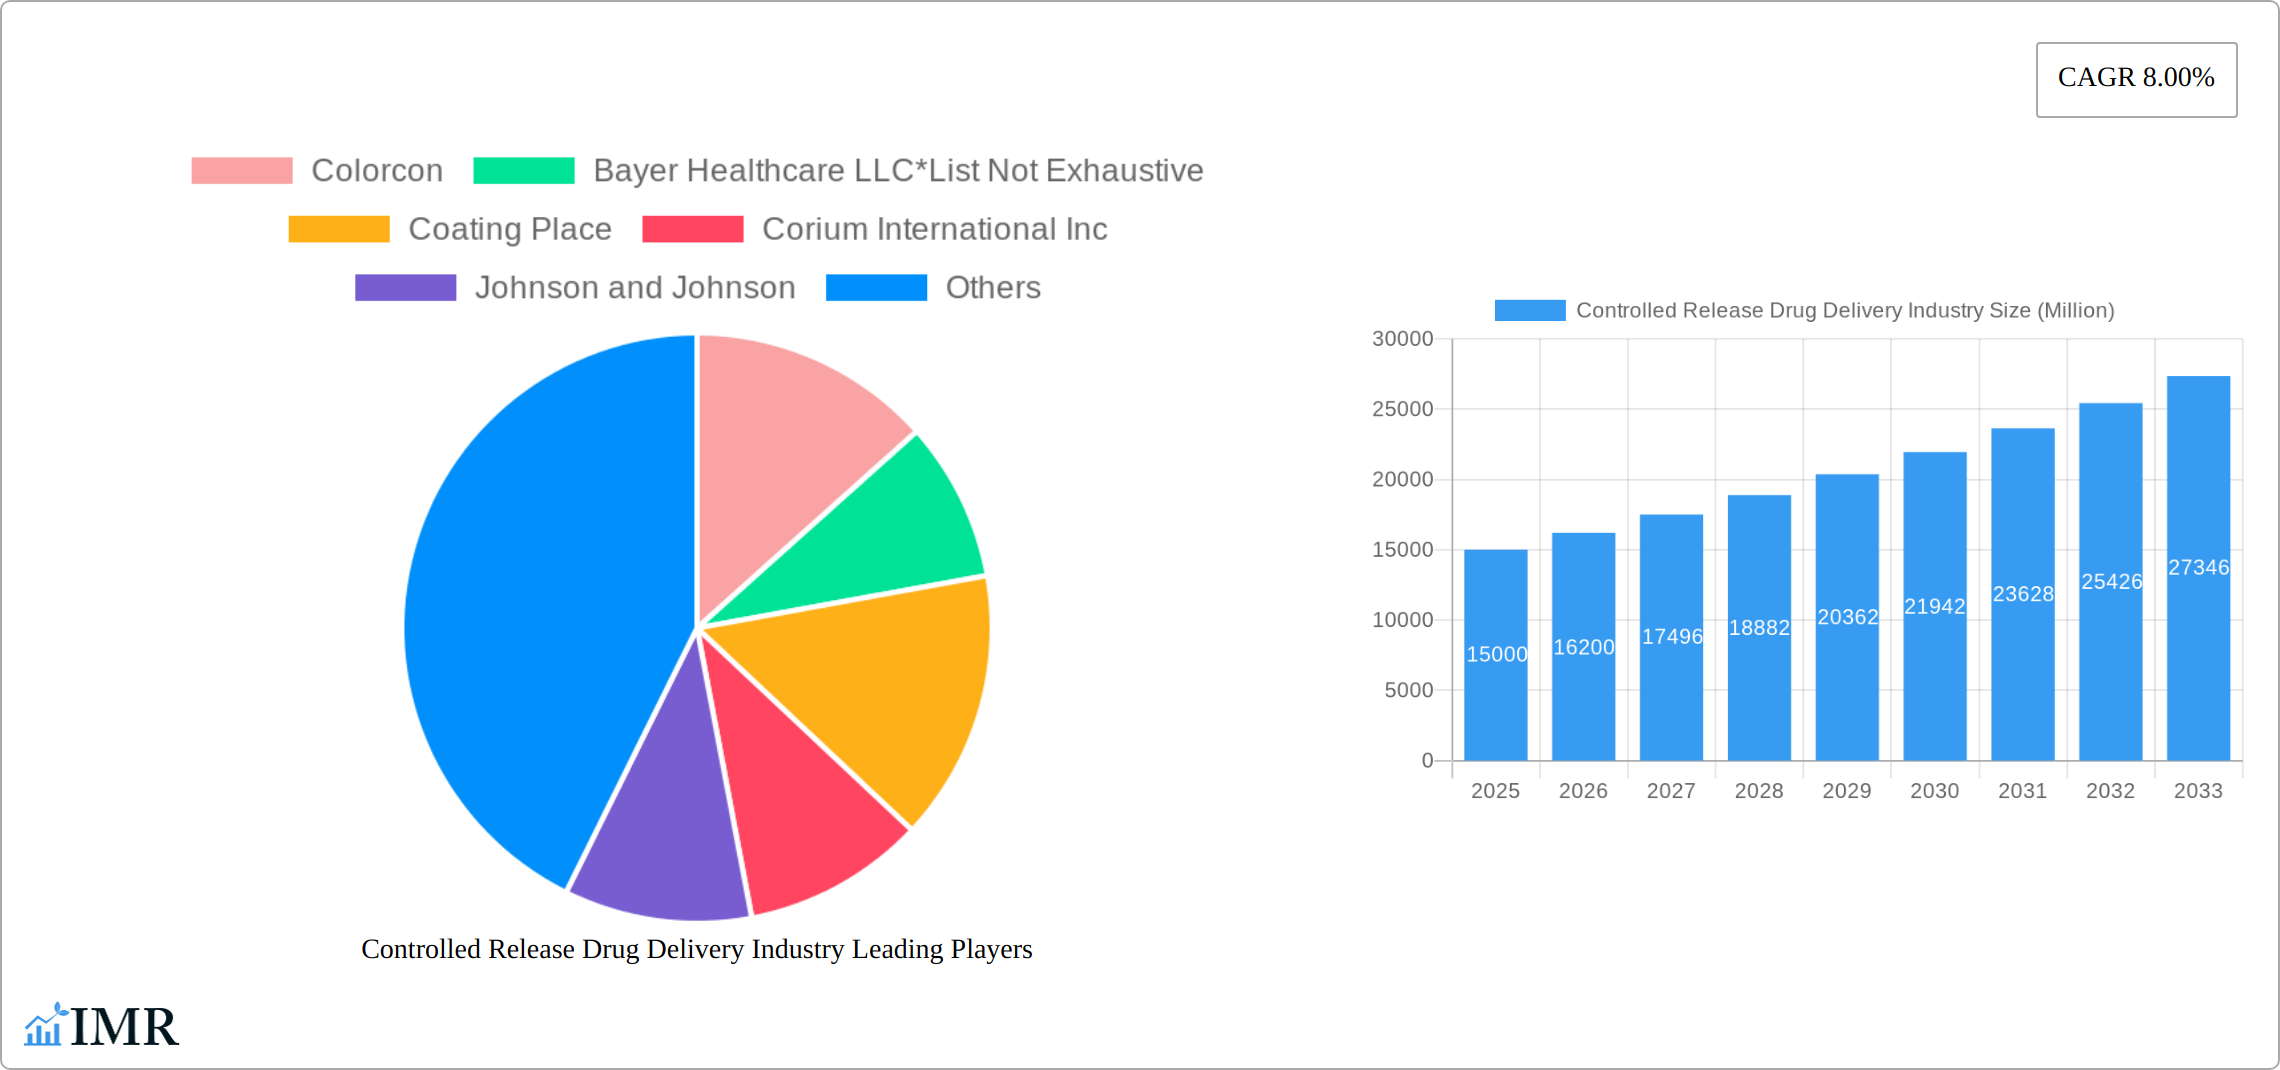
The Controlled Release Drug Delivery (CRDD) market is experiencing robust growth, projected to reach a substantial size over the forecast period (2025-2033). The 8% Compound Annual Growth Rate (CAGR) reflects increasing demand driven by several key factors. The aging global population necessitates more effective and convenient drug administration methods, fueling the adoption of CRDD technologies. Furthermore, the rise in chronic diseases like diabetes and cardiovascular conditions requires long-term medication, making CRDD systems highly advantageous for patient compliance and therapeutic efficacy. Technological advancements in microencapsulation, transdermal patches, and targeted drug delivery are further driving market expansion, offering improved drug bioavailability and reduced side effects. The market segmentation highlights the dominance of certain applications, with metered dose inhalers (MDIs) and injectable systems currently leading, though transdermal and ocular patches are expected to see significant growth due to their non-invasive nature and patient preference. Leading pharmaceutical companies are heavily investing in R&D and strategic partnerships to strengthen their position in this lucrative sector, further stimulating market expansion.
The geographic landscape of the CRDD market shows a strong presence in North America and Europe, driven by advanced healthcare infrastructure and higher per capita healthcare spending. However, the Asia-Pacific region is projected to witness the fastest growth rate, driven by increasing healthcare awareness, rising disposable incomes, and a growing prevalence of chronic diseases in developing economies. Regulatory approvals and reimbursement policies play a crucial role in shaping market dynamics. While the market faces certain restraints, such as stringent regulatory hurdles and the high cost of development and manufacturing, the overall positive outlook driven by technological advancements and unmet medical needs will continue to propel the CRDD market forward in the coming years. This presents a significant opportunity for pharmaceutical companies and technology providers focused on innovation and patient-centric solutions.
Controlled Release Drug Delivery Industry Market Report: 2019-2033
This comprehensive report provides an in-depth analysis of the Controlled Release Drug Delivery industry, encompassing market dynamics, growth trends, regional insights, and key player strategies. With a focus on both parent and child markets, this study offers actionable intelligence for industry professionals, investors, and strategic decision-makers. The report covers the period from 2019 to 2033, with a base year of 2025 and a forecast period spanning 2025-2033. Market values are presented in million units.
Controlled Release Drug Delivery Industry Market Dynamics & Structure
This section analyzes the intricate dynamics of the controlled release drug delivery market, dissecting its competitive landscape, technological advancements, regulatory hurdles, and market trends. The analysis covers:
- Market Concentration: The market exhibits a moderately concentrated structure, with a few major players holding significant market share (estimated at xx%). However, smaller specialized firms are also active, particularly in niche applications.
- Technological Innovation Drivers: Continuous advancements in microencapsulation, transdermal delivery systems, and targeted drug delivery are key drivers. The push for personalized medicine further fuels innovation.
- Regulatory Frameworks: Stringent regulatory approvals and guidelines pose significant challenges, influencing product development timelines and costs. Variations in regulations across different geographies impact market expansion.
- Competitive Product Substitutes: Conventional drug delivery systems pose a competitive threat. However, the advantages of controlled release in terms of efficacy and patient compliance are driving market growth.
- End-User Demographics: The aging global population and the increasing prevalence of chronic diseases are major factors driving market growth. Demand is particularly high in developed regions with advanced healthcare infrastructure.
- M&A Trends: The industry has witnessed a moderate number of M&A activities (xx deals in the past 5 years), primarily driven by larger companies seeking to expand their product portfolios and technological capabilities.
Controlled Release Drug Delivery Industry Growth Trends & Insights
The controlled release drug delivery market experienced substantial growth during the historical period (2019-2024), with a CAGR of xx%. This growth is projected to continue during the forecast period (2025-2033), driven by factors such as technological advancements, increasing demand for personalized medicine, and growing prevalence of chronic diseases. Market penetration for controlled-release formulations is steadily increasing across various therapeutic areas. Technological disruptions, like the rise of nanotechnology in drug delivery, are further accelerating market expansion. Consumer behavior is shifting towards preference for convenient and effective drug delivery methods, which favors controlled-release options. The estimated market size in 2025 is xx million units, projected to reach xx million units by 2033.

Dominant Regions, Countries, or Segments in Controlled Release Drug Delivery Industry
North America currently dominates the controlled release drug delivery market, holding the largest market share (estimated at xx%). This dominance is attributed to factors such as:
- High Healthcare Expenditure: Significant investments in healthcare infrastructure and research & development.
- Strong Regulatory Framework: While stringent, it fosters innovation and ensures quality.
- Early Adoption of New Technologies: North America is a key market for the launch of new controlled-release drug delivery systems.
However, Asia-Pacific is projected to witness the highest CAGR during the forecast period, driven by:
- Rising Disposable Incomes: Increased healthcare spending and greater access to advanced therapies.
- Growing Prevalence of Chronic Diseases: A substantial population base facing conditions like diabetes and cardiovascular diseases.
- Government Initiatives: Policies promoting pharmaceutical innovation and healthcare infrastructure development.
By Technology: Microencapsulation currently holds the largest market share followed by transdermal and targeted delivery systems.
By Application: Injectable and transdermal and ocular patches dominate the application segment, driven by their effectiveness and ease of use.
Controlled Release Drug Delivery Industry Product Landscape
The controlled release drug delivery market features a diverse range of products, including implantable devices, oral formulations, transdermal patches, and inhalers. These products are constantly being refined, with innovations focused on enhancing drug delivery efficiency, improving patient compliance, and minimizing side effects. Key product innovations involve the use of novel biomaterials, advanced coatings, and sophisticated release mechanisms, such as those enabling stimuli-responsive drug release. This innovation translates into unique selling propositions such as extended drug action, reduced dosing frequency, and improved therapeutic outcomes.
Key Drivers, Barriers & Challenges in Controlled Release Drug Delivery Industry
Key Drivers:
- Growing prevalence of chronic diseases: Demand for extended-release formulations to manage chronic conditions.
- Technological advancements: Innovations in microencapsulation, nanotechnology, and biomaterials.
- Favorable regulatory environment (in certain regions): Supportive policies for drug innovation and approval processes.
Key Challenges:
- High Research & Development Costs: Developing new controlled-release formulations is expensive and time-consuming.
- Stringent Regulatory Approvals: Meeting stringent regulatory requirements can delay product launches.
- Intellectual Property Protection: Protecting intellectual property rights in a competitive landscape.
- Supply Chain Disruptions: Global events can impact the availability of raw materials and manufacturing capabilities. (Estimated impact: xx% on production in 2022).
Emerging Opportunities in Controlled Release Drug Delivery Industry
- Personalized medicine: Tailoring drug delivery systems to individual patient needs.
- Combination therapies: Delivering multiple drugs simultaneously via controlled-release systems.
- Wireless controlled drug delivery: Enabling remote monitoring and adjustment of drug release.
- Biodegradable and biocompatible materials: Developing environmentally friendly and safe delivery systems.
Growth Accelerators in the Controlled Release Drug Delivery Industry Industry
Strategic partnerships between pharmaceutical companies and technology providers are accelerating innovation and market expansion. Significant investments in research and development are driving the development of next-generation controlled release systems. The growing adoption of digital technologies, such as connected devices and telehealth, is further enhancing patient care and monitoring.
Key Players Shaping the Controlled Release Drug Delivery Market
- Colorcon
- Bayer Healthcare LLC
- Coating Place
- Corium International Inc
- Johnson and Johnson
- Merck and Co Inc
- Lonza
- Adare Pharma Solutions
- GlaxoSmithKline PLC
Notable Milestones in Controlled Release Drug Delivery Industry Sector
- June 2022: A research study at the University of Michigan demonstrated a new method of drug microencapsulation, improving peptide drug delivery.
- March 2022: Evonik launched Eudratec SoluFlow, a novel microparticle technology enhancing the solubility of active pharmaceutical ingredients. This impacted the development of oral therapeutics for various diseases.
In-Depth Controlled Release Drug Delivery Industry Market Outlook
The future of the controlled release drug delivery market is bright, propelled by ongoing technological advancements and the growing demand for efficient and personalized drug therapies. Strategic partnerships and investments in R&D will continue to shape market dynamics, creating significant opportunities for innovative companies. The market's expansion will be driven by emerging applications, such as targeted drug delivery for cancer treatment, improved transdermal patches for chronic disease management, and personalized inhalers. This will lead to sustained growth and market expansion throughout the forecast period.
Controlled Release Drug Delivery Industry Segmentation
-
1. Technology
- 1.1. Micro Encapsulation
- 1.2. Transdermal
- 1.3. Targeted Delivery
- 1.4. Other Technologies
-
2. Application
- 2.1. Metered Dose Inhalers
- 2.2. Injectable
- 2.3. Transdermal and Ocular Patches
- 2.4. Other Applications
Controlled Release Drug Delivery Industry Segmentation By Geography
-
1. North America
- 1.1. United States
- 1.2. Canada
- 1.3. Mexico
-
2. Europe
- 2.1. Germany
- 2.2. United Kingdom
- 2.3. France
- 2.4. Italy
- 2.5. Spain
- 2.6. Rest of Europe
-
3. Asia Pacific
- 3.1. China
- 3.2. Japan
- 3.3. India
- 3.4. Australia
- 3.5. South Korea
- 3.6. Rest of Asia Pacific
-
4. Middle East and Africa
- 4.1. GCC
- 4.2. South Africa
- 4.3. Rest of Middle East and Africa
-
5. South America
- 5.1. Brazil
- 5.2. Argentina
- 5.3. Rest of South America

Controlled Release Drug Delivery Industry REPORT HIGHLIGHTS
| Aspects | Details |
|---|---|
| Study Period | 2019-2033 |
| Base Year | 2024 |
| Estimated Year | 2025 |
| Forecast Period | 2025-2033 |
| Historical Period | 2019-2024 |
| Growth Rate | CAGR of 8.00% from 2019-2033 |
| Segmentation |
|
Table of Contents
- 1. Introduction
- 1.1. Research Scope
- 1.2. Market Segmentation
- 1.3. Research Methodology
- 1.4. Definitions and Assumptions
- 2. Executive Summary
- 2.1. Introduction
- 3. Market Dynamics
- 3.1. Introduction
- 3.2. Market Drivers
- 3.2.1. Rise in Incidence of Chronic diseases; Growing Geriatric and Pediatric Population
- 3.3. Market Restrains
- 3.3.1. Higher Cost Compared to the Conventional Method
- 3.4. Market Trends
- 3.4.1. The Targeted Delivery Segment is Expected to Hold a Major Market Share in the Controlled Release Drug Delivery Market.
- 4. Market Factor Analysis
- 4.1. Porters Five Forces
- 4.2. Supply/Value Chain
- 4.3. PESTEL analysis
- 4.4. Market Entropy
- 4.5. Patent/Trademark Analysis
- 5. Global Controlled Release Drug Delivery Industry Analysis, Insights and Forecast, 2019-2031
- 5.1. Market Analysis, Insights and Forecast - by Technology
- 5.1.1. Micro Encapsulation
- 5.1.2. Transdermal
- 5.1.3. Targeted Delivery
- 5.1.4. Other Technologies
- 5.2. Market Analysis, Insights and Forecast - by Application
- 5.2.1. Metered Dose Inhalers
- 5.2.2. Injectable
- 5.2.3. Transdermal and Ocular Patches
- 5.2.4. Other Applications
- 5.3. Market Analysis, Insights and Forecast - by Region
- 5.3.1. North America
- 5.3.2. Europe
- 5.3.3. Asia Pacific
- 5.3.4. Middle East and Africa
- 5.3.5. South America
- 5.1. Market Analysis, Insights and Forecast - by Technology
- 6. North America Controlled Release Drug Delivery Industry Analysis, Insights and Forecast, 2019-2031
- 6.1. Market Analysis, Insights and Forecast - by Technology
- 6.1.1. Micro Encapsulation
- 6.1.2. Transdermal
- 6.1.3. Targeted Delivery
- 6.1.4. Other Technologies
- 6.2. Market Analysis, Insights and Forecast - by Application
- 6.2.1. Metered Dose Inhalers
- 6.2.2. Injectable
- 6.2.3. Transdermal and Ocular Patches
- 6.2.4. Other Applications
- 6.1. Market Analysis, Insights and Forecast - by Technology
- 7. Europe Controlled Release Drug Delivery Industry Analysis, Insights and Forecast, 2019-2031
- 7.1. Market Analysis, Insights and Forecast - by Technology
- 7.1.1. Micro Encapsulation
- 7.1.2. Transdermal
- 7.1.3. Targeted Delivery
- 7.1.4. Other Technologies
- 7.2. Market Analysis, Insights and Forecast - by Application
- 7.2.1. Metered Dose Inhalers
- 7.2.2. Injectable
- 7.2.3. Transdermal and Ocular Patches
- 7.2.4. Other Applications
- 7.1. Market Analysis, Insights and Forecast - by Technology
- 8. Asia Pacific Controlled Release Drug Delivery Industry Analysis, Insights and Forecast, 2019-2031
- 8.1. Market Analysis, Insights and Forecast - by Technology
- 8.1.1. Micro Encapsulation
- 8.1.2. Transdermal
- 8.1.3. Targeted Delivery
- 8.1.4. Other Technologies
- 8.2. Market Analysis, Insights and Forecast - by Application
- 8.2.1. Metered Dose Inhalers
- 8.2.2. Injectable
- 8.2.3. Transdermal and Ocular Patches
- 8.2.4. Other Applications
- 8.1. Market Analysis, Insights and Forecast - by Technology
- 9. Middle East and Africa Controlled Release Drug Delivery Industry Analysis, Insights and Forecast, 2019-2031
- 9.1. Market Analysis, Insights and Forecast - by Technology
- 9.1.1. Micro Encapsulation
- 9.1.2. Transdermal
- 9.1.3. Targeted Delivery
- 9.1.4. Other Technologies
- 9.2. Market Analysis, Insights and Forecast - by Application
- 9.2.1. Metered Dose Inhalers
- 9.2.2. Injectable
- 9.2.3. Transdermal and Ocular Patches
- 9.2.4. Other Applications
- 9.1. Market Analysis, Insights and Forecast - by Technology
- 10. South America Controlled Release Drug Delivery Industry Analysis, Insights and Forecast, 2019-2031
- 10.1. Market Analysis, Insights and Forecast - by Technology
- 10.1.1. Micro Encapsulation
- 10.1.2. Transdermal
- 10.1.3. Targeted Delivery
- 10.1.4. Other Technologies
- 10.2. Market Analysis, Insights and Forecast - by Application
- 10.2.1. Metered Dose Inhalers
- 10.2.2. Injectable
- 10.2.3. Transdermal and Ocular Patches
- 10.2.4. Other Applications
- 10.1. Market Analysis, Insights and Forecast - by Technology
- 11. North America Controlled Release Drug Delivery Industry Analysis, Insights and Forecast, 2019-2031
- 11.1. Market Analysis, Insights and Forecast - By Country/Sub-region
- 11.1.1 United States
- 11.1.2 Canada
- 11.1.3 Mexico
- 12. Europe Controlled Release Drug Delivery Industry Analysis, Insights and Forecast, 2019-2031
- 12.1. Market Analysis, Insights and Forecast - By Country/Sub-region
- 12.1.1 Germany
- 12.1.2 United Kingdom
- 12.1.3 France
- 12.1.4 Italy
- 12.1.5 Spain
- 12.1.6 Rest of Europe
- 13. Asia Pacific Controlled Release Drug Delivery Industry Analysis, Insights and Forecast, 2019-2031
- 13.1. Market Analysis, Insights and Forecast - By Country/Sub-region
- 13.1.1 China
- 13.1.2 Japan
- 13.1.3 India
- 13.1.4 Australia
- 13.1.5 South Korea
- 13.1.6 Rest of Asia Pacific
- 14. Middle East and Africa Controlled Release Drug Delivery Industry Analysis, Insights and Forecast, 2019-2031
- 14.1. Market Analysis, Insights and Forecast - By Country/Sub-region
- 14.1.1 GCC
- 14.1.2 South Africa
- 14.1.3 Rest of Middle East and Africa
- 15. South America Controlled Release Drug Delivery Industry Analysis, Insights and Forecast, 2019-2031
- 15.1. Market Analysis, Insights and Forecast - By Country/Sub-region
- 15.1.1 Brazil
- 15.1.2 Argentina
- 15.1.3 Rest of South America
- 16. Competitive Analysis
- 16.1. Global Market Share Analysis 2024
- 16.2. Company Profiles
- 16.2.1 Colorcon
- 16.2.1.1. Overview
- 16.2.1.2. Products
- 16.2.1.3. SWOT Analysis
- 16.2.1.4. Recent Developments
- 16.2.1.5. Financials (Based on Availability)
- 16.2.2 Bayer Healthcare LLC*List Not Exhaustive
- 16.2.2.1. Overview
- 16.2.2.2. Products
- 16.2.2.3. SWOT Analysis
- 16.2.2.4. Recent Developments
- 16.2.2.5. Financials (Based on Availability)
- 16.2.3 Coating Place
- 16.2.3.1. Overview
- 16.2.3.2. Products
- 16.2.3.3. SWOT Analysis
- 16.2.3.4. Recent Developments
- 16.2.3.5. Financials (Based on Availability)
- 16.2.4 Corium International Inc
- 16.2.4.1. Overview
- 16.2.4.2. Products
- 16.2.4.3. SWOT Analysis
- 16.2.4.4. Recent Developments
- 16.2.4.5. Financials (Based on Availability)
- 16.2.5 Johnson and Johnson
- 16.2.5.1. Overview
- 16.2.5.2. Products
- 16.2.5.3. SWOT Analysis
- 16.2.5.4. Recent Developments
- 16.2.5.5. Financials (Based on Availability)
- 16.2.6 Merck and Co Inc
- 16.2.6.1. Overview
- 16.2.6.2. Products
- 16.2.6.3. SWOT Analysis
- 16.2.6.4. Recent Developments
- 16.2.6.5. Financials (Based on Availability)
- 16.2.7 Lonza
- 16.2.7.1. Overview
- 16.2.7.2. Products
- 16.2.7.3. SWOT Analysis
- 16.2.7.4. Recent Developments
- 16.2.7.5. Financials (Based on Availability)
- 16.2.8 Adare Pharma Solutions
- 16.2.8.1. Overview
- 16.2.8.2. Products
- 16.2.8.3. SWOT Analysis
- 16.2.8.4. Recent Developments
- 16.2.8.5. Financials (Based on Availability)
- 16.2.9 GlaxoSmithKline PLC
- 16.2.9.1. Overview
- 16.2.9.2. Products
- 16.2.9.3. SWOT Analysis
- 16.2.9.4. Recent Developments
- 16.2.9.5. Financials (Based on Availability)
- 16.2.1 Colorcon
List of Figures
- Figure 1: Global Controlled Release Drug Delivery Industry Revenue Breakdown (Million, %) by Region 2024 & 2032
- Figure 2: North America Controlled Release Drug Delivery Industry Revenue (Million), by Country 2024 & 2032
- Figure 3: North America Controlled Release Drug Delivery Industry Revenue Share (%), by Country 2024 & 2032
- Figure 4: Europe Controlled Release Drug Delivery Industry Revenue (Million), by Country 2024 & 2032
- Figure 5: Europe Controlled Release Drug Delivery Industry Revenue Share (%), by Country 2024 & 2032
- Figure 6: Asia Pacific Controlled Release Drug Delivery Industry Revenue (Million), by Country 2024 & 2032
- Figure 7: Asia Pacific Controlled Release Drug Delivery Industry Revenue Share (%), by Country 2024 & 2032
- Figure 8: Middle East and Africa Controlled Release Drug Delivery Industry Revenue (Million), by Country 2024 & 2032
- Figure 9: Middle East and Africa Controlled Release Drug Delivery Industry Revenue Share (%), by Country 2024 & 2032
- Figure 10: South America Controlled Release Drug Delivery Industry Revenue (Million), by Country 2024 & 2032
- Figure 11: South America Controlled Release Drug Delivery Industry Revenue Share (%), by Country 2024 & 2032
- Figure 12: North America Controlled Release Drug Delivery Industry Revenue (Million), by Technology 2024 & 2032
- Figure 13: North America Controlled Release Drug Delivery Industry Revenue Share (%), by Technology 2024 & 2032
- Figure 14: North America Controlled Release Drug Delivery Industry Revenue (Million), by Application 2024 & 2032
- Figure 15: North America Controlled Release Drug Delivery Industry Revenue Share (%), by Application 2024 & 2032
- Figure 16: North America Controlled Release Drug Delivery Industry Revenue (Million), by Country 2024 & 2032
- Figure 17: North America Controlled Release Drug Delivery Industry Revenue Share (%), by Country 2024 & 2032
- Figure 18: Europe Controlled Release Drug Delivery Industry Revenue (Million), by Technology 2024 & 2032
- Figure 19: Europe Controlled Release Drug Delivery Industry Revenue Share (%), by Technology 2024 & 2032
- Figure 20: Europe Controlled Release Drug Delivery Industry Revenue (Million), by Application 2024 & 2032
- Figure 21: Europe Controlled Release Drug Delivery Industry Revenue Share (%), by Application 2024 & 2032
- Figure 22: Europe Controlled Release Drug Delivery Industry Revenue (Million), by Country 2024 & 2032
- Figure 23: Europe Controlled Release Drug Delivery Industry Revenue Share (%), by Country 2024 & 2032
- Figure 24: Asia Pacific Controlled Release Drug Delivery Industry Revenue (Million), by Technology 2024 & 2032
- Figure 25: Asia Pacific Controlled Release Drug Delivery Industry Revenue Share (%), by Technology 2024 & 2032
- Figure 26: Asia Pacific Controlled Release Drug Delivery Industry Revenue (Million), by Application 2024 & 2032
- Figure 27: Asia Pacific Controlled Release Drug Delivery Industry Revenue Share (%), by Application 2024 & 2032
- Figure 28: Asia Pacific Controlled Release Drug Delivery Industry Revenue (Million), by Country 2024 & 2032
- Figure 29: Asia Pacific Controlled Release Drug Delivery Industry Revenue Share (%), by Country 2024 & 2032
- Figure 30: Middle East and Africa Controlled Release Drug Delivery Industry Revenue (Million), by Technology 2024 & 2032
- Figure 31: Middle East and Africa Controlled Release Drug Delivery Industry Revenue Share (%), by Technology 2024 & 2032
- Figure 32: Middle East and Africa Controlled Release Drug Delivery Industry Revenue (Million), by Application 2024 & 2032
- Figure 33: Middle East and Africa Controlled Release Drug Delivery Industry Revenue Share (%), by Application 2024 & 2032
- Figure 34: Middle East and Africa Controlled Release Drug Delivery Industry Revenue (Million), by Country 2024 & 2032
- Figure 35: Middle East and Africa Controlled Release Drug Delivery Industry Revenue Share (%), by Country 2024 & 2032
- Figure 36: South America Controlled Release Drug Delivery Industry Revenue (Million), by Technology 2024 & 2032
- Figure 37: South America Controlled Release Drug Delivery Industry Revenue Share (%), by Technology 2024 & 2032
- Figure 38: South America Controlled Release Drug Delivery Industry Revenue (Million), by Application 2024 & 2032
- Figure 39: South America Controlled Release Drug Delivery Industry Revenue Share (%), by Application 2024 & 2032
- Figure 40: South America Controlled Release Drug Delivery Industry Revenue (Million), by Country 2024 & 2032
- Figure 41: South America Controlled Release Drug Delivery Industry Revenue Share (%), by Country 2024 & 2032
List of Tables
- Table 1: Global Controlled Release Drug Delivery Industry Revenue Million Forecast, by Region 2019 & 2032
- Table 2: Global Controlled Release Drug Delivery Industry Revenue Million Forecast, by Technology 2019 & 2032
- Table 3: Global Controlled Release Drug Delivery Industry Revenue Million Forecast, by Application 2019 & 2032
- Table 4: Global Controlled Release Drug Delivery Industry Revenue Million Forecast, by Region 2019 & 2032
- Table 5: Global Controlled Release Drug Delivery Industry Revenue Million Forecast, by Country 2019 & 2032
- Table 6: United States Controlled Release Drug Delivery Industry Revenue (Million) Forecast, by Application 2019 & 2032
- Table 7: Canada Controlled Release Drug Delivery Industry Revenue (Million) Forecast, by Application 2019 & 2032
- Table 8: Mexico Controlled Release Drug Delivery Industry Revenue (Million) Forecast, by Application 2019 & 2032
- Table 9: Global Controlled Release Drug Delivery Industry Revenue Million Forecast, by Country 2019 & 2032
- Table 10: Germany Controlled Release Drug Delivery Industry Revenue (Million) Forecast, by Application 2019 & 2032
- Table 11: United Kingdom Controlled Release Drug Delivery Industry Revenue (Million) Forecast, by Application 2019 & 2032
- Table 12: France Controlled Release Drug Delivery Industry Revenue (Million) Forecast, by Application 2019 & 2032
- Table 13: Italy Controlled Release Drug Delivery Industry Revenue (Million) Forecast, by Application 2019 & 2032
- Table 14: Spain Controlled Release Drug Delivery Industry Revenue (Million) Forecast, by Application 2019 & 2032
- Table 15: Rest of Europe Controlled Release Drug Delivery Industry Revenue (Million) Forecast, by Application 2019 & 2032
- Table 16: Global Controlled Release Drug Delivery Industry Revenue Million Forecast, by Country 2019 & 2032
- Table 17: China Controlled Release Drug Delivery Industry Revenue (Million) Forecast, by Application 2019 & 2032
- Table 18: Japan Controlled Release Drug Delivery Industry Revenue (Million) Forecast, by Application 2019 & 2032
- Table 19: India Controlled Release Drug Delivery Industry Revenue (Million) Forecast, by Application 2019 & 2032
- Table 20: Australia Controlled Release Drug Delivery Industry Revenue (Million) Forecast, by Application 2019 & 2032
- Table 21: South Korea Controlled Release Drug Delivery Industry Revenue (Million) Forecast, by Application 2019 & 2032
- Table 22: Rest of Asia Pacific Controlled Release Drug Delivery Industry Revenue (Million) Forecast, by Application 2019 & 2032
- Table 23: Global Controlled Release Drug Delivery Industry Revenue Million Forecast, by Country 2019 & 2032
- Table 24: GCC Controlled Release Drug Delivery Industry Revenue (Million) Forecast, by Application 2019 & 2032
- Table 25: South Africa Controlled Release Drug Delivery Industry Revenue (Million) Forecast, by Application 2019 & 2032
- Table 26: Rest of Middle East and Africa Controlled Release Drug Delivery Industry Revenue (Million) Forecast, by Application 2019 & 2032
- Table 27: Global Controlled Release Drug Delivery Industry Revenue Million Forecast, by Country 2019 & 2032
- Table 28: Brazil Controlled Release Drug Delivery Industry Revenue (Million) Forecast, by Application 2019 & 2032
- Table 29: Argentina Controlled Release Drug Delivery Industry Revenue (Million) Forecast, by Application 2019 & 2032
- Table 30: Rest of South America Controlled Release Drug Delivery Industry Revenue (Million) Forecast, by Application 2019 & 2032
- Table 31: Global Controlled Release Drug Delivery Industry Revenue Million Forecast, by Technology 2019 & 2032
- Table 32: Global Controlled Release Drug Delivery Industry Revenue Million Forecast, by Application 2019 & 2032
- Table 33: Global Controlled Release Drug Delivery Industry Revenue Million Forecast, by Country 2019 & 2032
- Table 34: United States Controlled Release Drug Delivery Industry Revenue (Million) Forecast, by Application 2019 & 2032
- Table 35: Canada Controlled Release Drug Delivery Industry Revenue (Million) Forecast, by Application 2019 & 2032
- Table 36: Mexico Controlled Release Drug Delivery Industry Revenue (Million) Forecast, by Application 2019 & 2032
- Table 37: Global Controlled Release Drug Delivery Industry Revenue Million Forecast, by Technology 2019 & 2032
- Table 38: Global Controlled Release Drug Delivery Industry Revenue Million Forecast, by Application 2019 & 2032
- Table 39: Global Controlled Release Drug Delivery Industry Revenue Million Forecast, by Country 2019 & 2032
- Table 40: Germany Controlled Release Drug Delivery Industry Revenue (Million) Forecast, by Application 2019 & 2032
- Table 41: United Kingdom Controlled Release Drug Delivery Industry Revenue (Million) Forecast, by Application 2019 & 2032
- Table 42: France Controlled Release Drug Delivery Industry Revenue (Million) Forecast, by Application 2019 & 2032
- Table 43: Italy Controlled Release Drug Delivery Industry Revenue (Million) Forecast, by Application 2019 & 2032
- Table 44: Spain Controlled Release Drug Delivery Industry Revenue (Million) Forecast, by Application 2019 & 2032
- Table 45: Rest of Europe Controlled Release Drug Delivery Industry Revenue (Million) Forecast, by Application 2019 & 2032
- Table 46: Global Controlled Release Drug Delivery Industry Revenue Million Forecast, by Technology 2019 & 2032
- Table 47: Global Controlled Release Drug Delivery Industry Revenue Million Forecast, by Application 2019 & 2032
- Table 48: Global Controlled Release Drug Delivery Industry Revenue Million Forecast, by Country 2019 & 2032
- Table 49: China Controlled Release Drug Delivery Industry Revenue (Million) Forecast, by Application 2019 & 2032
- Table 50: Japan Controlled Release Drug Delivery Industry Revenue (Million) Forecast, by Application 2019 & 2032
- Table 51: India Controlled Release Drug Delivery Industry Revenue (Million) Forecast, by Application 2019 & 2032
- Table 52: Australia Controlled Release Drug Delivery Industry Revenue (Million) Forecast, by Application 2019 & 2032
- Table 53: South Korea Controlled Release Drug Delivery Industry Revenue (Million) Forecast, by Application 2019 & 2032
- Table 54: Rest of Asia Pacific Controlled Release Drug Delivery Industry Revenue (Million) Forecast, by Application 2019 & 2032
- Table 55: Global Controlled Release Drug Delivery Industry Revenue Million Forecast, by Technology 2019 & 2032
- Table 56: Global Controlled Release Drug Delivery Industry Revenue Million Forecast, by Application 2019 & 2032
- Table 57: Global Controlled Release Drug Delivery Industry Revenue Million Forecast, by Country 2019 & 2032
- Table 58: GCC Controlled Release Drug Delivery Industry Revenue (Million) Forecast, by Application 2019 & 2032
- Table 59: South Africa Controlled Release Drug Delivery Industry Revenue (Million) Forecast, by Application 2019 & 2032
- Table 60: Rest of Middle East and Africa Controlled Release Drug Delivery Industry Revenue (Million) Forecast, by Application 2019 & 2032
- Table 61: Global Controlled Release Drug Delivery Industry Revenue Million Forecast, by Technology 2019 & 2032
- Table 62: Global Controlled Release Drug Delivery Industry Revenue Million Forecast, by Application 2019 & 2032
- Table 63: Global Controlled Release Drug Delivery Industry Revenue Million Forecast, by Country 2019 & 2032
- Table 64: Brazil Controlled Release Drug Delivery Industry Revenue (Million) Forecast, by Application 2019 & 2032
- Table 65: Argentina Controlled Release Drug Delivery Industry Revenue (Million) Forecast, by Application 2019 & 2032
- Table 66: Rest of South America Controlled Release Drug Delivery Industry Revenue (Million) Forecast, by Application 2019 & 2032
Frequently Asked Questions
1. What is the projected Compound Annual Growth Rate (CAGR) of the Controlled Release Drug Delivery Industry?
The projected CAGR is approximately 8.00%.
2. Which companies are prominent players in the Controlled Release Drug Delivery Industry?
Key companies in the market include Colorcon, Bayer Healthcare LLC*List Not Exhaustive, Coating Place, Corium International Inc, Johnson and Johnson, Merck and Co Inc, Lonza, Adare Pharma Solutions, GlaxoSmithKline PLC.
3. What are the main segments of the Controlled Release Drug Delivery Industry?
The market segments include Technology, Application.
4. Can you provide details about the market size?
The market size is estimated to be USD XX Million as of 2022.
5. What are some drivers contributing to market growth?
Rise in Incidence of Chronic diseases; Growing Geriatric and Pediatric Population.
6. What are the notable trends driving market growth?
The Targeted Delivery Segment is Expected to Hold a Major Market Share in the Controlled Release Drug Delivery Market..
7. Are there any restraints impacting market growth?
Higher Cost Compared to the Conventional Method.
8. Can you provide examples of recent developments in the market?
June 2022: A research study was conducted at the University of Michigan that demonstrated a new method of drug microencapsulation, allowing several peptide drugs to be slowly released into the body.
9. What pricing options are available for accessing the report?
Pricing options include single-user, multi-user, and enterprise licenses priced at USD 4750, USD 5250, and USD 8750 respectively.
10. Is the market size provided in terms of value or volume?
The market size is provided in terms of value, measured in Million.
11. Are there any specific market keywords associated with the report?
Yes, the market keyword associated with the report is "Controlled Release Drug Delivery Industry," which aids in identifying and referencing the specific market segment covered.
12. How do I determine which pricing option suits my needs best?
The pricing options vary based on user requirements and access needs. Individual users may opt for single-user licenses, while businesses requiring broader access may choose multi-user or enterprise licenses for cost-effective access to the report.
13. Are there any additional resources or data provided in the Controlled Release Drug Delivery Industry report?
While the report offers comprehensive insights, it's advisable to review the specific contents or supplementary materials provided to ascertain if additional resources or data are available.
14. How can I stay updated on further developments or reports in the Controlled Release Drug Delivery Industry?
To stay informed about further developments, trends, and reports in the Controlled Release Drug Delivery Industry, consider subscribing to industry newsletters, following relevant companies and organizations, or regularly checking reputable industry news sources and publications.
Methodology
Step 1 - Identification of Relevant Samples Size from Population Database


Step 2 - Approaches for Defining Global Market Size (Value, Volume* & Price*)

Note*: In applicable scenarios
Step 3 - Data Sources
Primary Research
- Web Analytics
- Survey Reports
- Research Institute
- Latest Research Reports
- Opinion Leaders
Secondary Research
- Annual Reports
- White Paper
- Latest Press Release
- Industry Association
- Paid Database
- Investor Presentations

Step 4 - Data Triangulation
Involves using different sources of information in order to increase the validity of a study
These sources are likely to be stakeholders in a program - participants, other researchers, program staff, other community members, and so on.
Then we put all data in single framework & apply various statistical tools to find out the dynamic on the market.
During the analysis stage, feedback from the stakeholder groups would be compared to determine areas of agreement as well as areas of divergence
