

Key Insights
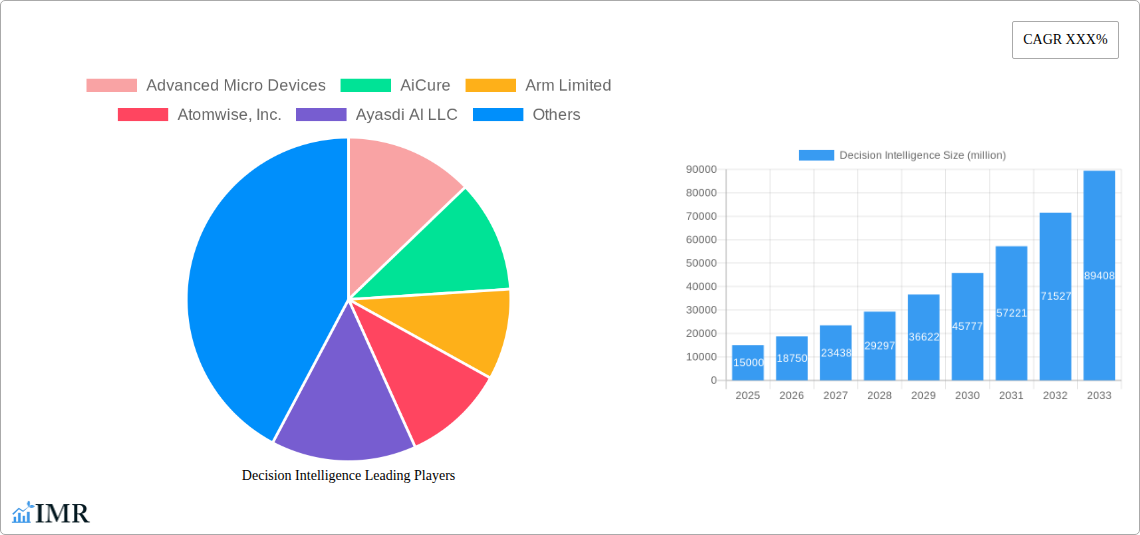
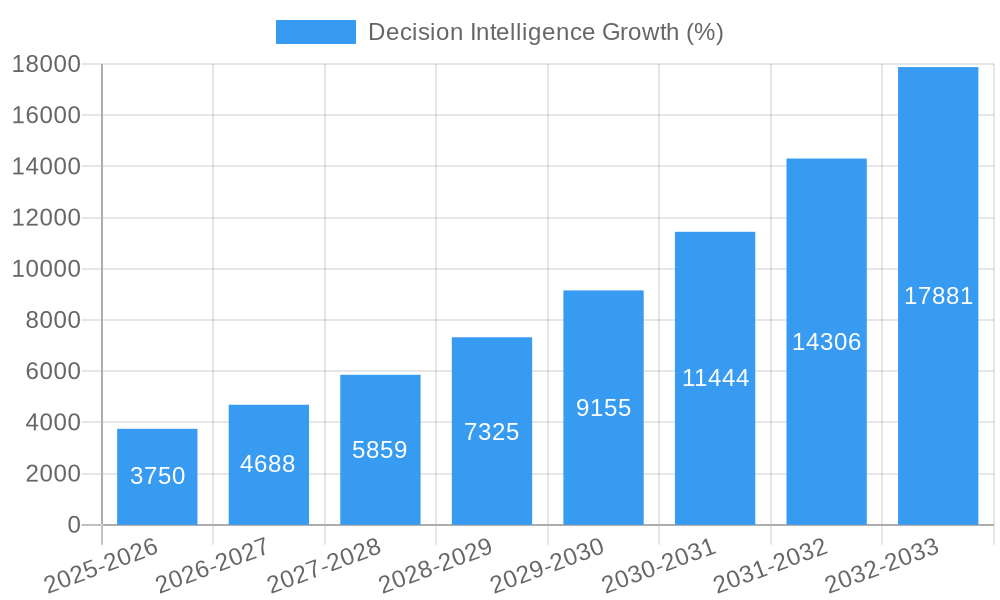
The Decision Intelligence market is experiencing robust growth, driven by the increasing adoption of artificial intelligence (AI) and machine learning (ML) across diverse industries. Businesses are increasingly recognizing the value of data-driven decision-making to improve operational efficiency, enhance customer experience, and gain a competitive edge. The market is fueled by the availability of large datasets, advancements in computational power, and the development of sophisticated analytical tools capable of processing complex information and providing actionable insights. Key drivers include the need for improved forecasting accuracy, risk mitigation, and personalized experiences. The integration of Decision Intelligence solutions with existing business systems, such as CRM and ERP, further accelerates adoption. While the market is fragmented with numerous players, including established tech giants and specialized startups, the emergence of cloud-based solutions is simplifying deployment and reducing costs, leading to wider accessibility. We estimate the 2025 market size to be approximately $15 billion, with a Compound Annual Growth Rate (CAGR) of 25% projected through 2033. This signifies substantial market expansion in the coming years.
Significant trends shaping the Decision Intelligence market include the increasing demand for explainable AI (XAI), ensuring transparency and trust in AI-driven decisions. Furthermore, the rise of edge computing allows for faster processing and real-time insights, crucial for time-sensitive applications. The development of more sophisticated algorithms capable of handling unstructured data, including text and images, is also widening the applicability of Decision Intelligence. Potential restraints include data privacy concerns, the need for skilled professionals to implement and manage these systems, and the ongoing challenge of integrating AI solutions seamlessly into existing workflows. The diverse range of companies involved, including both large established corporations and innovative startups, underscores the dynamic and competitive nature of this rapidly evolving market.
Decision Intelligence Market Report: 2019-2033
This comprehensive report provides a detailed analysis of the Decision Intelligence market, encompassing market dynamics, growth trends, regional segmentation, product landscape, key players, and future outlook. The study period covers 2019-2033, with 2025 as the base and estimated year. The forecast period is 2025-2033, and the historical period is 2019-2024. This report is invaluable for industry professionals, investors, and strategic decision-makers seeking to understand and capitalize on opportunities within this rapidly evolving market. The total market size is predicted to reach xx million by 2033.
Decision Intelligence Market Dynamics & Structure
This section analyzes the Decision Intelligence market's competitive landscape, technological advancements, regulatory environment, and market forces. The market is characterized by a dynamic interplay of established tech giants and emerging specialized companies.
- Market Concentration: The market exhibits a moderately concentrated structure, with a few major players holding significant market share, though a large number of niche players are also active. The top 5 players account for approximately 60% of the market in 2025 (estimated).
- Technological Innovation Drivers: AI advancements, especially in machine learning and deep learning, are primary drivers. The increasing availability of big data and improved computational power further fuel innovation.
- Regulatory Frameworks: Data privacy regulations (GDPR, CCPA) significantly impact market development, necessitating robust data security and compliance measures. Government initiatives promoting AI adoption also play a role.
- Competitive Product Substitutes: Traditional business intelligence tools and analytics platforms pose some competition, though Decision Intelligence solutions offer superior predictive and prescriptive capabilities.
- End-User Demographics: The primary end-users span diverse sectors, including finance, healthcare, manufacturing, and retail, with increasing adoption across all industries.
- M&A Trends: The Decision Intelligence sector has witnessed a significant number of mergers and acquisitions (M&A) deals in the historical period, with an average of xx deals per year, driven by the consolidation of technologies and market expansion strategies.
Decision Intelligence Growth Trends & Insights
Leveraging extensive primary and secondary research, this section presents a detailed analysis of market size evolution, technological disruptions, and changing consumer behavior. The Decision Intelligence market exhibits a robust Compound Annual Growth Rate (CAGR) of xx% during the forecast period (2025-2033), driven by increasing demand for data-driven decision-making and improved AI capabilities. Market penetration is projected to reach xx% by 2033. Key trends influencing growth include the rising adoption of cloud-based solutions, the increasing demand for real-time insights, and the growing adoption of AI across various industries. The shift towards proactive decision-making, aided by predictive analytics capabilities, is further boosting market expansion. The total market value is estimated to reach xx million in 2025 and xx million by 2033.
Dominant Regions, Countries, or Segments in Decision Intelligence
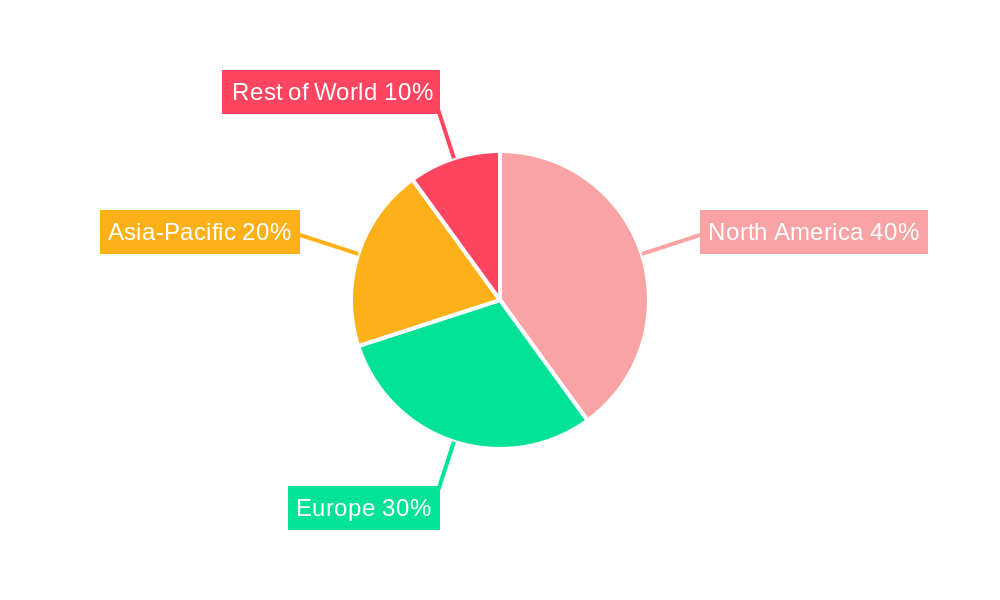
North America currently holds the largest market share, owing to the presence of major technology companies, a strong focus on technological innovation, and a relatively mature adoption rate of AI solutions. However, the Asia-Pacific region is projected to experience the highest growth rate during the forecast period, driven by increasing digitalization, government initiatives, and expanding investments in the technology sector.
- North America: Strong technological advancement, high adoption rates, and significant investments in AI research and development.
- Europe: Stringent data privacy regulations and high regulatory scrutiny slightly slow down adoption but still offer considerable growth.
- Asia-Pacific: Rapid digitalization, rising investments in AI infrastructure, and a growing number of technology startups fuel market growth.
- Rest of the World: Emerging economies demonstrate a moderate growth rate, driven by increasing adoption of advanced technologies and the availability of cost-effective solutions.
Decision Intelligence Product Landscape
Decision Intelligence solutions encompass a range of products and services, including predictive analytics platforms, prescriptive analytics tools, AI-powered decision support systems, and consulting services. These solutions are characterized by their ability to process vast amounts of data, extract actionable insights, and provide recommendations for optimal decision-making. Recent innovations focus on enhancing the explainability of AI models, improving user experience, and integrating with existing enterprise systems. Key features include automation of decision-making processes and real-time insights delivery.
Key Drivers, Barriers & Challenges in Decision Intelligence
Key Drivers: Increased availability of data, advancements in AI and machine learning, growing demand for data-driven decision-making across industries, increasing adoption of cloud computing and related technologies.
Key Barriers & Challenges: Data security and privacy concerns, lack of skilled professionals, high implementation costs, integration complexities, and ethical considerations surrounding AI-driven decision-making. The cost of implementation remains a significant barrier for smaller companies, limiting market penetration. Supply chain disruptions can also impact the timely delivery of solutions.
Emerging Opportunities in Decision Intelligence
Untapped markets in developing economies, increasing application in niche industries (e.g., precision agriculture, personalized medicine), integration with IoT devices and edge computing, and the development of explainable AI models present significant opportunities for growth. Further expansion into sectors like supply chain optimization and risk management is also promising. The development of decision intelligence solutions for smaller businesses offers a significant untapped opportunity.
Growth Accelerators in the Decision Intelligence Industry
Technological breakthroughs in AI, particularly in areas like reinforcement learning and natural language processing, are driving long-term growth. Strategic partnerships between technology companies and industry players are facilitating wider adoption. Expanding the accessibility and ease of use of AI-driven solutions further accelerates the market’s expansion.
Key Players Shaping the Decision Intelligence Market
- Advanced Micro Devices
- AiCure
- Arm Limited
- Atomwise, Inc.
- Ayasdi AI LLC
- Baidu, Inc.
- Clarifai, Inc
- Circadia Health
- Enlitic, Inc.
- Google LLC
- H2O.ai.
- HyperVerge, Inc.
- IBM
- Intel Corporation
- Iris.ai AS.
- Lifegraph
- Microsoft
- NVIDIA Corporation
- Sensely, Inc.
- Verdis
- Zebra Medical Vision, Inc.
Notable Milestones in Decision Intelligence Sector
- 2020: Increased investment in AI-driven decision support systems across various sectors.
- 2021: Several major technology companies launch new Decision Intelligence platforms.
- 2022: Growing adoption of explainable AI to address ethical concerns and improve transparency.
- 2023: Focus shifts towards real-time decision-making and edge computing capabilities.
- 2024: Increased emphasis on data security and privacy compliance.
In-Depth Decision Intelligence Market Outlook
The Decision Intelligence market is poised for continued strong growth, driven by ongoing technological advancements, expanding applications across diverse industries, and increasing demand for data-driven decision-making. Strategic partnerships, investments in research and development, and the development of user-friendly solutions will further fuel market expansion, creating lucrative opportunities for both established players and new entrants. The market’s future trajectory is bright, indicating substantial growth potential in the coming years.
Decision Intelligence Segmentation
-
1. Application
- 1.1. BFSI
- 1.2. Healthcare
- 1.3. Media and Entertainment
- 1.4. Retail
- 1.5. Transportation
- 1.6. Others
-
2. Type
- 2.1. Human-Based
- 2.2. Hybrid-Based
- 2.3. Machine-Based
Decision Intelligence Segmentation By Geography
-
1. North America
- 1.1. United States
- 1.2. Canada
- 1.3. Mexico
-
2. South America
- 2.1. Brazil
- 2.2. Argentina
- 2.3. Rest of South America
-
3. Europe
- 3.1. United Kingdom
- 3.2. Germany
- 3.3. France
- 3.4. Italy
- 3.5. Spain
- 3.6. Russia
- 3.7. Benelux
- 3.8. Nordics
- 3.9. Rest of Europe
-
4. Middle East & Africa
- 4.1. Turkey
- 4.2. Israel
- 4.3. GCC
- 4.4. North Africa
- 4.5. South Africa
- 4.6. Rest of Middle East & Africa
-
5. Asia Pacific
- 5.1. China
- 5.2. India
- 5.3. Japan
- 5.4. South Korea
- 5.5. ASEAN
- 5.6. Oceania
- 5.7. Rest of Asia Pacific
Decision Intelligence REPORT HIGHLIGHTS
| Aspects | Details |
|---|---|
| Study Period | 2019-2033 |
| Base Year | 2024 |
| Estimated Year | 2025 |
| Forecast Period | 2025-2033 |
| Historical Period | 2019-2024 |
| Growth Rate | CAGR of XXX% from 2019-2033 |
| Segmentation |
|
Table of Contents
- 1. Introduction
- 1.1. Research Scope
- 1.2. Market Segmentation
- 1.3. Research Methodology
- 1.4. Definitions and Assumptions
- 2. Executive Summary
- 2.1. Introduction
- 3. Market Dynamics
- 3.1. Introduction
- 3.2. Market Drivers
- 3.3. Market Restrains
- 3.4. Market Trends
- 4. Market Factor Analysis
- 4.1. Porters Five Forces
- 4.2. Supply/Value Chain
- 4.3. PESTEL analysis
- 4.4. Market Entropy
- 4.5. Patent/Trademark Analysis
- 5. Global Decision Intelligence Analysis, Insights and Forecast, 2019-2031
- 5.1. Market Analysis, Insights and Forecast - by Application
- 5.1.1. BFSI
- 5.1.2. Healthcare
- 5.1.3. Media and Entertainment
- 5.1.4. Retail
- 5.1.5. Transportation
- 5.1.6. Others
- 5.2. Market Analysis, Insights and Forecast - by Type
- 5.2.1. Human-Based
- 5.2.2. Hybrid-Based
- 5.2.3. Machine-Based
- 5.3. Market Analysis, Insights and Forecast - by Region
- 5.3.1. North America
- 5.3.2. South America
- 5.3.3. Europe
- 5.3.4. Middle East & Africa
- 5.3.5. Asia Pacific
- 5.1. Market Analysis, Insights and Forecast - by Application
- 6. North America Decision Intelligence Analysis, Insights and Forecast, 2019-2031
- 6.1. Market Analysis, Insights and Forecast - by Application
- 6.1.1. BFSI
- 6.1.2. Healthcare
- 6.1.3. Media and Entertainment
- 6.1.4. Retail
- 6.1.5. Transportation
- 6.1.6. Others
- 6.2. Market Analysis, Insights and Forecast - by Type
- 6.2.1. Human-Based
- 6.2.2. Hybrid-Based
- 6.2.3. Machine-Based
- 6.1. Market Analysis, Insights and Forecast - by Application
- 7. South America Decision Intelligence Analysis, Insights and Forecast, 2019-2031
- 7.1. Market Analysis, Insights and Forecast - by Application
- 7.1.1. BFSI
- 7.1.2. Healthcare
- 7.1.3. Media and Entertainment
- 7.1.4. Retail
- 7.1.5. Transportation
- 7.1.6. Others
- 7.2. Market Analysis, Insights and Forecast - by Type
- 7.2.1. Human-Based
- 7.2.2. Hybrid-Based
- 7.2.3. Machine-Based
- 7.1. Market Analysis, Insights and Forecast - by Application
- 8. Europe Decision Intelligence Analysis, Insights and Forecast, 2019-2031
- 8.1. Market Analysis, Insights and Forecast - by Application
- 8.1.1. BFSI
- 8.1.2. Healthcare
- 8.1.3. Media and Entertainment
- 8.1.4. Retail
- 8.1.5. Transportation
- 8.1.6. Others
- 8.2. Market Analysis, Insights and Forecast - by Type
- 8.2.1. Human-Based
- 8.2.2. Hybrid-Based
- 8.2.3. Machine-Based
- 8.1. Market Analysis, Insights and Forecast - by Application
- 9. Middle East & Africa Decision Intelligence Analysis, Insights and Forecast, 2019-2031
- 9.1. Market Analysis, Insights and Forecast - by Application
- 9.1.1. BFSI
- 9.1.2. Healthcare
- 9.1.3. Media and Entertainment
- 9.1.4. Retail
- 9.1.5. Transportation
- 9.1.6. Others
- 9.2. Market Analysis, Insights and Forecast - by Type
- 9.2.1. Human-Based
- 9.2.2. Hybrid-Based
- 9.2.3. Machine-Based
- 9.1. Market Analysis, Insights and Forecast - by Application
- 10. Asia Pacific Decision Intelligence Analysis, Insights and Forecast, 2019-2031
- 10.1. Market Analysis, Insights and Forecast - by Application
- 10.1.1. BFSI
- 10.1.2. Healthcare
- 10.1.3. Media and Entertainment
- 10.1.4. Retail
- 10.1.5. Transportation
- 10.1.6. Others
- 10.2. Market Analysis, Insights and Forecast - by Type
- 10.2.1. Human-Based
- 10.2.2. Hybrid-Based
- 10.2.3. Machine-Based
- 10.1. Market Analysis, Insights and Forecast - by Application
- 11. Competitive Analysis
- 11.1. Global Market Share Analysis 2024
- 11.2. Company Profiles
- 11.2.1 Advanced Micro Devices
- 11.2.1.1. Overview
- 11.2.1.2. Products
- 11.2.1.3. SWOT Analysis
- 11.2.1.4. Recent Developments
- 11.2.1.5. Financials (Based on Availability)
- 11.2.2 AiCure
- 11.2.2.1. Overview
- 11.2.2.2. Products
- 11.2.2.3. SWOT Analysis
- 11.2.2.4. Recent Developments
- 11.2.2.5. Financials (Based on Availability)
- 11.2.3 Arm Limited
- 11.2.3.1. Overview
- 11.2.3.2. Products
- 11.2.3.3. SWOT Analysis
- 11.2.3.4. Recent Developments
- 11.2.3.5. Financials (Based on Availability)
- 11.2.4 Atomwise Inc.
- 11.2.4.1. Overview
- 11.2.4.2. Products
- 11.2.4.3. SWOT Analysis
- 11.2.4.4. Recent Developments
- 11.2.4.5. Financials (Based on Availability)
- 11.2.5 Ayasdi AI LLC
- 11.2.5.1. Overview
- 11.2.5.2. Products
- 11.2.5.3. SWOT Analysis
- 11.2.5.4. Recent Developments
- 11.2.5.5. Financials (Based on Availability)
- 11.2.6 Baidu Inc.
- 11.2.6.1. Overview
- 11.2.6.2. Products
- 11.2.6.3. SWOT Analysis
- 11.2.6.4. Recent Developments
- 11.2.6.5. Financials (Based on Availability)
- 11.2.7 Clarifai Inc
- 11.2.7.1. Overview
- 11.2.7.2. Products
- 11.2.7.3. SWOT Analysis
- 11.2.7.4. Recent Developments
- 11.2.7.5. Financials (Based on Availability)
- 11.2.8 Cyrcadia Health
- 11.2.8.1. Overview
- 11.2.8.2. Products
- 11.2.8.3. SWOT Analysis
- 11.2.8.4. Recent Developments
- 11.2.8.5. Financials (Based on Availability)
- 11.2.9 Enlitic Inc.
- 11.2.9.1. Overview
- 11.2.9.2. Products
- 11.2.9.3. SWOT Analysis
- 11.2.9.4. Recent Developments
- 11.2.9.5. Financials (Based on Availability)
- 11.2.10 Google LLC
- 11.2.10.1. Overview
- 11.2.10.2. Products
- 11.2.10.3. SWOT Analysis
- 11.2.10.4. Recent Developments
- 11.2.10.5. Financials (Based on Availability)
- 11.2.11 H2O.ai.
- 11.2.11.1. Overview
- 11.2.11.2. Products
- 11.2.11.3. SWOT Analysis
- 11.2.11.4. Recent Developments
- 11.2.11.5. Financials (Based on Availability)
- 11.2.12 HyperVerge Inc.
- 11.2.12.1. Overview
- 11.2.12.2. Products
- 11.2.12.3. SWOT Analysis
- 11.2.12.4. Recent Developments
- 11.2.12.5. Financials (Based on Availability)
- 11.2.13 IBM
- 11.2.13.1. Overview
- 11.2.13.2. Products
- 11.2.13.3. SWOT Analysis
- 11.2.13.4. Recent Developments
- 11.2.13.5. Financials (Based on Availability)
- 11.2.14 Intel Corporation
- 11.2.14.1. Overview
- 11.2.14.2. Products
- 11.2.14.3. SWOT Analysis
- 11.2.14.4. Recent Developments
- 11.2.14.5. Financials (Based on Availability)
- 11.2.15 Iris.ai AS.
- 11.2.15.1. Overview
- 11.2.15.2. Products
- 11.2.15.3. SWOT Analysis
- 11.2.15.4. Recent Developments
- 11.2.15.5. Financials (Based on Availability)
- 11.2.16 Lifegraph
- 11.2.16.1. Overview
- 11.2.16.2. Products
- 11.2.16.3. SWOT Analysis
- 11.2.16.4. Recent Developments
- 11.2.16.5. Financials (Based on Availability)
- 11.2.17 Microsoft
- 11.2.17.1. Overview
- 11.2.17.2. Products
- 11.2.17.3. SWOT Analysis
- 11.2.17.4. Recent Developments
- 11.2.17.5. Financials (Based on Availability)
- 11.2.18 NVIDIA Corporation
- 11.2.18.1. Overview
- 11.2.18.2. Products
- 11.2.18.3. SWOT Analysis
- 11.2.18.4. Recent Developments
- 11.2.18.5. Financials (Based on Availability)
- 11.2.19 Sensely Inc.
- 11.2.19.1. Overview
- 11.2.19.2. Products
- 11.2.19.3. SWOT Analysis
- 11.2.19.4. Recent Developments
- 11.2.19.5. Financials (Based on Availability)
- 11.2.20 Verdis
- 11.2.20.1. Overview
- 11.2.20.2. Products
- 11.2.20.3. SWOT Analysis
- 11.2.20.4. Recent Developments
- 11.2.20.5. Financials (Based on Availability)
- 11.2.21 Zebra Medical Vision Inc.
- 11.2.21.1. Overview
- 11.2.21.2. Products
- 11.2.21.3. SWOT Analysis
- 11.2.21.4. Recent Developments
- 11.2.21.5. Financials (Based on Availability)
- 11.2.1 Advanced Micro Devices
List of Figures
- Figure 1: Global Decision Intelligence Revenue Breakdown (million, %) by Region 2024 & 2032
- Figure 2: North America Decision Intelligence Revenue (million), by Application 2024 & 2032
- Figure 3: North America Decision Intelligence Revenue Share (%), by Application 2024 & 2032
- Figure 4: North America Decision Intelligence Revenue (million), by Type 2024 & 2032
- Figure 5: North America Decision Intelligence Revenue Share (%), by Type 2024 & 2032
- Figure 6: North America Decision Intelligence Revenue (million), by Country 2024 & 2032
- Figure 7: North America Decision Intelligence Revenue Share (%), by Country 2024 & 2032
- Figure 8: South America Decision Intelligence Revenue (million), by Application 2024 & 2032
- Figure 9: South America Decision Intelligence Revenue Share (%), by Application 2024 & 2032
- Figure 10: South America Decision Intelligence Revenue (million), by Type 2024 & 2032
- Figure 11: South America Decision Intelligence Revenue Share (%), by Type 2024 & 2032
- Figure 12: South America Decision Intelligence Revenue (million), by Country 2024 & 2032
- Figure 13: South America Decision Intelligence Revenue Share (%), by Country 2024 & 2032
- Figure 14: Europe Decision Intelligence Revenue (million), by Application 2024 & 2032
- Figure 15: Europe Decision Intelligence Revenue Share (%), by Application 2024 & 2032
- Figure 16: Europe Decision Intelligence Revenue (million), by Type 2024 & 2032
- Figure 17: Europe Decision Intelligence Revenue Share (%), by Type 2024 & 2032
- Figure 18: Europe Decision Intelligence Revenue (million), by Country 2024 & 2032
- Figure 19: Europe Decision Intelligence Revenue Share (%), by Country 2024 & 2032
- Figure 20: Middle East & Africa Decision Intelligence Revenue (million), by Application 2024 & 2032
- Figure 21: Middle East & Africa Decision Intelligence Revenue Share (%), by Application 2024 & 2032
- Figure 22: Middle East & Africa Decision Intelligence Revenue (million), by Type 2024 & 2032
- Figure 23: Middle East & Africa Decision Intelligence Revenue Share (%), by Type 2024 & 2032
- Figure 24: Middle East & Africa Decision Intelligence Revenue (million), by Country 2024 & 2032
- Figure 25: Middle East & Africa Decision Intelligence Revenue Share (%), by Country 2024 & 2032
- Figure 26: Asia Pacific Decision Intelligence Revenue (million), by Application 2024 & 2032
- Figure 27: Asia Pacific Decision Intelligence Revenue Share (%), by Application 2024 & 2032
- Figure 28: Asia Pacific Decision Intelligence Revenue (million), by Type 2024 & 2032
- Figure 29: Asia Pacific Decision Intelligence Revenue Share (%), by Type 2024 & 2032
- Figure 30: Asia Pacific Decision Intelligence Revenue (million), by Country 2024 & 2032
- Figure 31: Asia Pacific Decision Intelligence Revenue Share (%), by Country 2024 & 2032
List of Tables
- Table 1: Global Decision Intelligence Revenue million Forecast, by Region 2019 & 2032
- Table 2: Global Decision Intelligence Revenue million Forecast, by Application 2019 & 2032
- Table 3: Global Decision Intelligence Revenue million Forecast, by Type 2019 & 2032
- Table 4: Global Decision Intelligence Revenue million Forecast, by Region 2019 & 2032
- Table 5: Global Decision Intelligence Revenue million Forecast, by Application 2019 & 2032
- Table 6: Global Decision Intelligence Revenue million Forecast, by Type 2019 & 2032
- Table 7: Global Decision Intelligence Revenue million Forecast, by Country 2019 & 2032
- Table 8: United States Decision Intelligence Revenue (million) Forecast, by Application 2019 & 2032
- Table 9: Canada Decision Intelligence Revenue (million) Forecast, by Application 2019 & 2032
- Table 10: Mexico Decision Intelligence Revenue (million) Forecast, by Application 2019 & 2032
- Table 11: Global Decision Intelligence Revenue million Forecast, by Application 2019 & 2032
- Table 12: Global Decision Intelligence Revenue million Forecast, by Type 2019 & 2032
- Table 13: Global Decision Intelligence Revenue million Forecast, by Country 2019 & 2032
- Table 14: Brazil Decision Intelligence Revenue (million) Forecast, by Application 2019 & 2032
- Table 15: Argentina Decision Intelligence Revenue (million) Forecast, by Application 2019 & 2032
- Table 16: Rest of South America Decision Intelligence Revenue (million) Forecast, by Application 2019 & 2032
- Table 17: Global Decision Intelligence Revenue million Forecast, by Application 2019 & 2032
- Table 18: Global Decision Intelligence Revenue million Forecast, by Type 2019 & 2032
- Table 19: Global Decision Intelligence Revenue million Forecast, by Country 2019 & 2032
- Table 20: United Kingdom Decision Intelligence Revenue (million) Forecast, by Application 2019 & 2032
- Table 21: Germany Decision Intelligence Revenue (million) Forecast, by Application 2019 & 2032
- Table 22: France Decision Intelligence Revenue (million) Forecast, by Application 2019 & 2032
- Table 23: Italy Decision Intelligence Revenue (million) Forecast, by Application 2019 & 2032
- Table 24: Spain Decision Intelligence Revenue (million) Forecast, by Application 2019 & 2032
- Table 25: Russia Decision Intelligence Revenue (million) Forecast, by Application 2019 & 2032
- Table 26: Benelux Decision Intelligence Revenue (million) Forecast, by Application 2019 & 2032
- Table 27: Nordics Decision Intelligence Revenue (million) Forecast, by Application 2019 & 2032
- Table 28: Rest of Europe Decision Intelligence Revenue (million) Forecast, by Application 2019 & 2032
- Table 29: Global Decision Intelligence Revenue million Forecast, by Application 2019 & 2032
- Table 30: Global Decision Intelligence Revenue million Forecast, by Type 2019 & 2032
- Table 31: Global Decision Intelligence Revenue million Forecast, by Country 2019 & 2032
- Table 32: Turkey Decision Intelligence Revenue (million) Forecast, by Application 2019 & 2032
- Table 33: Israel Decision Intelligence Revenue (million) Forecast, by Application 2019 & 2032
- Table 34: GCC Decision Intelligence Revenue (million) Forecast, by Application 2019 & 2032
- Table 35: North Africa Decision Intelligence Revenue (million) Forecast, by Application 2019 & 2032
- Table 36: South Africa Decision Intelligence Revenue (million) Forecast, by Application 2019 & 2032
- Table 37: Rest of Middle East & Africa Decision Intelligence Revenue (million) Forecast, by Application 2019 & 2032
- Table 38: Global Decision Intelligence Revenue million Forecast, by Application 2019 & 2032
- Table 39: Global Decision Intelligence Revenue million Forecast, by Type 2019 & 2032
- Table 40: Global Decision Intelligence Revenue million Forecast, by Country 2019 & 2032
- Table 41: China Decision Intelligence Revenue (million) Forecast, by Application 2019 & 2032
- Table 42: India Decision Intelligence Revenue (million) Forecast, by Application 2019 & 2032
- Table 43: Japan Decision Intelligence Revenue (million) Forecast, by Application 2019 & 2032
- Table 44: South Korea Decision Intelligence Revenue (million) Forecast, by Application 2019 & 2032
- Table 45: ASEAN Decision Intelligence Revenue (million) Forecast, by Application 2019 & 2032
- Table 46: Oceania Decision Intelligence Revenue (million) Forecast, by Application 2019 & 2032
- Table 47: Rest of Asia Pacific Decision Intelligence Revenue (million) Forecast, by Application 2019 & 2032
Frequently Asked Questions
1. What is the projected Compound Annual Growth Rate (CAGR) of the Decision Intelligence?
The projected CAGR is approximately XXX%.
2. Which companies are prominent players in the Decision Intelligence?
Key companies in the market include Advanced Micro Devices, AiCure, Arm Limited, Atomwise, Inc., Ayasdi AI LLC, Baidu, Inc., Clarifai, Inc, Cyrcadia Health, Enlitic, Inc., Google LLC, H2O.ai., HyperVerge, Inc., IBM, Intel Corporation, Iris.ai AS., Lifegraph, Microsoft, NVIDIA Corporation, Sensely, Inc., Verdis, Zebra Medical Vision, Inc..
3. What are the main segments of the Decision Intelligence?
The market segments include Application, Type.
4. Can you provide details about the market size?
The market size is estimated to be USD XXX million as of 2022.
5. What are some drivers contributing to market growth?
N/A
6. What are the notable trends driving market growth?
N/A
7. Are there any restraints impacting market growth?
N/A
8. Can you provide examples of recent developments in the market?
N/A
9. What pricing options are available for accessing the report?
Pricing options include single-user, multi-user, and enterprise licenses priced at USD 2900.00, USD 4350.00, and USD 5800.00 respectively.
10. Is the market size provided in terms of value or volume?
The market size is provided in terms of value, measured in million.
11. Are there any specific market keywords associated with the report?
Yes, the market keyword associated with the report is "Decision Intelligence," which aids in identifying and referencing the specific market segment covered.
12. How do I determine which pricing option suits my needs best?
The pricing options vary based on user requirements and access needs. Individual users may opt for single-user licenses, while businesses requiring broader access may choose multi-user or enterprise licenses for cost-effective access to the report.
13. Are there any additional resources or data provided in the Decision Intelligence report?
While the report offers comprehensive insights, it's advisable to review the specific contents or supplementary materials provided to ascertain if additional resources or data are available.
14. How can I stay updated on further developments or reports in the Decision Intelligence?
To stay informed about further developments, trends, and reports in the Decision Intelligence, consider subscribing to industry newsletters, following relevant companies and organizations, or regularly checking reputable industry news sources and publications.
Methodology
Step 1 - Identification of Relevant Samples Size from Population Database


Step 2 - Approaches for Defining Global Market Size (Value, Volume* & Price*)

Note*: In applicable scenarios
Step 3 - Data Sources
Primary Research
- Web Analytics
- Survey Reports
- Research Institute
- Latest Research Reports
- Opinion Leaders
Secondary Research
- Annual Reports
- White Paper
- Latest Press Release
- Industry Association
- Paid Database
- Investor Presentations

Step 4 - Data Triangulation
Involves using different sources of information in order to increase the validity of a study
These sources are likely to be stakeholders in a program - participants, other researchers, program staff, other community members, and so on.
Then we put all data in single framework & apply various statistical tools to find out the dynamic on the market.
During the analysis stage, feedback from the stakeholder groups would be compared to determine areas of agreement as well as areas of divergence
