

Key Insights
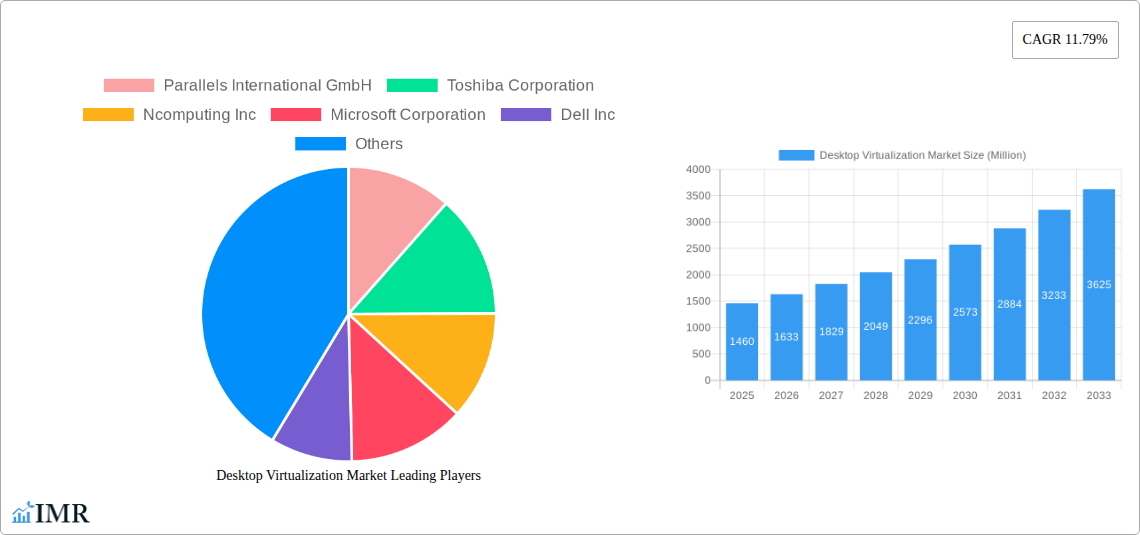
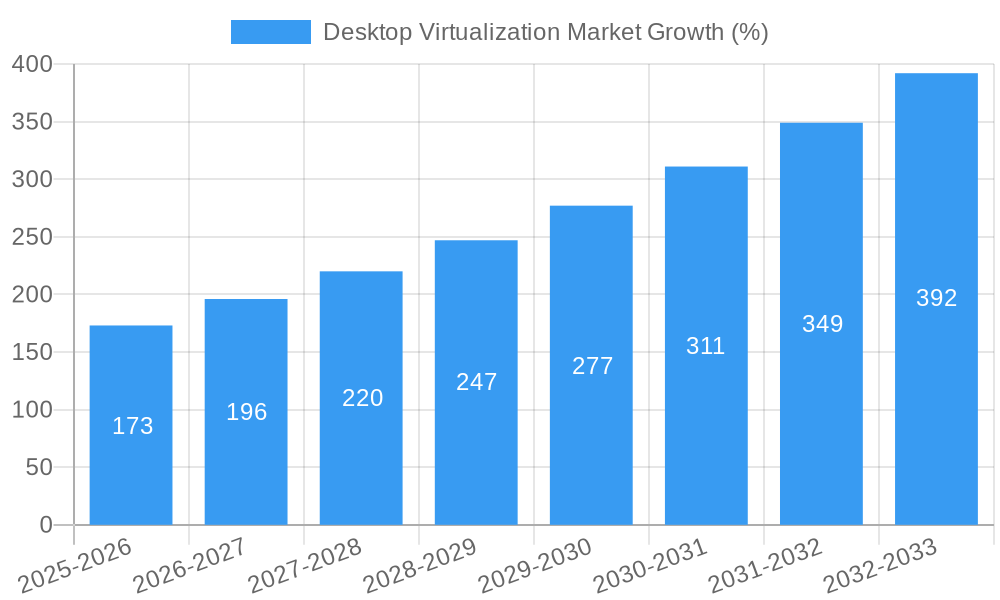
The global Desktop Virtualization market is experiencing robust growth, projected to reach $1.46 billion in 2025 and maintain a Compound Annual Growth Rate (CAGR) of 11.79% from 2025 to 2033. This expansion is driven by several key factors. The increasing adoption of cloud computing and the rise of remote work models are significantly boosting demand for secure and flexible access to applications and data. Businesses are increasingly prioritizing cost optimization and improved IT management, leading to wider acceptance of desktop virtualization solutions. Furthermore, enhanced security features offered by these solutions, protecting sensitive data from cyber threats, contribute to market growth. The market is segmented by delivery platform (Hosted Virtual Desktop (HVD) and Hosted Shared Desktop (HSD)) and deployment mode (on-premise and cloud), with cloud deployment witnessing faster adoption due to its scalability and cost-effectiveness. The competitive landscape comprises established players like Citrix, VMware, and Microsoft, alongside other significant contributors such as Parallels, Dell, and Huawei. These companies are actively investing in research and development to enhance their offerings, introducing advanced features such as artificial intelligence (AI) for enhanced performance and security.
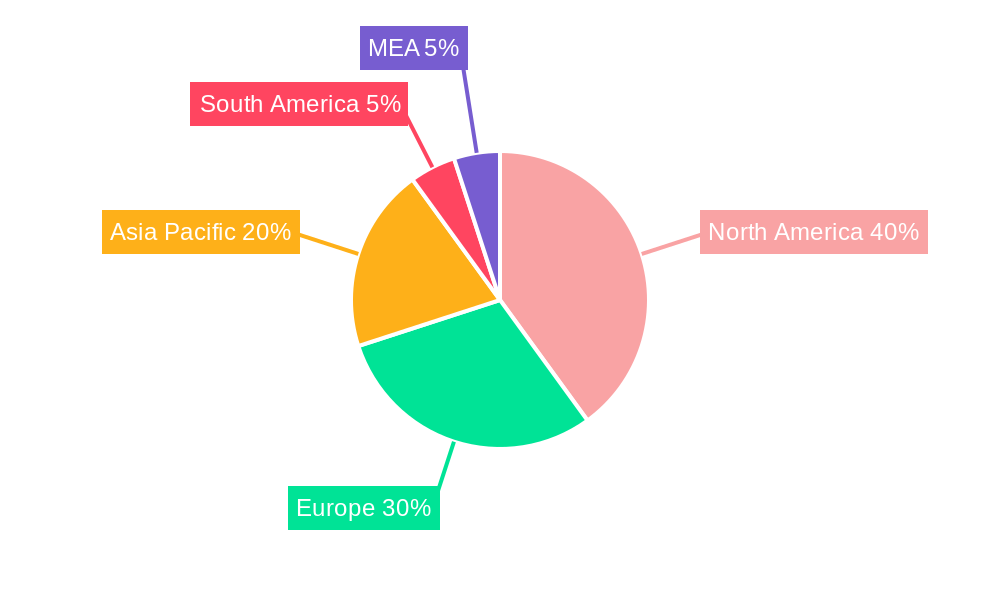
Regional growth is expected to vary. North America currently holds a substantial market share, driven by early adoption and a well-established IT infrastructure. However, regions like Asia-Pacific are poised for rapid growth, fueled by increasing digitalization and expanding IT budgets across various sectors. Europe is also expected to witness steady growth, driven by the increasing adoption of cloud-based solutions and stringent data privacy regulations. The market's future trajectory is influenced by factors such as technological advancements in virtualization technologies, the growing adoption of 5G networks, and the continuous evolution of cybersecurity threats. These trends will shape future investment and innovation within the desktop virtualization market, leading to further market expansion in the coming years.
Desktop Virtualization Market: A Comprehensive Report (2019-2033)
This in-depth report provides a comprehensive analysis of the Desktop Virtualization Market, encompassing market dynamics, growth trends, regional dominance, product landscape, key players, and future outlook. The study period covers 2019-2033, with 2025 as the base and estimated year. The report segments the market by Desktop delivery platform (Hosted Virtual Desktop (HVD), Hosted Shared Desktop (HSD)) and Deployment Mode (On-premise, Cloud), offering granular insights into this rapidly evolving sector. The market is expected to reach xx Million units by 2033.
Desktop Virtualization Market Dynamics & Structure
The Desktop Virtualization market exhibits a moderately concentrated landscape, with key players like VMware, Citrix, and Microsoft holding significant market share. Technological innovation, particularly in areas like cloud computing and security, is a major driver, while regulatory frameworks concerning data privacy and security influence market practices. The market faces competition from alternative solutions, such as traditional desktop PCs, but its advantages in cost-effectiveness, scalability, and manageability continue to fuel growth. M&A activity has been moderate, with a total of xx deals recorded between 2019 and 2024, primarily focused on enhancing technological capabilities and expanding market reach.
- Market Concentration: Moderately concentrated, with top 5 players holding approximately xx% market share in 2024.
- Technological Innovation: Cloud-based solutions, AI-powered security, and enhanced user experience are key drivers.
- Regulatory Frameworks: GDPR, CCPA, and other data privacy regulations impact market strategies.
- Competitive Substitutes: Traditional desktop PCs, thin clients.
- End-User Demographics: Primarily enterprises, SMEs, and increasingly, individual users.
- M&A Trends: xx deals between 2019-2024, focused on technology integration and market expansion.
Desktop Virtualization Market Growth Trends & Insights
The Desktop Virtualization market has witnessed significant growth from 2019 to 2024, expanding from xx Million units to xx Million units, driven by the increasing adoption of cloud computing, the need for enhanced security, and the rise of remote work. The market is expected to exhibit a CAGR of xx% during the forecast period (2025-2033), reaching xx Million units by 2033. This growth is fueled by technological advancements, such as the integration of AI and machine learning, improved user experience, and the increasing adoption of hybrid work models. The market penetration rate is projected to increase from xx% in 2024 to xx% by 2033. Shifting consumer behavior towards flexible and secure remote work solutions further bolsters this growth trajectory. Specific advancements in areas like security and ease of deployment are crucial factors influencing market adoption rates.
Dominant Regions, Countries, or Segments in Desktop Virtualization Market
North America currently dominates the Desktop Virtualization market, driven by strong technological advancements, a well-established IT infrastructure, and high adoption rates among enterprises. Within the segments, Hosted Virtual Desktops (HVD) are experiencing faster growth than Hosted Shared Desktops (HSD) due to their enhanced security and customization options. Similarly, the cloud deployment model is witnessing significant traction over on-premise solutions due to its scalability, cost-effectiveness, and ease of management.
- Key Drivers for North America: Robust IT infrastructure, high technological adoption rates, strong enterprise spending on IT.
- HVD Growth Drivers: Enhanced security, customization, and scalability.
- Cloud Deployment Growth Drivers: Scalability, cost-effectiveness, and ease of management.
- Market Share: North America holds approximately xx% of the global market in 2024.
- Growth Potential: Significant growth potential in APAC and EMEA regions, driven by increasing digitalization and infrastructure development.
Desktop Virtualization Market Product Landscape
The Desktop Virtualization market offers a range of solutions, from basic virtual desktop infrastructure (VDI) to advanced cloud-based platforms with integrated security and management tools. Key product innovations focus on improved user experience, enhanced security features (like Trusted Launch), and seamless integration with existing IT infrastructure. Products are differentiated by their scalability, performance, security features, and ease of deployment. Unique selling propositions include optimized performance for various applications, streamlined management consoles, and robust security protocols.
Key Drivers, Barriers & Challenges in Desktop Virtualization Market
Key Drivers:
- Growing demand for remote work solutions.
- Increasing adoption of cloud computing and SaaS applications.
- Need for enhanced security and data protection.
- Cost optimization and improved IT resource utilization.
Challenges and Restraints:
- High initial investment costs.
- Complexity of implementation and management for large deployments.
- Concerns about network latency and bandwidth requirements.
- Security threats and data breaches. This leads to approximately xx Million units of lost market potential annually in 2024.
Emerging Opportunities in Desktop Virtualization Market
The expanding adoption of 5G, the rise of edge computing, and the integration of AI/ML open up exciting new avenues for the market. Opportunities exist in untapped markets, such as healthcare and education, and in the development of specialized virtual desktop solutions for niche applications. Personalized user experiences, tailored security protocols, and improved application compatibility are key areas for innovation.
Growth Accelerators in the Desktop Virtualization Market Industry
Technological advancements like AI-powered security, optimized cloud platforms, and enhanced user interfaces are driving long-term growth. Strategic partnerships between virtualization vendors and cloud service providers enhance market reach and accessibility. Market expansion strategies focusing on emerging economies with growing digitalization are also crucial growth accelerators.
Key Players Shaping the Desktop Virtualization Market Market
- Parallels International GmbH
- Toshiba Corporation
- Ncomputing Inc
- Microsoft Corporation
- Dell Inc
- Huawei Technologies Co Ltd
- Ericom Software Inc
- Citrix Systems Inc
- Red Hat Inc (IBM Corporation)
- Tems Inc
- Vmware Inc
Notable Milestones in Desktop Virtualization Market Sector
- July 2022: Microsoft announced Azure virtual desktop support for virtual machines with "Trusted Launch" protections, enhancing security.
- January 2023: VMware launched a new solution for global retailers to modernize point-of-sale (POS) systems, expanding market applications.
In-Depth Desktop Virtualization Market Market Outlook
The Desktop Virtualization market is poised for continued robust growth driven by technological advancements, increasing demand for remote work solutions, and expanding cloud adoption. Strategic partnerships, investment in R&D, and focus on emerging markets will shape the competitive landscape and unlock significant growth potential in the coming years. The market’s future hinges on providing secure, scalable, and user-friendly solutions that meet the evolving needs of businesses and individuals alike.
Desktop Virtualization Market Segmentation
-
1. Desktop delivery platform
- 1.1. Hosted Virtual Desktop (HVD)
- 1.2. Hosted Shared Desktop (HSD)
-
2. Deployment Mode
- 2.1. On-premise
- 2.2. Cloud
Desktop Virtualization Market Segmentation By Geography
- 1. North America
- 2. Europe
- 3. Asia
- 4. Australia and New Zealand
- 5. Latin America
- 6. Middle East and Africa
Desktop Virtualization Market REPORT HIGHLIGHTS
| Aspects | Details |
|---|---|
| Study Period | 2019-2033 |
| Base Year | 2024 |
| Estimated Year | 2025 |
| Forecast Period | 2025-2033 |
| Historical Period | 2019-2024 |
| Growth Rate | CAGR of 11.79% from 2019-2033 |
| Segmentation |
|
Table of Contents
- 1. Introduction
- 1.1. Research Scope
- 1.2. Market Segmentation
- 1.3. Research Methodology
- 1.4. Definitions and Assumptions
- 2. Executive Summary
- 2.1. Introduction
- 3. Market Dynamics
- 3.1. Introduction
- 3.2. Market Drivers
- 3.2.1. Increasing Adoption of Cloud Computing; Growth in Automation in Retail
- 3.3. Market Restrains
- 3.3.1. Infrastructure Deployment Constraints
- 3.4. Market Trends
- 3.4.1. Hosted Virtual Desktop Accounts for Significant Market Share
- 4. Market Factor Analysis
- 4.1. Porters Five Forces
- 4.2. Supply/Value Chain
- 4.3. PESTEL analysis
- 4.4. Market Entropy
- 4.5. Patent/Trademark Analysis
- 5. Global Desktop Virtualization Market Analysis, Insights and Forecast, 2019-2031
- 5.1. Market Analysis, Insights and Forecast - by Desktop delivery platform
- 5.1.1. Hosted Virtual Desktop (HVD)
- 5.1.2. Hosted Shared Desktop (HSD)
- 5.2. Market Analysis, Insights and Forecast - by Deployment Mode
- 5.2.1. On-premise
- 5.2.2. Cloud
- 5.3. Market Analysis, Insights and Forecast - by Region
- 5.3.1. North America
- 5.3.2. Europe
- 5.3.3. Asia
- 5.3.4. Australia and New Zealand
- 5.3.5. Latin America
- 5.3.6. Middle East and Africa
- 5.1. Market Analysis, Insights and Forecast - by Desktop delivery platform
- 6. North America Desktop Virtualization Market Analysis, Insights and Forecast, 2019-2031
- 6.1. Market Analysis, Insights and Forecast - by Desktop delivery platform
- 6.1.1. Hosted Virtual Desktop (HVD)
- 6.1.2. Hosted Shared Desktop (HSD)
- 6.2. Market Analysis, Insights and Forecast - by Deployment Mode
- 6.2.1. On-premise
- 6.2.2. Cloud
- 6.1. Market Analysis, Insights and Forecast - by Desktop delivery platform
- 7. Europe Desktop Virtualization Market Analysis, Insights and Forecast, 2019-2031
- 7.1. Market Analysis, Insights and Forecast - by Desktop delivery platform
- 7.1.1. Hosted Virtual Desktop (HVD)
- 7.1.2. Hosted Shared Desktop (HSD)
- 7.2. Market Analysis, Insights and Forecast - by Deployment Mode
- 7.2.1. On-premise
- 7.2.2. Cloud
- 7.1. Market Analysis, Insights and Forecast - by Desktop delivery platform
- 8. Asia Desktop Virtualization Market Analysis, Insights and Forecast, 2019-2031
- 8.1. Market Analysis, Insights and Forecast - by Desktop delivery platform
- 8.1.1. Hosted Virtual Desktop (HVD)
- 8.1.2. Hosted Shared Desktop (HSD)
- 8.2. Market Analysis, Insights and Forecast - by Deployment Mode
- 8.2.1. On-premise
- 8.2.2. Cloud
- 8.1. Market Analysis, Insights and Forecast - by Desktop delivery platform
- 9. Australia and New Zealand Desktop Virtualization Market Analysis, Insights and Forecast, 2019-2031
- 9.1. Market Analysis, Insights and Forecast - by Desktop delivery platform
- 9.1.1. Hosted Virtual Desktop (HVD)
- 9.1.2. Hosted Shared Desktop (HSD)
- 9.2. Market Analysis, Insights and Forecast - by Deployment Mode
- 9.2.1. On-premise
- 9.2.2. Cloud
- 9.1. Market Analysis, Insights and Forecast - by Desktop delivery platform
- 10. Latin America Desktop Virtualization Market Analysis, Insights and Forecast, 2019-2031
- 10.1. Market Analysis, Insights and Forecast - by Desktop delivery platform
- 10.1.1. Hosted Virtual Desktop (HVD)
- 10.1.2. Hosted Shared Desktop (HSD)
- 10.2. Market Analysis, Insights and Forecast - by Deployment Mode
- 10.2.1. On-premise
- 10.2.2. Cloud
- 10.1. Market Analysis, Insights and Forecast - by Desktop delivery platform
- 11. Middle East and Africa Desktop Virtualization Market Analysis, Insights and Forecast, 2019-2031
- 11.1. Market Analysis, Insights and Forecast - by Desktop delivery platform
- 11.1.1. Hosted Virtual Desktop (HVD)
- 11.1.2. Hosted Shared Desktop (HSD)
- 11.2. Market Analysis, Insights and Forecast - by Deployment Mode
- 11.2.1. On-premise
- 11.2.2. Cloud
- 11.1. Market Analysis, Insights and Forecast - by Desktop delivery platform
- 12. North America Desktop Virtualization Market Analysis, Insights and Forecast, 2019-2031
- 12.1. Market Analysis, Insights and Forecast - By Country/Sub-region
- 12.1.1 United States
- 12.1.2 Canada
- 12.1.3 Mexico
- 13. Europe Desktop Virtualization Market Analysis, Insights and Forecast, 2019-2031
- 13.1. Market Analysis, Insights and Forecast - By Country/Sub-region
- 13.1.1 Germany
- 13.1.2 United Kingdom
- 13.1.3 France
- 13.1.4 Spain
- 13.1.5 Italy
- 13.1.6 Spain
- 13.1.7 Belgium
- 13.1.8 Netherland
- 13.1.9 Nordics
- 13.1.10 Rest of Europe
- 14. Asia Pacific Desktop Virtualization Market Analysis, Insights and Forecast, 2019-2031
- 14.1. Market Analysis, Insights and Forecast - By Country/Sub-region
- 14.1.1 China
- 14.1.2 Japan
- 14.1.3 India
- 14.1.4 South Korea
- 14.1.5 Southeast Asia
- 14.1.6 Australia
- 14.1.7 Indonesia
- 14.1.8 Phillipes
- 14.1.9 Singapore
- 14.1.10 Thailandc
- 14.1.11 Rest of Asia Pacific
- 15. South America Desktop Virtualization Market Analysis, Insights and Forecast, 2019-2031
- 15.1. Market Analysis, Insights and Forecast - By Country/Sub-region
- 15.1.1 Brazil
- 15.1.2 Argentina
- 15.1.3 Peru
- 15.1.4 Chile
- 15.1.5 Colombia
- 15.1.6 Ecuador
- 15.1.7 Venezuela
- 15.1.8 Rest of South America
- 16. North America Desktop Virtualization Market Analysis, Insights and Forecast, 2019-2031
- 16.1. Market Analysis, Insights and Forecast - By Country/Sub-region
- 16.1.1 United States
- 16.1.2 Canada
- 16.1.3 Mexico
- 17. MEA Desktop Virtualization Market Analysis, Insights and Forecast, 2019-2031
- 17.1. Market Analysis, Insights and Forecast - By Country/Sub-region
- 17.1.1 United Arab Emirates
- 17.1.2 Saudi Arabia
- 17.1.3 South Africa
- 17.1.4 Rest of Middle East and Africa
- 18. Competitive Analysis
- 18.1. Global Market Share Analysis 2024
- 18.2. Company Profiles
- 18.2.1 Parallels International GmbH
- 18.2.1.1. Overview
- 18.2.1.2. Products
- 18.2.1.3. SWOT Analysis
- 18.2.1.4. Recent Developments
- 18.2.1.5. Financials (Based on Availability)
- 18.2.2 Toshiba Corporation
- 18.2.2.1. Overview
- 18.2.2.2. Products
- 18.2.2.3. SWOT Analysis
- 18.2.2.4. Recent Developments
- 18.2.2.5. Financials (Based on Availability)
- 18.2.3 Ncomputing Inc
- 18.2.3.1. Overview
- 18.2.3.2. Products
- 18.2.3.3. SWOT Analysis
- 18.2.3.4. Recent Developments
- 18.2.3.5. Financials (Based on Availability)
- 18.2.4 Microsoft Corporation
- 18.2.4.1. Overview
- 18.2.4.2. Products
- 18.2.4.3. SWOT Analysis
- 18.2.4.4. Recent Developments
- 18.2.4.5. Financials (Based on Availability)
- 18.2.5 Dell Inc
- 18.2.5.1. Overview
- 18.2.5.2. Products
- 18.2.5.3. SWOT Analysis
- 18.2.5.4. Recent Developments
- 18.2.5.5. Financials (Based on Availability)
- 18.2.6 Huawei Technologies Co Ltd
- 18.2.6.1. Overview
- 18.2.6.2. Products
- 18.2.6.3. SWOT Analysis
- 18.2.6.4. Recent Developments
- 18.2.6.5. Financials (Based on Availability)
- 18.2.7 Ericom Software Inc
- 18.2.7.1. Overview
- 18.2.7.2. Products
- 18.2.7.3. SWOT Analysis
- 18.2.7.4. Recent Developments
- 18.2.7.5. Financials (Based on Availability)
- 18.2.8 Citrix Systems Inc
- 18.2.8.1. Overview
- 18.2.8.2. Products
- 18.2.8.3. SWOT Analysis
- 18.2.8.4. Recent Developments
- 18.2.8.5. Financials (Based on Availability)
- 18.2.9 Red Hat Inc (IBM Corporation )
- 18.2.9.1. Overview
- 18.2.9.2. Products
- 18.2.9.3. SWOT Analysis
- 18.2.9.4. Recent Developments
- 18.2.9.5. Financials (Based on Availability)
- 18.2.10 Tems Inc
- 18.2.10.1. Overview
- 18.2.10.2. Products
- 18.2.10.3. SWOT Analysis
- 18.2.10.4. Recent Developments
- 18.2.10.5. Financials (Based on Availability)
- 18.2.11 Vmware Inc
- 18.2.11.1. Overview
- 18.2.11.2. Products
- 18.2.11.3. SWOT Analysis
- 18.2.11.4. Recent Developments
- 18.2.11.5. Financials (Based on Availability)
- 18.2.1 Parallels International GmbH
List of Figures
- Figure 1: Global Desktop Virtualization Market Revenue Breakdown (Million, %) by Region 2024 & 2032
- Figure 2: North America Desktop Virtualization Market Revenue (Million), by Country 2024 & 2032
- Figure 3: North America Desktop Virtualization Market Revenue Share (%), by Country 2024 & 2032
- Figure 4: Europe Desktop Virtualization Market Revenue (Million), by Country 2024 & 2032
- Figure 5: Europe Desktop Virtualization Market Revenue Share (%), by Country 2024 & 2032
- Figure 6: Asia Pacific Desktop Virtualization Market Revenue (Million), by Country 2024 & 2032
- Figure 7: Asia Pacific Desktop Virtualization Market Revenue Share (%), by Country 2024 & 2032
- Figure 8: South America Desktop Virtualization Market Revenue (Million), by Country 2024 & 2032
- Figure 9: South America Desktop Virtualization Market Revenue Share (%), by Country 2024 & 2032
- Figure 10: North America Desktop Virtualization Market Revenue (Million), by Country 2024 & 2032
- Figure 11: North America Desktop Virtualization Market Revenue Share (%), by Country 2024 & 2032
- Figure 12: MEA Desktop Virtualization Market Revenue (Million), by Country 2024 & 2032
- Figure 13: MEA Desktop Virtualization Market Revenue Share (%), by Country 2024 & 2032
- Figure 14: North America Desktop Virtualization Market Revenue (Million), by Desktop delivery platform 2024 & 2032
- Figure 15: North America Desktop Virtualization Market Revenue Share (%), by Desktop delivery platform 2024 & 2032
- Figure 16: North America Desktop Virtualization Market Revenue (Million), by Deployment Mode 2024 & 2032
- Figure 17: North America Desktop Virtualization Market Revenue Share (%), by Deployment Mode 2024 & 2032
- Figure 18: North America Desktop Virtualization Market Revenue (Million), by Country 2024 & 2032
- Figure 19: North America Desktop Virtualization Market Revenue Share (%), by Country 2024 & 2032
- Figure 20: Europe Desktop Virtualization Market Revenue (Million), by Desktop delivery platform 2024 & 2032
- Figure 21: Europe Desktop Virtualization Market Revenue Share (%), by Desktop delivery platform 2024 & 2032
- Figure 22: Europe Desktop Virtualization Market Revenue (Million), by Deployment Mode 2024 & 2032
- Figure 23: Europe Desktop Virtualization Market Revenue Share (%), by Deployment Mode 2024 & 2032
- Figure 24: Europe Desktop Virtualization Market Revenue (Million), by Country 2024 & 2032
- Figure 25: Europe Desktop Virtualization Market Revenue Share (%), by Country 2024 & 2032
- Figure 26: Asia Desktop Virtualization Market Revenue (Million), by Desktop delivery platform 2024 & 2032
- Figure 27: Asia Desktop Virtualization Market Revenue Share (%), by Desktop delivery platform 2024 & 2032
- Figure 28: Asia Desktop Virtualization Market Revenue (Million), by Deployment Mode 2024 & 2032
- Figure 29: Asia Desktop Virtualization Market Revenue Share (%), by Deployment Mode 2024 & 2032
- Figure 30: Asia Desktop Virtualization Market Revenue (Million), by Country 2024 & 2032
- Figure 31: Asia Desktop Virtualization Market Revenue Share (%), by Country 2024 & 2032
- Figure 32: Australia and New Zealand Desktop Virtualization Market Revenue (Million), by Desktop delivery platform 2024 & 2032
- Figure 33: Australia and New Zealand Desktop Virtualization Market Revenue Share (%), by Desktop delivery platform 2024 & 2032
- Figure 34: Australia and New Zealand Desktop Virtualization Market Revenue (Million), by Deployment Mode 2024 & 2032
- Figure 35: Australia and New Zealand Desktop Virtualization Market Revenue Share (%), by Deployment Mode 2024 & 2032
- Figure 36: Australia and New Zealand Desktop Virtualization Market Revenue (Million), by Country 2024 & 2032
- Figure 37: Australia and New Zealand Desktop Virtualization Market Revenue Share (%), by Country 2024 & 2032
- Figure 38: Latin America Desktop Virtualization Market Revenue (Million), by Desktop delivery platform 2024 & 2032
- Figure 39: Latin America Desktop Virtualization Market Revenue Share (%), by Desktop delivery platform 2024 & 2032
- Figure 40: Latin America Desktop Virtualization Market Revenue (Million), by Deployment Mode 2024 & 2032
- Figure 41: Latin America Desktop Virtualization Market Revenue Share (%), by Deployment Mode 2024 & 2032
- Figure 42: Latin America Desktop Virtualization Market Revenue (Million), by Country 2024 & 2032
- Figure 43: Latin America Desktop Virtualization Market Revenue Share (%), by Country 2024 & 2032
- Figure 44: Middle East and Africa Desktop Virtualization Market Revenue (Million), by Desktop delivery platform 2024 & 2032
- Figure 45: Middle East and Africa Desktop Virtualization Market Revenue Share (%), by Desktop delivery platform 2024 & 2032
- Figure 46: Middle East and Africa Desktop Virtualization Market Revenue (Million), by Deployment Mode 2024 & 2032
- Figure 47: Middle East and Africa Desktop Virtualization Market Revenue Share (%), by Deployment Mode 2024 & 2032
- Figure 48: Middle East and Africa Desktop Virtualization Market Revenue (Million), by Country 2024 & 2032
- Figure 49: Middle East and Africa Desktop Virtualization Market Revenue Share (%), by Country 2024 & 2032
List of Tables
- Table 1: Global Desktop Virtualization Market Revenue Million Forecast, by Region 2019 & 2032
- Table 2: Global Desktop Virtualization Market Revenue Million Forecast, by Desktop delivery platform 2019 & 2032
- Table 3: Global Desktop Virtualization Market Revenue Million Forecast, by Deployment Mode 2019 & 2032
- Table 4: Global Desktop Virtualization Market Revenue Million Forecast, by Region 2019 & 2032
- Table 5: Global Desktop Virtualization Market Revenue Million Forecast, by Country 2019 & 2032
- Table 6: United States Desktop Virtualization Market Revenue (Million) Forecast, by Application 2019 & 2032
- Table 7: Canada Desktop Virtualization Market Revenue (Million) Forecast, by Application 2019 & 2032
- Table 8: Mexico Desktop Virtualization Market Revenue (Million) Forecast, by Application 2019 & 2032
- Table 9: Global Desktop Virtualization Market Revenue Million Forecast, by Country 2019 & 2032
- Table 10: Germany Desktop Virtualization Market Revenue (Million) Forecast, by Application 2019 & 2032
- Table 11: United Kingdom Desktop Virtualization Market Revenue (Million) Forecast, by Application 2019 & 2032
- Table 12: France Desktop Virtualization Market Revenue (Million) Forecast, by Application 2019 & 2032
- Table 13: Spain Desktop Virtualization Market Revenue (Million) Forecast, by Application 2019 & 2032
- Table 14: Italy Desktop Virtualization Market Revenue (Million) Forecast, by Application 2019 & 2032
- Table 15: Spain Desktop Virtualization Market Revenue (Million) Forecast, by Application 2019 & 2032
- Table 16: Belgium Desktop Virtualization Market Revenue (Million) Forecast, by Application 2019 & 2032
- Table 17: Netherland Desktop Virtualization Market Revenue (Million) Forecast, by Application 2019 & 2032
- Table 18: Nordics Desktop Virtualization Market Revenue (Million) Forecast, by Application 2019 & 2032
- Table 19: Rest of Europe Desktop Virtualization Market Revenue (Million) Forecast, by Application 2019 & 2032
- Table 20: Global Desktop Virtualization Market Revenue Million Forecast, by Country 2019 & 2032
- Table 21: China Desktop Virtualization Market Revenue (Million) Forecast, by Application 2019 & 2032
- Table 22: Japan Desktop Virtualization Market Revenue (Million) Forecast, by Application 2019 & 2032
- Table 23: India Desktop Virtualization Market Revenue (Million) Forecast, by Application 2019 & 2032
- Table 24: South Korea Desktop Virtualization Market Revenue (Million) Forecast, by Application 2019 & 2032
- Table 25: Southeast Asia Desktop Virtualization Market Revenue (Million) Forecast, by Application 2019 & 2032
- Table 26: Australia Desktop Virtualization Market Revenue (Million) Forecast, by Application 2019 & 2032
- Table 27: Indonesia Desktop Virtualization Market Revenue (Million) Forecast, by Application 2019 & 2032
- Table 28: Phillipes Desktop Virtualization Market Revenue (Million) Forecast, by Application 2019 & 2032
- Table 29: Singapore Desktop Virtualization Market Revenue (Million) Forecast, by Application 2019 & 2032
- Table 30: Thailandc Desktop Virtualization Market Revenue (Million) Forecast, by Application 2019 & 2032
- Table 31: Rest of Asia Pacific Desktop Virtualization Market Revenue (Million) Forecast, by Application 2019 & 2032
- Table 32: Global Desktop Virtualization Market Revenue Million Forecast, by Country 2019 & 2032
- Table 33: Brazil Desktop Virtualization Market Revenue (Million) Forecast, by Application 2019 & 2032
- Table 34: Argentina Desktop Virtualization Market Revenue (Million) Forecast, by Application 2019 & 2032
- Table 35: Peru Desktop Virtualization Market Revenue (Million) Forecast, by Application 2019 & 2032
- Table 36: Chile Desktop Virtualization Market Revenue (Million) Forecast, by Application 2019 & 2032
- Table 37: Colombia Desktop Virtualization Market Revenue (Million) Forecast, by Application 2019 & 2032
- Table 38: Ecuador Desktop Virtualization Market Revenue (Million) Forecast, by Application 2019 & 2032
- Table 39: Venezuela Desktop Virtualization Market Revenue (Million) Forecast, by Application 2019 & 2032
- Table 40: Rest of South America Desktop Virtualization Market Revenue (Million) Forecast, by Application 2019 & 2032
- Table 41: Global Desktop Virtualization Market Revenue Million Forecast, by Country 2019 & 2032
- Table 42: United States Desktop Virtualization Market Revenue (Million) Forecast, by Application 2019 & 2032
- Table 43: Canada Desktop Virtualization Market Revenue (Million) Forecast, by Application 2019 & 2032
- Table 44: Mexico Desktop Virtualization Market Revenue (Million) Forecast, by Application 2019 & 2032
- Table 45: Global Desktop Virtualization Market Revenue Million Forecast, by Country 2019 & 2032
- Table 46: United Arab Emirates Desktop Virtualization Market Revenue (Million) Forecast, by Application 2019 & 2032
- Table 47: Saudi Arabia Desktop Virtualization Market Revenue (Million) Forecast, by Application 2019 & 2032
- Table 48: South Africa Desktop Virtualization Market Revenue (Million) Forecast, by Application 2019 & 2032
- Table 49: Rest of Middle East and Africa Desktop Virtualization Market Revenue (Million) Forecast, by Application 2019 & 2032
- Table 50: Global Desktop Virtualization Market Revenue Million Forecast, by Desktop delivery platform 2019 & 2032
- Table 51: Global Desktop Virtualization Market Revenue Million Forecast, by Deployment Mode 2019 & 2032
- Table 52: Global Desktop Virtualization Market Revenue Million Forecast, by Country 2019 & 2032
- Table 53: Global Desktop Virtualization Market Revenue Million Forecast, by Desktop delivery platform 2019 & 2032
- Table 54: Global Desktop Virtualization Market Revenue Million Forecast, by Deployment Mode 2019 & 2032
- Table 55: Global Desktop Virtualization Market Revenue Million Forecast, by Country 2019 & 2032
- Table 56: Global Desktop Virtualization Market Revenue Million Forecast, by Desktop delivery platform 2019 & 2032
- Table 57: Global Desktop Virtualization Market Revenue Million Forecast, by Deployment Mode 2019 & 2032
- Table 58: Global Desktop Virtualization Market Revenue Million Forecast, by Country 2019 & 2032
- Table 59: Global Desktop Virtualization Market Revenue Million Forecast, by Desktop delivery platform 2019 & 2032
- Table 60: Global Desktop Virtualization Market Revenue Million Forecast, by Deployment Mode 2019 & 2032
- Table 61: Global Desktop Virtualization Market Revenue Million Forecast, by Country 2019 & 2032
- Table 62: Global Desktop Virtualization Market Revenue Million Forecast, by Desktop delivery platform 2019 & 2032
- Table 63: Global Desktop Virtualization Market Revenue Million Forecast, by Deployment Mode 2019 & 2032
- Table 64: Global Desktop Virtualization Market Revenue Million Forecast, by Country 2019 & 2032
- Table 65: Global Desktop Virtualization Market Revenue Million Forecast, by Desktop delivery platform 2019 & 2032
- Table 66: Global Desktop Virtualization Market Revenue Million Forecast, by Deployment Mode 2019 & 2032
- Table 67: Global Desktop Virtualization Market Revenue Million Forecast, by Country 2019 & 2032
Frequently Asked Questions
1. What is the projected Compound Annual Growth Rate (CAGR) of the Desktop Virtualization Market?
The projected CAGR is approximately 11.79%.
2. Which companies are prominent players in the Desktop Virtualization Market?
Key companies in the market include Parallels International GmbH, Toshiba Corporation, Ncomputing Inc, Microsoft Corporation, Dell Inc, Huawei Technologies Co Ltd, Ericom Software Inc, Citrix Systems Inc, Red Hat Inc (IBM Corporation ), Tems Inc, Vmware Inc.
3. What are the main segments of the Desktop Virtualization Market?
The market segments include Desktop delivery platform, Deployment Mode.
4. Can you provide details about the market size?
The market size is estimated to be USD 1.46 Million as of 2022.
5. What are some drivers contributing to market growth?
Increasing Adoption of Cloud Computing; Growth in Automation in Retail.
6. What are the notable trends driving market growth?
Hosted Virtual Desktop Accounts for Significant Market Share.
7. Are there any restraints impacting market growth?
Infrastructure Deployment Constraints.
8. Can you provide examples of recent developments in the market?
January 2023 - VMware revealed a new solution for global retailers to modernize point of sale (POS) and unlock more financial value from their POS devices. VMware Retail POS modernization solutions enable operations, IT, marketing, and security teams to become more agile and responsive to drive critical business, customer, and IT outcomes.
9. What pricing options are available for accessing the report?
Pricing options include single-user, multi-user, and enterprise licenses priced at USD 4750, USD 5250, and USD 8750 respectively.
10. Is the market size provided in terms of value or volume?
The market size is provided in terms of value, measured in Million.
11. Are there any specific market keywords associated with the report?
Yes, the market keyword associated with the report is "Desktop Virtualization Market," which aids in identifying and referencing the specific market segment covered.
12. How do I determine which pricing option suits my needs best?
The pricing options vary based on user requirements and access needs. Individual users may opt for single-user licenses, while businesses requiring broader access may choose multi-user or enterprise licenses for cost-effective access to the report.
13. Are there any additional resources or data provided in the Desktop Virtualization Market report?
While the report offers comprehensive insights, it's advisable to review the specific contents or supplementary materials provided to ascertain if additional resources or data are available.
14. How can I stay updated on further developments or reports in the Desktop Virtualization Market?
To stay informed about further developments, trends, and reports in the Desktop Virtualization Market, consider subscribing to industry newsletters, following relevant companies and organizations, or regularly checking reputable industry news sources and publications.
Methodology
Step 1 - Identification of Relevant Samples Size from Population Database


Step 2 - Approaches for Defining Global Market Size (Value, Volume* & Price*)

Note*: In applicable scenarios
Step 3 - Data Sources
Primary Research
- Web Analytics
- Survey Reports
- Research Institute
- Latest Research Reports
- Opinion Leaders
Secondary Research
- Annual Reports
- White Paper
- Latest Press Release
- Industry Association
- Paid Database
- Investor Presentations

Step 4 - Data Triangulation
Involves using different sources of information in order to increase the validity of a study
These sources are likely to be stakeholders in a program - participants, other researchers, program staff, other community members, and so on.
Then we put all data in single framework & apply various statistical tools to find out the dynamic on the market.
During the analysis stage, feedback from the stakeholder groups would be compared to determine areas of agreement as well as areas of divergence
