

Key Insights
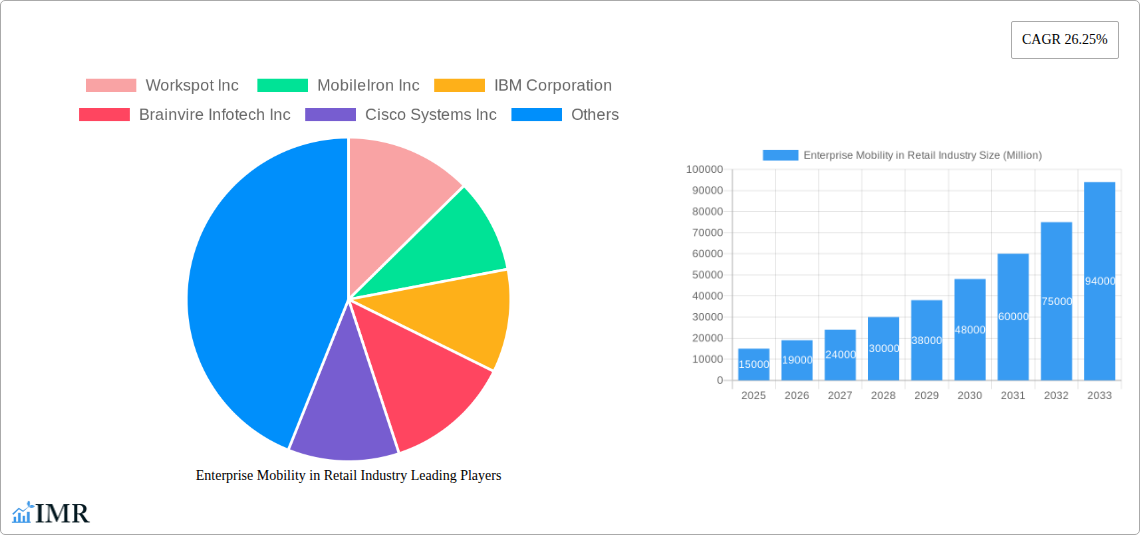
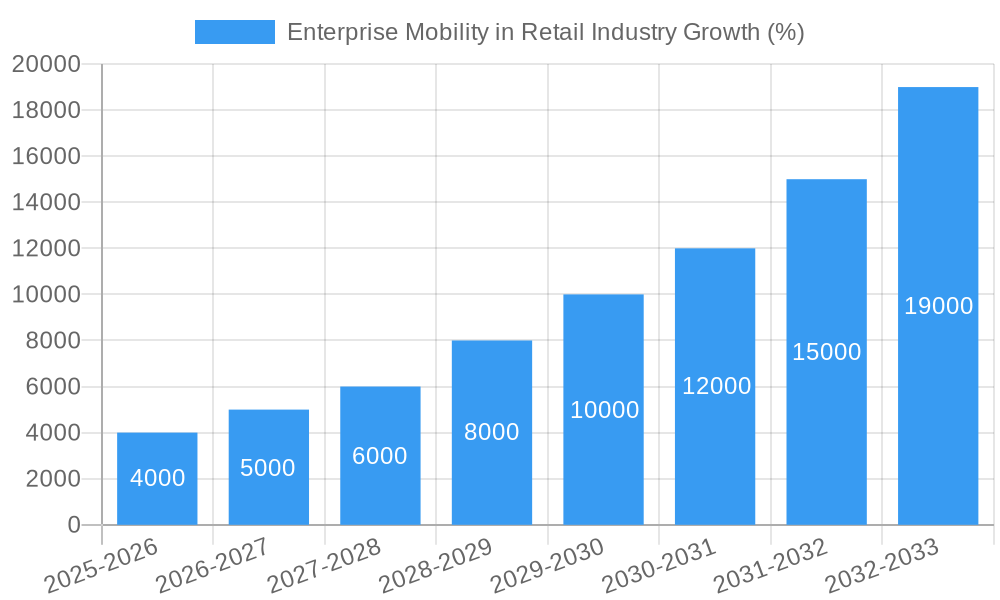
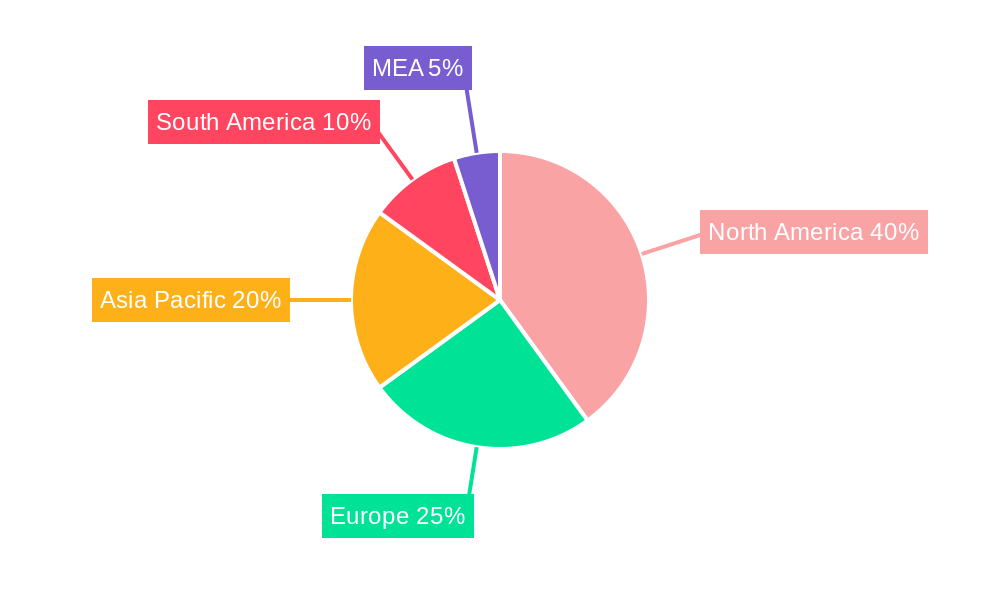
The enterprise mobility market in the retail industry is experiencing robust growth, fueled by a 26.25% CAGR (Compound Annual Growth Rate). This expansion is driven by the increasing need for improved operational efficiency, enhanced customer experiences, and streamlined supply chain management. Retailers are leveraging mobile technologies like smartphones, laptops, and tablets to empower their workforce, enabling real-time inventory tracking, optimized logistics, and personalized customer service. The shift towards omnichannel strategies, incorporating both online and offline retail experiences, is a major catalyst for this growth. Furthermore, the adoption of cloud-based mobility solutions offers scalability and cost-effectiveness, further encouraging market expansion. While data security and privacy concerns pose challenges, advancements in security technologies are mitigating these risks. Competition is fierce, with established players like IBM, Microsoft, and Cisco competing with specialized mobility solution providers. The North American market currently holds a significant share, but rapid digitalization in Asia-Pacific and other emerging regions presents substantial growth opportunities. The market is segmented by device type, with smartphones and tablets gaining prominence due to their portability and ease of use. The forecast period (2025-2033) anticipates continued expansion, driven by technological innovation and the ongoing digital transformation within the retail sector. Growth will be particularly strong in regions with rapidly expanding e-commerce markets and a growing adoption of mobile technologies among retail employees.
The competitive landscape is characterized by both large technology companies offering comprehensive solutions and smaller, specialized firms focusing on niche areas within enterprise mobility. Strategic partnerships and mergers and acquisitions are likely to shape the market landscape in the coming years. Successful companies will differentiate themselves through robust security features, ease of integration with existing retail systems, and a focus on providing tailored solutions that address the unique needs of specific retail segments. Continued investment in research and development will be crucial for companies to stay competitive and capitalize on emerging trends such as artificial intelligence and the Internet of Things (IoT) within the retail mobility sector. The integration of these technologies will likely enhance efficiency and deliver even more personalized customer experiences.
Enterprise Mobility in Retail Industry: Market Report 2019-2033
This comprehensive report provides an in-depth analysis of the Enterprise Mobility in Retail Industry market, projecting significant growth from 2025 to 2033. With a focus on market dynamics, growth trends, regional analysis, and key players, this report is an invaluable resource for industry professionals, investors, and strategic decision-makers. The study period covers 2019-2033, with 2025 as the base year and estimated year. The forecast period is 2025-2033, and the historical period is 2019-2024. The market is segmented by device type: Smartphones, Laptops, Tablets, and Other Devices.
Enterprise Mobility in Retail Industry Market Dynamics & Structure
The Enterprise Mobility in Retail Industry is experiencing robust growth, driven by technological advancements, changing consumer behavior, and the increasing need for efficient operations. Market concentration is moderate, with a few dominant players and numerous niche players. Technological innovation, particularly in areas like 5G connectivity, cloud computing, and AI-powered solutions, is a significant driver. Regulatory frameworks, including data privacy regulations (e.g., GDPR), significantly impact market dynamics. Competitive substitutes include traditional on-premise systems, but the advantages of mobility and cloud-based solutions are driving market shift. End-user demographics are increasingly diverse, with a focus on both store-level employees and customer-facing applications. M&A activity is moderate, with an estimated xx million USD in deal volume during 2019-2024, representing xx% year-on-year growth.
- Market Concentration: Moderately concentrated, with top 5 players holding xx% market share in 2025.
- Innovation Drivers: 5G, Cloud Computing, AI, IoT.
- Regulatory Frameworks: GDPR, CCPA, and other regional data privacy regulations.
- Competitive Substitutes: On-premise systems, legacy infrastructure.
- M&A Activity: xx million USD in deal volume (2019-2024), xx% YoY growth.
- Innovation Barriers: High initial investment costs, integration complexities, security concerns.
Enterprise Mobility in Retail Industry Growth Trends & Insights
The Enterprise Mobility in Retail Industry market size is projected to reach xx million units by 2025, exhibiting a CAGR of xx% during the forecast period (2025-2033). This growth is fueled by increasing adoption of mobile technologies across retail operations, from inventory management and supply chain optimization to customer engagement and personalized experiences. Technological disruptions, such as the rise of omnichannel retailing and the increasing use of mobile POS systems, are significantly impacting market growth. Consumer behavior shifts towards mobile-first experiences are further accelerating adoption. Market penetration is expected to reach xx% by 2033, driven by factors such as declining hardware costs, improved network infrastructure, and increasing awareness of the benefits of enterprise mobility.
Dominant Regions, Countries, or Segments in Enterprise Mobility in Retail Industry
North America is currently the dominant region in the Enterprise Mobility in Retail Industry, holding a market share of xx% in 2025. This dominance is driven by factors such as high technological adoption rates, robust retail infrastructure, and the presence of major technology companies. However, the Asia-Pacific region is projected to witness the fastest growth rate during the forecast period, driven by increasing smartphone penetration and expanding e-commerce markets. Within device segments, Smartphones are the dominant device type, contributing xx% of the market share in 2025, followed by Tablets at xx% and Laptops at xx%.
- North America Dominance: Strong retail infrastructure, high tech adoption, major tech companies based in the region.
- Asia-Pacific Growth: High smartphone penetration, expanding e-commerce, government initiatives promoting digitalization.
- Smartphones Dominance: Ease of use, cost-effectiveness, wide availability.
- Tablet Growth: Suitable for inventory management, point-of-sale, and customer engagement.
Enterprise Mobility in Retail Industry Product Landscape
The product landscape is characterized by a diverse range of solutions, including mobile device management (MDM) software, enterprise mobility management (EMM) platforms, mobile application development platforms (MADP), and specialized retail-focused applications. These solutions offer functionalities such as device security, application management, data synchronization, and workforce productivity tools. Key technological advancements include the integration of AI, machine learning, and blockchain technologies to enhance security and improve operational efficiency. The unique selling propositions often center around ease of use, robust security features, and seamless integration with existing retail systems.
Key Drivers, Barriers & Challenges in Enterprise Mobility in Retail Industry
Key Drivers: Increased need for operational efficiency, improved customer engagement, growth of omnichannel retailing, and advancements in mobile technologies (5G, cloud computing).
Challenges: High initial investment costs, concerns over data security and privacy, integration complexities with legacy systems, lack of skilled workforce to manage and maintain these systems, and the need for robust cybersecurity measures to prevent data breaches and system failures can significantly impact market growth.
Emerging Opportunities in Enterprise Mobility in Retail Industry
Emerging opportunities lie in the expansion of mobile payment solutions, the adoption of augmented reality (AR) and virtual reality (VR) technologies for enhanced customer experiences, and the integration of IoT devices for real-time inventory tracking and supply chain optimization. Untapped markets in developing economies also present significant growth potential. The increasing demand for personalized customer experiences through mobile channels offers further opportunities for innovation.
Growth Accelerators in the Enterprise Mobility in Retail Industry Industry
Long-term growth will be driven by strategic partnerships between technology providers and retail companies, the development of innovative mobile applications tailored to specific retail needs, and the expansion of enterprise mobility solutions into new geographic markets. Technological breakthroughs in areas like 5G and AI will continue to fuel innovation and drive market expansion.
Key Players Shaping the Enterprise Mobility in Retail Industry Market
- Workspot Inc
- MobileIron Inc
- IBM Corporation
- Brainvire Infotech Inc
- Cisco Systems Inc
- Microsoft Corporation
- Credencys Solutions Inc
- InnoMind Technologies
- Gizmeon Inc
- VMware Inc
- Citrix Systems Inc
- SAP SE
- Sonata Software
Notable Milestones in Enterprise Mobility in Retail Industry Sector
- 2020: Launch of 5G networks globally accelerates mobile application development and adoption.
- 2021: Increased adoption of cloud-based EMM solutions for improved scalability and security.
- 2022: Several major retailers implement AI-powered chatbots for enhanced customer support.
- 2023: Significant investment in mobile POS (mPOS) systems enhances in-store efficiency.
- 2024: Growing adoption of AR/VR technologies for immersive shopping experiences.
In-Depth Enterprise Mobility in Retail Industry Market Outlook
The Enterprise Mobility in Retail Industry is poised for continued strong growth, driven by the ongoing digital transformation within the retail sector. Strategic opportunities exist for companies focusing on innovative solutions that address specific retail challenges, such as inventory management, supply chain optimization, and customer engagement. The increasing adoption of AI, IoT, and other emerging technologies will further shape the market landscape, presenting significant growth potential for forward-thinking companies.
Enterprise Mobility in Retail Industry Segmentation
-
1. Device
- 1.1. Smart Phones
- 1.2. Laptops
- 1.3. Tablets
- 1.4. Other Devices
Enterprise Mobility in Retail Industry Segmentation By Geography
- 1. North America
- 2. Europe
- 3. Asia pacific
- 4. Latin America
- 5. Middle East
Enterprise Mobility in Retail Industry REPORT HIGHLIGHTS
| Aspects | Details |
|---|---|
| Study Period | 2019-2033 |
| Base Year | 2024 |
| Estimated Year | 2025 |
| Forecast Period | 2025-2033 |
| Historical Period | 2019-2024 |
| Growth Rate | CAGR of 26.25% from 2019-2033 |
| Segmentation |
|
Table of Contents
- 1. Introduction
- 1.1. Research Scope
- 1.2. Market Segmentation
- 1.3. Research Methodology
- 1.4. Definitions and Assumptions
- 2. Executive Summary
- 2.1. Introduction
- 3. Market Dynamics
- 3.1. Introduction
- 3.2. Market Drivers
- 3.2.1. ; Substantial Growth in E-commerce; Increasing Adoption of Bring-your-own-device (BYOD)
- 3.3. Market Restrains
- 3.3.1. ; Security Concerns
- 3.4. Market Trends
- 3.4.1. Substantial Growth in E-commerce to Spearhead the Growth
- 4. Market Factor Analysis
- 4.1. Porters Five Forces
- 4.2. Supply/Value Chain
- 4.3. PESTEL analysis
- 4.4. Market Entropy
- 4.5. Patent/Trademark Analysis
- 5. Global Enterprise Mobility in Retail Industry Analysis, Insights and Forecast, 2019-2031
- 5.1. Market Analysis, Insights and Forecast - by Device
- 5.1.1. Smart Phones
- 5.1.2. Laptops
- 5.1.3. Tablets
- 5.1.4. Other Devices
- 5.2. Market Analysis, Insights and Forecast - by Region
- 5.2.1. North America
- 5.2.2. Europe
- 5.2.3. Asia pacific
- 5.2.4. Latin America
- 5.2.5. Middle East
- 5.1. Market Analysis, Insights and Forecast - by Device
- 6. North America Enterprise Mobility in Retail Industry Analysis, Insights and Forecast, 2019-2031
- 6.1. Market Analysis, Insights and Forecast - by Device
- 6.1.1. Smart Phones
- 6.1.2. Laptops
- 6.1.3. Tablets
- 6.1.4. Other Devices
- 6.1. Market Analysis, Insights and Forecast - by Device
- 7. Europe Enterprise Mobility in Retail Industry Analysis, Insights and Forecast, 2019-2031
- 7.1. Market Analysis, Insights and Forecast - by Device
- 7.1.1. Smart Phones
- 7.1.2. Laptops
- 7.1.3. Tablets
- 7.1.4. Other Devices
- 7.1. Market Analysis, Insights and Forecast - by Device
- 8. Asia pacific Enterprise Mobility in Retail Industry Analysis, Insights and Forecast, 2019-2031
- 8.1. Market Analysis, Insights and Forecast - by Device
- 8.1.1. Smart Phones
- 8.1.2. Laptops
- 8.1.3. Tablets
- 8.1.4. Other Devices
- 8.1. Market Analysis, Insights and Forecast - by Device
- 9. Latin America Enterprise Mobility in Retail Industry Analysis, Insights and Forecast, 2019-2031
- 9.1. Market Analysis, Insights and Forecast - by Device
- 9.1.1. Smart Phones
- 9.1.2. Laptops
- 9.1.3. Tablets
- 9.1.4. Other Devices
- 9.1. Market Analysis, Insights and Forecast - by Device
- 10. Middle East Enterprise Mobility in Retail Industry Analysis, Insights and Forecast, 2019-2031
- 10.1. Market Analysis, Insights and Forecast - by Device
- 10.1.1. Smart Phones
- 10.1.2. Laptops
- 10.1.3. Tablets
- 10.1.4. Other Devices
- 10.1. Market Analysis, Insights and Forecast - by Device
- 11. North America Enterprise Mobility in Retail Industry Analysis, Insights and Forecast, 2019-2031
- 11.1. Market Analysis, Insights and Forecast - By Country/Sub-region
- 11.1.1 United States
- 11.1.2 Canada
- 11.1.3 Mexico
- 12. Europe Enterprise Mobility in Retail Industry Analysis, Insights and Forecast, 2019-2031
- 12.1. Market Analysis, Insights and Forecast - By Country/Sub-region
- 12.1.1 Germany
- 12.1.2 United Kingdom
- 12.1.3 France
- 12.1.4 Spain
- 12.1.5 Italy
- 12.1.6 Spain
- 12.1.7 Belgium
- 12.1.8 Netherland
- 12.1.9 Nordics
- 12.1.10 Rest of Europe
- 13. Asia Pacific Enterprise Mobility in Retail Industry Analysis, Insights and Forecast, 2019-2031
- 13.1. Market Analysis, Insights and Forecast - By Country/Sub-region
- 13.1.1 China
- 13.1.2 Japan
- 13.1.3 India
- 13.1.4 South Korea
- 13.1.5 Southeast Asia
- 13.1.6 Australia
- 13.1.7 Indonesia
- 13.1.8 Phillipes
- 13.1.9 Singapore
- 13.1.10 Thailandc
- 13.1.11 Rest of Asia Pacific
- 14. South America Enterprise Mobility in Retail Industry Analysis, Insights and Forecast, 2019-2031
- 14.1. Market Analysis, Insights and Forecast - By Country/Sub-region
- 14.1.1 Brazil
- 14.1.2 Argentina
- 14.1.3 Peru
- 14.1.4 Chile
- 14.1.5 Colombia
- 14.1.6 Ecuador
- 14.1.7 Venezuela
- 14.1.8 Rest of South America
- 15. North America Enterprise Mobility in Retail Industry Analysis, Insights and Forecast, 2019-2031
- 15.1. Market Analysis, Insights and Forecast - By Country/Sub-region
- 15.1.1 United States
- 15.1.2 Canada
- 15.1.3 Mexico
- 16. MEA Enterprise Mobility in Retail Industry Analysis, Insights and Forecast, 2019-2031
- 16.1. Market Analysis, Insights and Forecast - By Country/Sub-region
- 16.1.1 United Arab Emirates
- 16.1.2 Saudi Arabia
- 16.1.3 South Africa
- 16.1.4 Rest of Middle East and Africa
- 17. Competitive Analysis
- 17.1. Global Market Share Analysis 2024
- 17.2. Company Profiles
- 17.2.1 Workspot Inc
- 17.2.1.1. Overview
- 17.2.1.2. Products
- 17.2.1.3. SWOT Analysis
- 17.2.1.4. Recent Developments
- 17.2.1.5. Financials (Based on Availability)
- 17.2.2 MobileIron Inc
- 17.2.2.1. Overview
- 17.2.2.2. Products
- 17.2.2.3. SWOT Analysis
- 17.2.2.4. Recent Developments
- 17.2.2.5. Financials (Based on Availability)
- 17.2.3 IBM Corporation
- 17.2.3.1. Overview
- 17.2.3.2. Products
- 17.2.3.3. SWOT Analysis
- 17.2.3.4. Recent Developments
- 17.2.3.5. Financials (Based on Availability)
- 17.2.4 Brainvire Infotech Inc
- 17.2.4.1. Overview
- 17.2.4.2. Products
- 17.2.4.3. SWOT Analysis
- 17.2.4.4. Recent Developments
- 17.2.4.5. Financials (Based on Availability)
- 17.2.5 Cisco Systems Inc
- 17.2.5.1. Overview
- 17.2.5.2. Products
- 17.2.5.3. SWOT Analysis
- 17.2.5.4. Recent Developments
- 17.2.5.5. Financials (Based on Availability)
- 17.2.6 Microsoft Corporation
- 17.2.6.1. Overview
- 17.2.6.2. Products
- 17.2.6.3. SWOT Analysis
- 17.2.6.4. Recent Developments
- 17.2.6.5. Financials (Based on Availability)
- 17.2.7 Credencys Solutions Inc
- 17.2.7.1. Overview
- 17.2.7.2. Products
- 17.2.7.3. SWOT Analysis
- 17.2.7.4. Recent Developments
- 17.2.7.5. Financials (Based on Availability)
- 17.2.8 InnoMind Technologies
- 17.2.8.1. Overview
- 17.2.8.2. Products
- 17.2.8.3. SWOT Analysis
- 17.2.8.4. Recent Developments
- 17.2.8.5. Financials (Based on Availability)
- 17.2.9 Gizmeon Inc
- 17.2.9.1. Overview
- 17.2.9.2. Products
- 17.2.9.3. SWOT Analysis
- 17.2.9.4. Recent Developments
- 17.2.9.5. Financials (Based on Availability)
- 17.2.10 VMware Inc
- 17.2.10.1. Overview
- 17.2.10.2. Products
- 17.2.10.3. SWOT Analysis
- 17.2.10.4. Recent Developments
- 17.2.10.5. Financials (Based on Availability)
- 17.2.11 Citrix Systems Inc
- 17.2.11.1. Overview
- 17.2.11.2. Products
- 17.2.11.3. SWOT Analysis
- 17.2.11.4. Recent Developments
- 17.2.11.5. Financials (Based on Availability)
- 17.2.12 SAP SE
- 17.2.12.1. Overview
- 17.2.12.2. Products
- 17.2.12.3. SWOT Analysis
- 17.2.12.4. Recent Developments
- 17.2.12.5. Financials (Based on Availability)
- 17.2.13 Sonata Software
- 17.2.13.1. Overview
- 17.2.13.2. Products
- 17.2.13.3. SWOT Analysis
- 17.2.13.4. Recent Developments
- 17.2.13.5. Financials (Based on Availability)
- 17.2.1 Workspot Inc
List of Figures
- Figure 1: Global Enterprise Mobility in Retail Industry Revenue Breakdown (Million, %) by Region 2024 & 2032
- Figure 2: North America Enterprise Mobility in Retail Industry Revenue (Million), by Country 2024 & 2032
- Figure 3: North America Enterprise Mobility in Retail Industry Revenue Share (%), by Country 2024 & 2032
- Figure 4: Europe Enterprise Mobility in Retail Industry Revenue (Million), by Country 2024 & 2032
- Figure 5: Europe Enterprise Mobility in Retail Industry Revenue Share (%), by Country 2024 & 2032
- Figure 6: Asia Pacific Enterprise Mobility in Retail Industry Revenue (Million), by Country 2024 & 2032
- Figure 7: Asia Pacific Enterprise Mobility in Retail Industry Revenue Share (%), by Country 2024 & 2032
- Figure 8: South America Enterprise Mobility in Retail Industry Revenue (Million), by Country 2024 & 2032
- Figure 9: South America Enterprise Mobility in Retail Industry Revenue Share (%), by Country 2024 & 2032
- Figure 10: North America Enterprise Mobility in Retail Industry Revenue (Million), by Country 2024 & 2032
- Figure 11: North America Enterprise Mobility in Retail Industry Revenue Share (%), by Country 2024 & 2032
- Figure 12: MEA Enterprise Mobility in Retail Industry Revenue (Million), by Country 2024 & 2032
- Figure 13: MEA Enterprise Mobility in Retail Industry Revenue Share (%), by Country 2024 & 2032
- Figure 14: North America Enterprise Mobility in Retail Industry Revenue (Million), by Device 2024 & 2032
- Figure 15: North America Enterprise Mobility in Retail Industry Revenue Share (%), by Device 2024 & 2032
- Figure 16: North America Enterprise Mobility in Retail Industry Revenue (Million), by Country 2024 & 2032
- Figure 17: North America Enterprise Mobility in Retail Industry Revenue Share (%), by Country 2024 & 2032
- Figure 18: Europe Enterprise Mobility in Retail Industry Revenue (Million), by Device 2024 & 2032
- Figure 19: Europe Enterprise Mobility in Retail Industry Revenue Share (%), by Device 2024 & 2032
- Figure 20: Europe Enterprise Mobility in Retail Industry Revenue (Million), by Country 2024 & 2032
- Figure 21: Europe Enterprise Mobility in Retail Industry Revenue Share (%), by Country 2024 & 2032
- Figure 22: Asia pacific Enterprise Mobility in Retail Industry Revenue (Million), by Device 2024 & 2032
- Figure 23: Asia pacific Enterprise Mobility in Retail Industry Revenue Share (%), by Device 2024 & 2032
- Figure 24: Asia pacific Enterprise Mobility in Retail Industry Revenue (Million), by Country 2024 & 2032
- Figure 25: Asia pacific Enterprise Mobility in Retail Industry Revenue Share (%), by Country 2024 & 2032
- Figure 26: Latin America Enterprise Mobility in Retail Industry Revenue (Million), by Device 2024 & 2032
- Figure 27: Latin America Enterprise Mobility in Retail Industry Revenue Share (%), by Device 2024 & 2032
- Figure 28: Latin America Enterprise Mobility in Retail Industry Revenue (Million), by Country 2024 & 2032
- Figure 29: Latin America Enterprise Mobility in Retail Industry Revenue Share (%), by Country 2024 & 2032
- Figure 30: Middle East Enterprise Mobility in Retail Industry Revenue (Million), by Device 2024 & 2032
- Figure 31: Middle East Enterprise Mobility in Retail Industry Revenue Share (%), by Device 2024 & 2032
- Figure 32: Middle East Enterprise Mobility in Retail Industry Revenue (Million), by Country 2024 & 2032
- Figure 33: Middle East Enterprise Mobility in Retail Industry Revenue Share (%), by Country 2024 & 2032
List of Tables
- Table 1: Global Enterprise Mobility in Retail Industry Revenue Million Forecast, by Region 2019 & 2032
- Table 2: Global Enterprise Mobility in Retail Industry Revenue Million Forecast, by Device 2019 & 2032
- Table 3: Global Enterprise Mobility in Retail Industry Revenue Million Forecast, by Region 2019 & 2032
- Table 4: Global Enterprise Mobility in Retail Industry Revenue Million Forecast, by Country 2019 & 2032
- Table 5: United States Enterprise Mobility in Retail Industry Revenue (Million) Forecast, by Application 2019 & 2032
- Table 6: Canada Enterprise Mobility in Retail Industry Revenue (Million) Forecast, by Application 2019 & 2032
- Table 7: Mexico Enterprise Mobility in Retail Industry Revenue (Million) Forecast, by Application 2019 & 2032
- Table 8: Global Enterprise Mobility in Retail Industry Revenue Million Forecast, by Country 2019 & 2032
- Table 9: Germany Enterprise Mobility in Retail Industry Revenue (Million) Forecast, by Application 2019 & 2032
- Table 10: United Kingdom Enterprise Mobility in Retail Industry Revenue (Million) Forecast, by Application 2019 & 2032
- Table 11: France Enterprise Mobility in Retail Industry Revenue (Million) Forecast, by Application 2019 & 2032
- Table 12: Spain Enterprise Mobility in Retail Industry Revenue (Million) Forecast, by Application 2019 & 2032
- Table 13: Italy Enterprise Mobility in Retail Industry Revenue (Million) Forecast, by Application 2019 & 2032
- Table 14: Spain Enterprise Mobility in Retail Industry Revenue (Million) Forecast, by Application 2019 & 2032
- Table 15: Belgium Enterprise Mobility in Retail Industry Revenue (Million) Forecast, by Application 2019 & 2032
- Table 16: Netherland Enterprise Mobility in Retail Industry Revenue (Million) Forecast, by Application 2019 & 2032
- Table 17: Nordics Enterprise Mobility in Retail Industry Revenue (Million) Forecast, by Application 2019 & 2032
- Table 18: Rest of Europe Enterprise Mobility in Retail Industry Revenue (Million) Forecast, by Application 2019 & 2032
- Table 19: Global Enterprise Mobility in Retail Industry Revenue Million Forecast, by Country 2019 & 2032
- Table 20: China Enterprise Mobility in Retail Industry Revenue (Million) Forecast, by Application 2019 & 2032
- Table 21: Japan Enterprise Mobility in Retail Industry Revenue (Million) Forecast, by Application 2019 & 2032
- Table 22: India Enterprise Mobility in Retail Industry Revenue (Million) Forecast, by Application 2019 & 2032
- Table 23: South Korea Enterprise Mobility in Retail Industry Revenue (Million) Forecast, by Application 2019 & 2032
- Table 24: Southeast Asia Enterprise Mobility in Retail Industry Revenue (Million) Forecast, by Application 2019 & 2032
- Table 25: Australia Enterprise Mobility in Retail Industry Revenue (Million) Forecast, by Application 2019 & 2032
- Table 26: Indonesia Enterprise Mobility in Retail Industry Revenue (Million) Forecast, by Application 2019 & 2032
- Table 27: Phillipes Enterprise Mobility in Retail Industry Revenue (Million) Forecast, by Application 2019 & 2032
- Table 28: Singapore Enterprise Mobility in Retail Industry Revenue (Million) Forecast, by Application 2019 & 2032
- Table 29: Thailandc Enterprise Mobility in Retail Industry Revenue (Million) Forecast, by Application 2019 & 2032
- Table 30: Rest of Asia Pacific Enterprise Mobility in Retail Industry Revenue (Million) Forecast, by Application 2019 & 2032
- Table 31: Global Enterprise Mobility in Retail Industry Revenue Million Forecast, by Country 2019 & 2032
- Table 32: Brazil Enterprise Mobility in Retail Industry Revenue (Million) Forecast, by Application 2019 & 2032
- Table 33: Argentina Enterprise Mobility in Retail Industry Revenue (Million) Forecast, by Application 2019 & 2032
- Table 34: Peru Enterprise Mobility in Retail Industry Revenue (Million) Forecast, by Application 2019 & 2032
- Table 35: Chile Enterprise Mobility in Retail Industry Revenue (Million) Forecast, by Application 2019 & 2032
- Table 36: Colombia Enterprise Mobility in Retail Industry Revenue (Million) Forecast, by Application 2019 & 2032
- Table 37: Ecuador Enterprise Mobility in Retail Industry Revenue (Million) Forecast, by Application 2019 & 2032
- Table 38: Venezuela Enterprise Mobility in Retail Industry Revenue (Million) Forecast, by Application 2019 & 2032
- Table 39: Rest of South America Enterprise Mobility in Retail Industry Revenue (Million) Forecast, by Application 2019 & 2032
- Table 40: Global Enterprise Mobility in Retail Industry Revenue Million Forecast, by Country 2019 & 2032
- Table 41: United States Enterprise Mobility in Retail Industry Revenue (Million) Forecast, by Application 2019 & 2032
- Table 42: Canada Enterprise Mobility in Retail Industry Revenue (Million) Forecast, by Application 2019 & 2032
- Table 43: Mexico Enterprise Mobility in Retail Industry Revenue (Million) Forecast, by Application 2019 & 2032
- Table 44: Global Enterprise Mobility in Retail Industry Revenue Million Forecast, by Country 2019 & 2032
- Table 45: United Arab Emirates Enterprise Mobility in Retail Industry Revenue (Million) Forecast, by Application 2019 & 2032
- Table 46: Saudi Arabia Enterprise Mobility in Retail Industry Revenue (Million) Forecast, by Application 2019 & 2032
- Table 47: South Africa Enterprise Mobility in Retail Industry Revenue (Million) Forecast, by Application 2019 & 2032
- Table 48: Rest of Middle East and Africa Enterprise Mobility in Retail Industry Revenue (Million) Forecast, by Application 2019 & 2032
- Table 49: Global Enterprise Mobility in Retail Industry Revenue Million Forecast, by Device 2019 & 2032
- Table 50: Global Enterprise Mobility in Retail Industry Revenue Million Forecast, by Country 2019 & 2032
- Table 51: Global Enterprise Mobility in Retail Industry Revenue Million Forecast, by Device 2019 & 2032
- Table 52: Global Enterprise Mobility in Retail Industry Revenue Million Forecast, by Country 2019 & 2032
- Table 53: Global Enterprise Mobility in Retail Industry Revenue Million Forecast, by Device 2019 & 2032
- Table 54: Global Enterprise Mobility in Retail Industry Revenue Million Forecast, by Country 2019 & 2032
- Table 55: Global Enterprise Mobility in Retail Industry Revenue Million Forecast, by Device 2019 & 2032
- Table 56: Global Enterprise Mobility in Retail Industry Revenue Million Forecast, by Country 2019 & 2032
- Table 57: Global Enterprise Mobility in Retail Industry Revenue Million Forecast, by Device 2019 & 2032
- Table 58: Global Enterprise Mobility in Retail Industry Revenue Million Forecast, by Country 2019 & 2032
Frequently Asked Questions
1. What is the projected Compound Annual Growth Rate (CAGR) of the Enterprise Mobility in Retail Industry?
The projected CAGR is approximately 26.25%.
2. Which companies are prominent players in the Enterprise Mobility in Retail Industry?
Key companies in the market include Workspot Inc , MobileIron Inc, IBM Corporation, Brainvire Infotech Inc, Cisco Systems Inc, Microsoft Corporation, Credencys Solutions Inc, InnoMind Technologies, Gizmeon Inc, VMware Inc, Citrix Systems Inc, SAP SE, Sonata Software.
3. What are the main segments of the Enterprise Mobility in Retail Industry?
The market segments include Device.
4. Can you provide details about the market size?
The market size is estimated to be USD XX Million as of 2022.
5. What are some drivers contributing to market growth?
; Substantial Growth in E-commerce; Increasing Adoption of Bring-your-own-device (BYOD).
6. What are the notable trends driving market growth?
Substantial Growth in E-commerce to Spearhead the Growth.
7. Are there any restraints impacting market growth?
; Security Concerns.
8. Can you provide examples of recent developments in the market?
N/A
9. What pricing options are available for accessing the report?
Pricing options include single-user, multi-user, and enterprise licenses priced at USD 4750, USD 5250, and USD 8750 respectively.
10. Is the market size provided in terms of value or volume?
The market size is provided in terms of value, measured in Million.
11. Are there any specific market keywords associated with the report?
Yes, the market keyword associated with the report is "Enterprise Mobility in Retail Industry," which aids in identifying and referencing the specific market segment covered.
12. How do I determine which pricing option suits my needs best?
The pricing options vary based on user requirements and access needs. Individual users may opt for single-user licenses, while businesses requiring broader access may choose multi-user or enterprise licenses for cost-effective access to the report.
13. Are there any additional resources or data provided in the Enterprise Mobility in Retail Industry report?
While the report offers comprehensive insights, it's advisable to review the specific contents or supplementary materials provided to ascertain if additional resources or data are available.
14. How can I stay updated on further developments or reports in the Enterprise Mobility in Retail Industry?
To stay informed about further developments, trends, and reports in the Enterprise Mobility in Retail Industry, consider subscribing to industry newsletters, following relevant companies and organizations, or regularly checking reputable industry news sources and publications.
Methodology
Step 1 - Identification of Relevant Samples Size from Population Database


Step 2 - Approaches for Defining Global Market Size (Value, Volume* & Price*)

Note*: In applicable scenarios
Step 3 - Data Sources
Primary Research
- Web Analytics
- Survey Reports
- Research Institute
- Latest Research Reports
- Opinion Leaders
Secondary Research
- Annual Reports
- White Paper
- Latest Press Release
- Industry Association
- Paid Database
- Investor Presentations

Step 4 - Data Triangulation
Involves using different sources of information in order to increase the validity of a study
These sources are likely to be stakeholders in a program - participants, other researchers, program staff, other community members, and so on.
Then we put all data in single framework & apply various statistical tools to find out the dynamic on the market.
During the analysis stage, feedback from the stakeholder groups would be compared to determine areas of agreement as well as areas of divergence
