

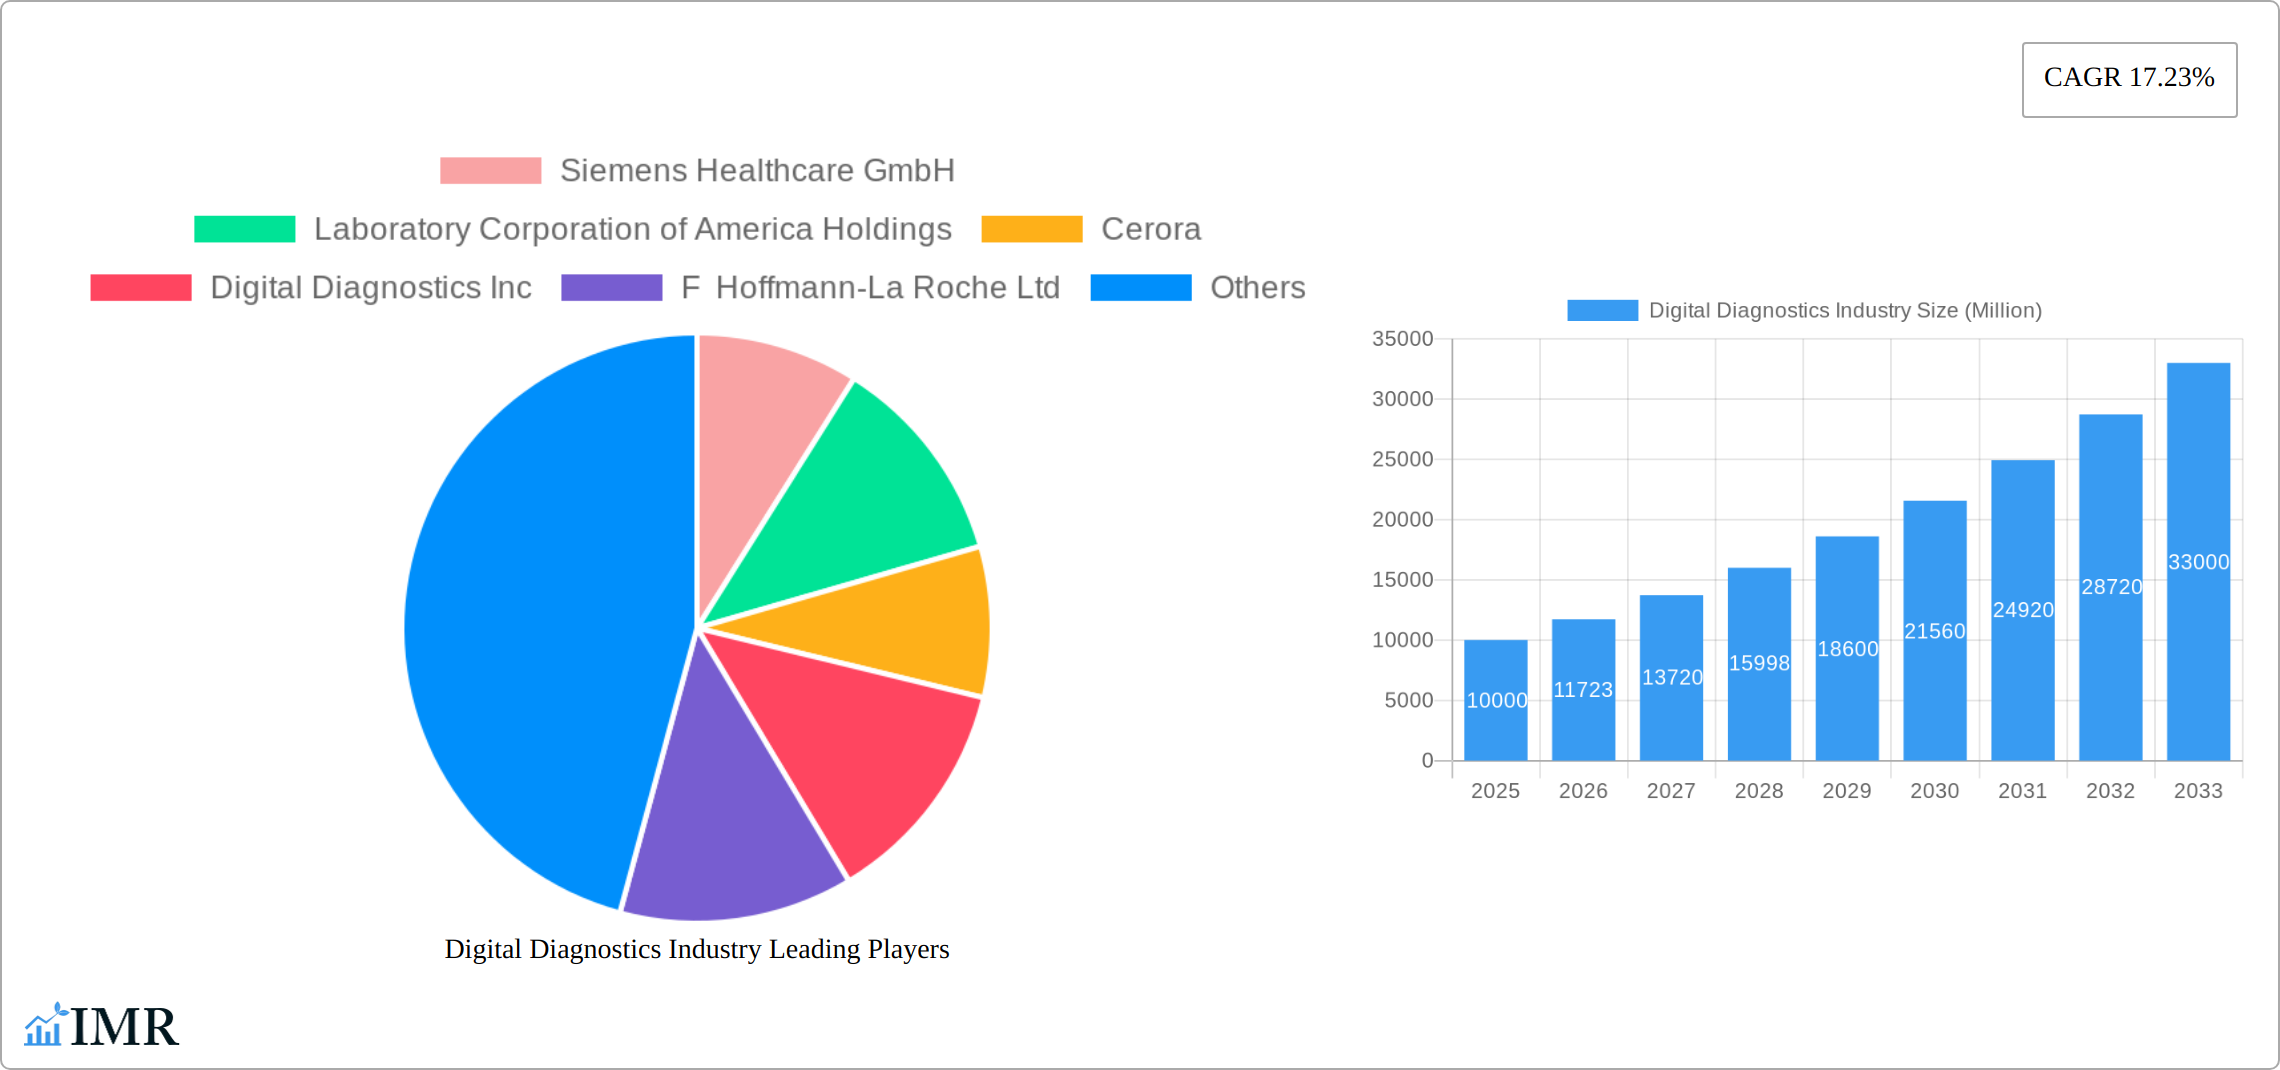
Key Insights
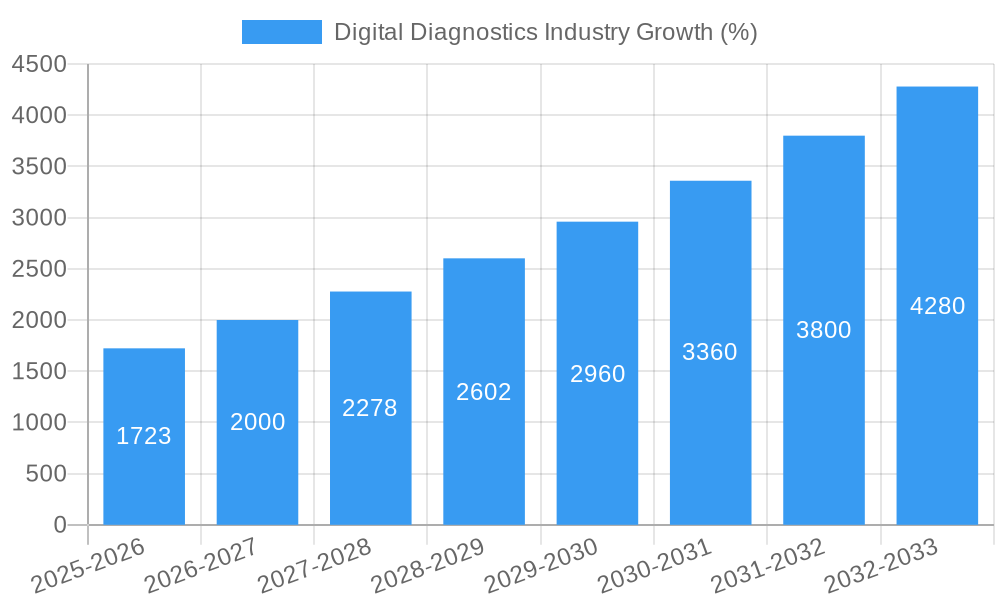
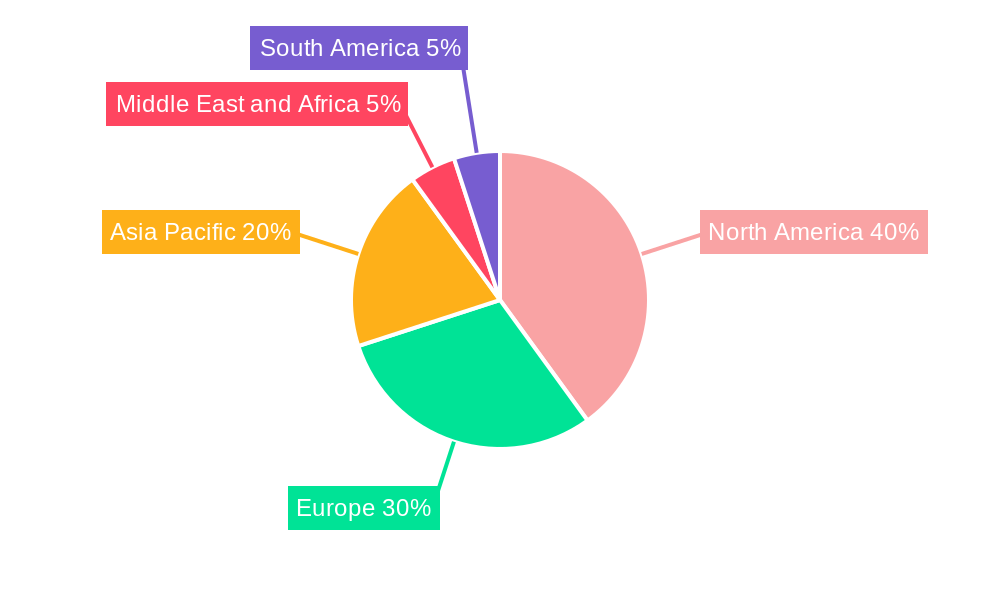
The digital diagnostics market is experiencing robust growth, projected to reach a substantial size by 2033, driven by a 17.23% Compound Annual Growth Rate (CAGR) from 2025 to 2033. This expansion is fueled by several key factors. Technological advancements, such as artificial intelligence (AI) and machine learning (ML) integrated into diagnostic tools, are significantly improving accuracy, speed, and efficiency. The rising prevalence of chronic diseases globally necessitates faster and more precise diagnostic solutions, thus boosting demand for digital diagnostics. Furthermore, the increasing adoption of telemedicine and remote patient monitoring systems facilitates the integration of digital diagnostic tools into remote healthcare settings, contributing to wider accessibility and usage. Government initiatives promoting digital healthcare infrastructure and investment in research and development further accelerate market growth. The market is segmented by product (hardware, software, services), diagnosis type (cardiology, oncology, neurology, radiology, pathology, others), and end-user (hospitals and clinics, clinical laboratories, others). While the North American market currently holds a significant share, Asia-Pacific is expected to witness substantial growth due to increasing healthcare spending and technological adoption in developing economies. However, challenges remain, including high initial investment costs for advanced technologies, data security and privacy concerns, and the need for regulatory approvals and standardization. Competition among established players and emerging companies continues to intensify, driving innovation and pushing down costs in the long run.
The dominance of established players like Siemens Healthcare, Roche, and GE Healthcare is being challenged by the emergence of innovative technology companies focusing on specific niche areas within digital diagnostics. This competitive landscape fosters innovation and drives the development of more sophisticated and affordable diagnostic solutions. The market's future hinges on continuous technological advancements, regulatory compliance, and overcoming the challenges related to data security and interoperability. Focus on improving user-friendliness and training programs for healthcare professionals will be crucial to ensure the widespread adoption and integration of these technologies across various healthcare settings. Ultimately, the growing need for efficient, precise, and accessible diagnostics will sustain the market's robust growth trajectory throughout the forecast period.
Digital Diagnostics Industry Market Report: 2019-2033
This comprehensive report provides an in-depth analysis of the Digital Diagnostics market, encompassing market dynamics, growth trends, regional performance, product landscape, key challenges, and emerging opportunities. The study period covers 2019-2033, with 2025 as the base and estimated year. The report forecasts market trends from 2025-2033, utilizing data from the historical period (2019-2024). This report is invaluable for industry professionals, investors, and strategists seeking a complete understanding of this rapidly evolving sector. The parent market is the broader healthcare diagnostics industry, while the child market is specifically focused on digital technologies within diagnostics.
Digital Diagnostics Industry Market Dynamics & Structure
The digital diagnostics market is experiencing robust growth, driven by technological advancements, increasing prevalence of chronic diseases, and rising demand for efficient healthcare solutions. Market concentration is moderately high, with several large players like Siemens Healthcare and Roche holding significant shares, alongside a growing number of smaller, specialized companies. Technological innovation, particularly in AI and machine learning, is a key driver, improving diagnostic accuracy and speed. Regulatory frameworks, varying across regions, play a crucial role in shaping market access and product approvals. The market faces competition from traditional diagnostic methods, but the advantages of speed, accuracy, and accessibility offered by digital diagnostics are increasingly favored. End-user demographics are shifting towards an older, more tech-savvy population comfortable utilizing digital health solutions. M&A activity is prevalent, with approximately xx deals recorded in the past five years, indicating ongoing consolidation and expansion within the sector.
- Market Concentration: Moderately high, with top 5 players holding approximately xx% market share in 2024.
- Technological Innovation: AI, machine learning, and cloud computing are major drivers of growth.
- Regulatory Landscape: Stringent regulatory approvals in certain regions pose a barrier to entry.
- Competitive Substitutes: Traditional diagnostic methods pose a competitive threat, but it is diminishing.
- End-User Demographics: Aging population and increasing technological literacy are driving demand.
- M&A Trends: xx M&A deals recorded in the last five years, signifying industry consolidation.
Digital Diagnostics Industry Growth Trends & Insights
The global digital diagnostics market is projected to experience significant growth throughout the forecast period. Driven by factors such as the rising prevalence of chronic diseases, increasing demand for faster and more accurate diagnostic solutions, and technological advancements, the market size is expected to reach xx million units by 2033. The Compound Annual Growth Rate (CAGR) during this period is estimated at xx%. Market penetration is increasing steadily, particularly in developed economies where access to advanced technology is higher. Technological disruptions, such as the integration of artificial intelligence and machine learning in diagnostic tools, are revolutionizing the industry and boosting efficiency. Changes in consumer behavior are also influencing market growth, with an increasing preference for convenient and accessible digital health solutions.
Dominant Regions, Countries, or Segments in Digital Diagnostics Industry
The digital diagnostics industry is experiencing robust growth, with North America currently holding the largest market share. This dominance is fueled by substantial healthcare expenditure, advanced technological infrastructure, and a strong presence of established industry players, particularly within the United States. Europe also presents a significant growth opportunity, driven by supportive government initiatives promoting digital health adoption and a burgeoning market for innovative technologies. The Asia-Pacific region is showing rapid expansion, driven by increasing healthcare spending and a rising prevalence of chronic diseases.
Market Segmentation Analysis:
By Product: The software segment is exhibiting accelerated growth compared to hardware, attributed to its inherent scalability, cost-effectiveness, and adaptability to diverse diagnostic applications. The services sector, encompassing crucial areas like data analytics, AI-powered diagnostics, and remote patient monitoring, is also demonstrating strong upward trends.
By Diagnosis Type: Cardiology and oncology remain leading segments due to the high prevalence of these conditions and the critical need for precise, timely, and cost-effective diagnostic solutions. However, growth is also seen in other areas such as neurology, infectious disease diagnostics, and personalized medicine applications.
By End User: Hospitals and clinics constitute the largest end-user segment, adopting digital tools to streamline workflows, improve patient care, and enhance operational efficiency. Clinical laboratories, research institutions, and home healthcare settings are also increasingly incorporating digital diagnostic solutions.
- North America: High healthcare expenditure, advanced infrastructure, and a robust ecosystem of market players drive significant growth.
- Europe: Supportive government policies, rising digital health adoption, and a focus on interoperability contribute to market expansion.
- Asia-Pacific: Rapid growth driven by increasing healthcare spending, rising prevalence of chronic diseases, and expanding digital infrastructure.
- Software Segment: Rapid growth due to scalability, cost-effectiveness, and integration capabilities.
- Cardiology and Oncology: Leading diagnosis segments due to high prevalence and critical diagnostic needs.
- Hospitals and Clinics: Dominant end-user segment focused on improved efficiency and patient outcomes.
Digital Diagnostics Industry Product Landscape
The digital diagnostics product landscape is characterized by a wide array of innovative solutions, including advanced imaging systems, AI-powered diagnostic tools, and cloud-based platforms for data management and analysis. These products offer improved accuracy, speed, and efficiency compared to traditional diagnostic methods. Many vendors are focusing on developing user-friendly interfaces, seamless integration with existing healthcare systems, and comprehensive data analytics capabilities. The unique selling propositions often involve enhanced diagnostic accuracy, reduced turnaround times, and cost-effectiveness. Key technological advancements include AI-powered image analysis, advanced sensor technologies, and miniaturization of diagnostic devices.
Key Drivers, Barriers & Challenges in Digital Diagnostics Industry
Key Drivers:
- Technological advancements: AI, machine learning, and big data analytics are revolutionizing diagnostics.
- Rising prevalence of chronic diseases: Increased need for timely and accurate diagnosis.
- Growing demand for improved healthcare efficiency: Digital solutions streamline workflows and reduce costs.
Key Challenges:
- High initial investment costs: Purchase and implementation can be expensive for smaller facilities.
- Data security and privacy concerns: Protecting sensitive patient data is crucial.
- Regulatory hurdles: Stringent approval processes can delay product launches.
- Integration challenges: Seamless integration with existing systems remains a challenge for some vendors.
Emerging Opportunities in Digital Diagnostics Industry
- Expansion into underserved markets: Addressing healthcare disparities by providing access to advanced diagnostics in remote and low-resource settings through telemedicine and point-of-care solutions.
- Development of point-of-care diagnostics: Delivering rapid, convenient, and cost-effective testing at the patient's bedside or in decentralized locations, enabling faster diagnosis and treatment initiation.
- Integration of wearable sensors and IoT devices: Enabling continuous remote patient monitoring, early disease detection, and proactive intervention strategies to improve patient outcomes and reduce healthcare costs.
- Personalized medicine applications: Tailoring diagnostic tests and treatment plans to individual patient characteristics, genetics, and lifestyle factors, leading to improved efficacy and reduced adverse events.
- Artificial Intelligence (AI) and Machine Learning (ML) integration: Enhancing diagnostic accuracy, speed, and efficiency through image analysis, predictive modeling, and automated reporting.
Growth Accelerators in the Digital Diagnostics Industry
Several factors are propelling the growth of the digital diagnostics market. Technological advancements, particularly in AI and machine learning, are significantly enhancing diagnostic accuracy and efficiency. Strategic collaborations between technology companies and healthcare providers are fostering market penetration and accelerating the adoption of innovative solutions. Furthermore, a growing emphasis on preventative care and early disease detection, coupled with supportive regulatory frameworks, is creating a favorable environment for market expansion.
Key Players Shaping the Digital Diagnostics Industry Market
- Siemens Healthcare GmbH
- Laboratory Corporation of America Holdings
- Cerora
- Digital Diagnostics Inc
- F Hoffmann-La Roche Ltd
- GE Healthcare
- Vuno Inc
- Midmark Corporation
- Nanox Imaging Ltd
- Novasignal Corporation
- Riverain Technologies
- ThermoFisher Scientific Inc
Notable Milestones in Digital Diagnostics Industry Sector
- May 2022: TestCard secures USD 10 million in funding to commercialize existing products and launch new tests (diabetes, pregnancy, CKD, flu).
- February 2022: Labcorp launches Labcorp OnDemand, an online platform for test ordering and home sample collection.
In-Depth Digital Diagnostics Industry Market Outlook
The future of the digital diagnostics market is exceptionally bright. Continued technological innovation, rising healthcare expenditure globally, and an increasing demand for convenient, accessible, and cost-effective healthcare solutions will drive sustained market expansion. Strategic partnerships, product diversification, expansion into emerging markets, and a focus on improving patient outcomes will further fuel growth, creating numerous opportunities for existing and new market players. The integration of AI and big data analytics will play a pivotal role in shaping the future of this rapidly evolving sector.
Digital Diagnostics Industry Segmentation
-
1. Product
- 1.1. Hardware
- 1.2. Software
- 1.3. Services
-
2. Diagnosis Type
- 2.1. Cardiology
- 2.2. Oncology
- 2.3. Neurology
- 2.4. Radiology
- 2.5. Pathology
- 2.6. Others
-
3. End User
- 3.1. Hospitals and Clinics
- 3.2. Clinical Laboratories
- 3.3. Others
Digital Diagnostics Industry Segmentation By Geography
-
1. North America
- 1.1. United States
- 1.2. Canada
- 1.3. Mexico
-
2. Europe
- 2.1. Germany
- 2.2. United Kingdom
- 2.3. France
- 2.4. Italy
- 2.5. Spain
- 2.6. Rest of Europe
-
3. Asia Pacific
- 3.1. China
- 3.2. Japan
- 3.3. India
- 3.4. Australia
- 3.5. South Korea
- 3.6. Rest of Asia Pacific
-
4. Middle East and Africa
- 4.1. GCC
- 4.2. South Africa
- 4.3. Rest of Middle East and Africa
-
5. South America
- 5.1. Brazil
- 5.2. Argentina
- 5.3. Rest of South America
Digital Diagnostics Industry REPORT HIGHLIGHTS
| Aspects | Details |
|---|---|
| Study Period | 2019-2033 |
| Base Year | 2024 |
| Estimated Year | 2025 |
| Forecast Period | 2025-2033 |
| Historical Period | 2019-2024 |
| Growth Rate | CAGR of 17.23% from 2019-2033 |
| Segmentation |
|
Table of Contents
- 1. Introduction
- 1.1. Research Scope
- 1.2. Market Segmentation
- 1.3. Research Methodology
- 1.4. Definitions and Assumptions
- 2. Executive Summary
- 2.1. Introduction
- 3. Market Dynamics
- 3.1. Introduction
- 3.2. Market Drivers
- 3.2.1. Rising Adoption of Digitalization in Chronic Disease Management; Increasing Burden of Chronic Diseases
- 3.3. Market Restrains
- 3.3.1. High Cost of Instruments
- 3.4. Market Trends
- 3.4.1. Oncology Segment is Expected to Account for the Large Market Share During the Forecast Period
- 4. Market Factor Analysis
- 4.1. Porters Five Forces
- 4.2. Supply/Value Chain
- 4.3. PESTEL analysis
- 4.4. Market Entropy
- 4.5. Patent/Trademark Analysis
- 5. Global Digital Diagnostics Industry Analysis, Insights and Forecast, 2019-2031
- 5.1. Market Analysis, Insights and Forecast - by Product
- 5.1.1. Hardware
- 5.1.2. Software
- 5.1.3. Services
- 5.2. Market Analysis, Insights and Forecast - by Diagnosis Type
- 5.2.1. Cardiology
- 5.2.2. Oncology
- 5.2.3. Neurology
- 5.2.4. Radiology
- 5.2.5. Pathology
- 5.2.6. Others
- 5.3. Market Analysis, Insights and Forecast - by End User
- 5.3.1. Hospitals and Clinics
- 5.3.2. Clinical Laboratories
- 5.3.3. Others
- 5.4. Market Analysis, Insights and Forecast - by Region
- 5.4.1. North America
- 5.4.2. Europe
- 5.4.3. Asia Pacific
- 5.4.4. Middle East and Africa
- 5.4.5. South America
- 5.1. Market Analysis, Insights and Forecast - by Product
- 6. North America Digital Diagnostics Industry Analysis, Insights and Forecast, 2019-2031
- 6.1. Market Analysis, Insights and Forecast - by Product
- 6.1.1. Hardware
- 6.1.2. Software
- 6.1.3. Services
- 6.2. Market Analysis, Insights and Forecast - by Diagnosis Type
- 6.2.1. Cardiology
- 6.2.2. Oncology
- 6.2.3. Neurology
- 6.2.4. Radiology
- 6.2.5. Pathology
- 6.2.6. Others
- 6.3. Market Analysis, Insights and Forecast - by End User
- 6.3.1. Hospitals and Clinics
- 6.3.2. Clinical Laboratories
- 6.3.3. Others
- 6.1. Market Analysis, Insights and Forecast - by Product
- 7. Europe Digital Diagnostics Industry Analysis, Insights and Forecast, 2019-2031
- 7.1. Market Analysis, Insights and Forecast - by Product
- 7.1.1. Hardware
- 7.1.2. Software
- 7.1.3. Services
- 7.2. Market Analysis, Insights and Forecast - by Diagnosis Type
- 7.2.1. Cardiology
- 7.2.2. Oncology
- 7.2.3. Neurology
- 7.2.4. Radiology
- 7.2.5. Pathology
- 7.2.6. Others
- 7.3. Market Analysis, Insights and Forecast - by End User
- 7.3.1. Hospitals and Clinics
- 7.3.2. Clinical Laboratories
- 7.3.3. Others
- 7.1. Market Analysis, Insights and Forecast - by Product
- 8. Asia Pacific Digital Diagnostics Industry Analysis, Insights and Forecast, 2019-2031
- 8.1. Market Analysis, Insights and Forecast - by Product
- 8.1.1. Hardware
- 8.1.2. Software
- 8.1.3. Services
- 8.2. Market Analysis, Insights and Forecast - by Diagnosis Type
- 8.2.1. Cardiology
- 8.2.2. Oncology
- 8.2.3. Neurology
- 8.2.4. Radiology
- 8.2.5. Pathology
- 8.2.6. Others
- 8.3. Market Analysis, Insights and Forecast - by End User
- 8.3.1. Hospitals and Clinics
- 8.3.2. Clinical Laboratories
- 8.3.3. Others
- 8.1. Market Analysis, Insights and Forecast - by Product
- 9. Middle East and Africa Digital Diagnostics Industry Analysis, Insights and Forecast, 2019-2031
- 9.1. Market Analysis, Insights and Forecast - by Product
- 9.1.1. Hardware
- 9.1.2. Software
- 9.1.3. Services
- 9.2. Market Analysis, Insights and Forecast - by Diagnosis Type
- 9.2.1. Cardiology
- 9.2.2. Oncology
- 9.2.3. Neurology
- 9.2.4. Radiology
- 9.2.5. Pathology
- 9.2.6. Others
- 9.3. Market Analysis, Insights and Forecast - by End User
- 9.3.1. Hospitals and Clinics
- 9.3.2. Clinical Laboratories
- 9.3.3. Others
- 9.1. Market Analysis, Insights and Forecast - by Product
- 10. South America Digital Diagnostics Industry Analysis, Insights and Forecast, 2019-2031
- 10.1. Market Analysis, Insights and Forecast - by Product
- 10.1.1. Hardware
- 10.1.2. Software
- 10.1.3. Services
- 10.2. Market Analysis, Insights and Forecast - by Diagnosis Type
- 10.2.1. Cardiology
- 10.2.2. Oncology
- 10.2.3. Neurology
- 10.2.4. Radiology
- 10.2.5. Pathology
- 10.2.6. Others
- 10.3. Market Analysis, Insights and Forecast - by End User
- 10.3.1. Hospitals and Clinics
- 10.3.2. Clinical Laboratories
- 10.3.3. Others
- 10.1. Market Analysis, Insights and Forecast - by Product
- 11. North America Digital Diagnostics Industry Analysis, Insights and Forecast, 2019-2031
- 11.1. Market Analysis, Insights and Forecast - By Country/Sub-region
- 11.1.1 United States
- 11.1.2 Canada
- 11.1.3 Mexico
- 12. Europe Digital Diagnostics Industry Analysis, Insights and Forecast, 2019-2031
- 12.1. Market Analysis, Insights and Forecast - By Country/Sub-region
- 12.1.1 Germany
- 12.1.2 United Kingdom
- 12.1.3 France
- 12.1.4 Italy
- 12.1.5 Spain
- 12.1.6 Rest of Europe
- 13. Asia Pacific Digital Diagnostics Industry Analysis, Insights and Forecast, 2019-2031
- 13.1. Market Analysis, Insights and Forecast - By Country/Sub-region
- 13.1.1 China
- 13.1.2 Japan
- 13.1.3 India
- 13.1.4 Australia
- 13.1.5 South Korea
- 13.1.6 Rest of Asia Pacific
- 14. Middle East and Africa Digital Diagnostics Industry Analysis, Insights and Forecast, 2019-2031
- 14.1. Market Analysis, Insights and Forecast - By Country/Sub-region
- 14.1.1 GCC
- 14.1.2 South Africa
- 14.1.3 Rest of Middle East and Africa
- 15. South America Digital Diagnostics Industry Analysis, Insights and Forecast, 2019-2031
- 15.1. Market Analysis, Insights and Forecast - By Country/Sub-region
- 15.1.1 Brazil
- 15.1.2 Argentina
- 15.1.3 Rest of South America
- 16. Competitive Analysis
- 16.1. Global Market Share Analysis 2024
- 16.2. Company Profiles
- 16.2.1 Siemens Healthcare GmbH
- 16.2.1.1. Overview
- 16.2.1.2. Products
- 16.2.1.3. SWOT Analysis
- 16.2.1.4. Recent Developments
- 16.2.1.5. Financials (Based on Availability)
- 16.2.2 Laboratory Corporation of America Holdings
- 16.2.2.1. Overview
- 16.2.2.2. Products
- 16.2.2.3. SWOT Analysis
- 16.2.2.4. Recent Developments
- 16.2.2.5. Financials (Based on Availability)
- 16.2.3 Cerora
- 16.2.3.1. Overview
- 16.2.3.2. Products
- 16.2.3.3. SWOT Analysis
- 16.2.3.4. Recent Developments
- 16.2.3.5. Financials (Based on Availability)
- 16.2.4 Digital Diagnostics Inc
- 16.2.4.1. Overview
- 16.2.4.2. Products
- 16.2.4.3. SWOT Analysis
- 16.2.4.4. Recent Developments
- 16.2.4.5. Financials (Based on Availability)
- 16.2.5 F Hoffmann-La Roche Ltd
- 16.2.5.1. Overview
- 16.2.5.2. Products
- 16.2.5.3. SWOT Analysis
- 16.2.5.4. Recent Developments
- 16.2.5.5. Financials (Based on Availability)
- 16.2.6 GE Healthcare
- 16.2.6.1. Overview
- 16.2.6.2. Products
- 16.2.6.3. SWOT Analysis
- 16.2.6.4. Recent Developments
- 16.2.6.5. Financials (Based on Availability)
- 16.2.7 Vuno Inc
- 16.2.7.1. Overview
- 16.2.7.2. Products
- 16.2.7.3. SWOT Analysis
- 16.2.7.4. Recent Developments
- 16.2.7.5. Financials (Based on Availability)
- 16.2.8 Midmark Corporation
- 16.2.8.1. Overview
- 16.2.8.2. Products
- 16.2.8.3. SWOT Analysis
- 16.2.8.4. Recent Developments
- 16.2.8.5. Financials (Based on Availability)
- 16.2.9 Nanox Imaging Ltd
- 16.2.9.1. Overview
- 16.2.9.2. Products
- 16.2.9.3. SWOT Analysis
- 16.2.9.4. Recent Developments
- 16.2.9.5. Financials (Based on Availability)
- 16.2.10 Novasignal Corporation
- 16.2.10.1. Overview
- 16.2.10.2. Products
- 16.2.10.3. SWOT Analysis
- 16.2.10.4. Recent Developments
- 16.2.10.5. Financials (Based on Availability)
- 16.2.11 Riverain Technologies
- 16.2.11.1. Overview
- 16.2.11.2. Products
- 16.2.11.3. SWOT Analysis
- 16.2.11.4. Recent Developments
- 16.2.11.5. Financials (Based on Availability)
- 16.2.12 ThermoFisher Scientific Inc
- 16.2.12.1. Overview
- 16.2.12.2. Products
- 16.2.12.3. SWOT Analysis
- 16.2.12.4. Recent Developments
- 16.2.12.5. Financials (Based on Availability)
- 16.2.1 Siemens Healthcare GmbH
List of Figures
- Figure 1: Global Digital Diagnostics Industry Revenue Breakdown (Million, %) by Region 2024 & 2032
- Figure 2: Global Digital Diagnostics Industry Volume Breakdown (K Unit, %) by Region 2024 & 2032
- Figure 3: North America Digital Diagnostics Industry Revenue (Million), by Country 2024 & 2032
- Figure 4: North America Digital Diagnostics Industry Volume (K Unit), by Country 2024 & 2032
- Figure 5: North America Digital Diagnostics Industry Revenue Share (%), by Country 2024 & 2032
- Figure 6: North America Digital Diagnostics Industry Volume Share (%), by Country 2024 & 2032
- Figure 7: Europe Digital Diagnostics Industry Revenue (Million), by Country 2024 & 2032
- Figure 8: Europe Digital Diagnostics Industry Volume (K Unit), by Country 2024 & 2032
- Figure 9: Europe Digital Diagnostics Industry Revenue Share (%), by Country 2024 & 2032
- Figure 10: Europe Digital Diagnostics Industry Volume Share (%), by Country 2024 & 2032
- Figure 11: Asia Pacific Digital Diagnostics Industry Revenue (Million), by Country 2024 & 2032
- Figure 12: Asia Pacific Digital Diagnostics Industry Volume (K Unit), by Country 2024 & 2032
- Figure 13: Asia Pacific Digital Diagnostics Industry Revenue Share (%), by Country 2024 & 2032
- Figure 14: Asia Pacific Digital Diagnostics Industry Volume Share (%), by Country 2024 & 2032
- Figure 15: Middle East and Africa Digital Diagnostics Industry Revenue (Million), by Country 2024 & 2032
- Figure 16: Middle East and Africa Digital Diagnostics Industry Volume (K Unit), by Country 2024 & 2032
- Figure 17: Middle East and Africa Digital Diagnostics Industry Revenue Share (%), by Country 2024 & 2032
- Figure 18: Middle East and Africa Digital Diagnostics Industry Volume Share (%), by Country 2024 & 2032
- Figure 19: South America Digital Diagnostics Industry Revenue (Million), by Country 2024 & 2032
- Figure 20: South America Digital Diagnostics Industry Volume (K Unit), by Country 2024 & 2032
- Figure 21: South America Digital Diagnostics Industry Revenue Share (%), by Country 2024 & 2032
- Figure 22: South America Digital Diagnostics Industry Volume Share (%), by Country 2024 & 2032
- Figure 23: North America Digital Diagnostics Industry Revenue (Million), by Product 2024 & 2032
- Figure 24: North America Digital Diagnostics Industry Volume (K Unit), by Product 2024 & 2032
- Figure 25: North America Digital Diagnostics Industry Revenue Share (%), by Product 2024 & 2032
- Figure 26: North America Digital Diagnostics Industry Volume Share (%), by Product 2024 & 2032
- Figure 27: North America Digital Diagnostics Industry Revenue (Million), by Diagnosis Type 2024 & 2032
- Figure 28: North America Digital Diagnostics Industry Volume (K Unit), by Diagnosis Type 2024 & 2032
- Figure 29: North America Digital Diagnostics Industry Revenue Share (%), by Diagnosis Type 2024 & 2032
- Figure 30: North America Digital Diagnostics Industry Volume Share (%), by Diagnosis Type 2024 & 2032
- Figure 31: North America Digital Diagnostics Industry Revenue (Million), by End User 2024 & 2032
- Figure 32: North America Digital Diagnostics Industry Volume (K Unit), by End User 2024 & 2032
- Figure 33: North America Digital Diagnostics Industry Revenue Share (%), by End User 2024 & 2032
- Figure 34: North America Digital Diagnostics Industry Volume Share (%), by End User 2024 & 2032
- Figure 35: North America Digital Diagnostics Industry Revenue (Million), by Country 2024 & 2032
- Figure 36: North America Digital Diagnostics Industry Volume (K Unit), by Country 2024 & 2032
- Figure 37: North America Digital Diagnostics Industry Revenue Share (%), by Country 2024 & 2032
- Figure 38: North America Digital Diagnostics Industry Volume Share (%), by Country 2024 & 2032
- Figure 39: Europe Digital Diagnostics Industry Revenue (Million), by Product 2024 & 2032
- Figure 40: Europe Digital Diagnostics Industry Volume (K Unit), by Product 2024 & 2032
- Figure 41: Europe Digital Diagnostics Industry Revenue Share (%), by Product 2024 & 2032
- Figure 42: Europe Digital Diagnostics Industry Volume Share (%), by Product 2024 & 2032
- Figure 43: Europe Digital Diagnostics Industry Revenue (Million), by Diagnosis Type 2024 & 2032
- Figure 44: Europe Digital Diagnostics Industry Volume (K Unit), by Diagnosis Type 2024 & 2032
- Figure 45: Europe Digital Diagnostics Industry Revenue Share (%), by Diagnosis Type 2024 & 2032
- Figure 46: Europe Digital Diagnostics Industry Volume Share (%), by Diagnosis Type 2024 & 2032
- Figure 47: Europe Digital Diagnostics Industry Revenue (Million), by End User 2024 & 2032
- Figure 48: Europe Digital Diagnostics Industry Volume (K Unit), by End User 2024 & 2032
- Figure 49: Europe Digital Diagnostics Industry Revenue Share (%), by End User 2024 & 2032
- Figure 50: Europe Digital Diagnostics Industry Volume Share (%), by End User 2024 & 2032
- Figure 51: Europe Digital Diagnostics Industry Revenue (Million), by Country 2024 & 2032
- Figure 52: Europe Digital Diagnostics Industry Volume (K Unit), by Country 2024 & 2032
- Figure 53: Europe Digital Diagnostics Industry Revenue Share (%), by Country 2024 & 2032
- Figure 54: Europe Digital Diagnostics Industry Volume Share (%), by Country 2024 & 2032
- Figure 55: Asia Pacific Digital Diagnostics Industry Revenue (Million), by Product 2024 & 2032
- Figure 56: Asia Pacific Digital Diagnostics Industry Volume (K Unit), by Product 2024 & 2032
- Figure 57: Asia Pacific Digital Diagnostics Industry Revenue Share (%), by Product 2024 & 2032
- Figure 58: Asia Pacific Digital Diagnostics Industry Volume Share (%), by Product 2024 & 2032
- Figure 59: Asia Pacific Digital Diagnostics Industry Revenue (Million), by Diagnosis Type 2024 & 2032
- Figure 60: Asia Pacific Digital Diagnostics Industry Volume (K Unit), by Diagnosis Type 2024 & 2032
- Figure 61: Asia Pacific Digital Diagnostics Industry Revenue Share (%), by Diagnosis Type 2024 & 2032
- Figure 62: Asia Pacific Digital Diagnostics Industry Volume Share (%), by Diagnosis Type 2024 & 2032
- Figure 63: Asia Pacific Digital Diagnostics Industry Revenue (Million), by End User 2024 & 2032
- Figure 64: Asia Pacific Digital Diagnostics Industry Volume (K Unit), by End User 2024 & 2032
- Figure 65: Asia Pacific Digital Diagnostics Industry Revenue Share (%), by End User 2024 & 2032
- Figure 66: Asia Pacific Digital Diagnostics Industry Volume Share (%), by End User 2024 & 2032
- Figure 67: Asia Pacific Digital Diagnostics Industry Revenue (Million), by Country 2024 & 2032
- Figure 68: Asia Pacific Digital Diagnostics Industry Volume (K Unit), by Country 2024 & 2032
- Figure 69: Asia Pacific Digital Diagnostics Industry Revenue Share (%), by Country 2024 & 2032
- Figure 70: Asia Pacific Digital Diagnostics Industry Volume Share (%), by Country 2024 & 2032
- Figure 71: Middle East and Africa Digital Diagnostics Industry Revenue (Million), by Product 2024 & 2032
- Figure 72: Middle East and Africa Digital Diagnostics Industry Volume (K Unit), by Product 2024 & 2032
- Figure 73: Middle East and Africa Digital Diagnostics Industry Revenue Share (%), by Product 2024 & 2032
- Figure 74: Middle East and Africa Digital Diagnostics Industry Volume Share (%), by Product 2024 & 2032
- Figure 75: Middle East and Africa Digital Diagnostics Industry Revenue (Million), by Diagnosis Type 2024 & 2032
- Figure 76: Middle East and Africa Digital Diagnostics Industry Volume (K Unit), by Diagnosis Type 2024 & 2032
- Figure 77: Middle East and Africa Digital Diagnostics Industry Revenue Share (%), by Diagnosis Type 2024 & 2032
- Figure 78: Middle East and Africa Digital Diagnostics Industry Volume Share (%), by Diagnosis Type 2024 & 2032
- Figure 79: Middle East and Africa Digital Diagnostics Industry Revenue (Million), by End User 2024 & 2032
- Figure 80: Middle East and Africa Digital Diagnostics Industry Volume (K Unit), by End User 2024 & 2032
- Figure 81: Middle East and Africa Digital Diagnostics Industry Revenue Share (%), by End User 2024 & 2032
- Figure 82: Middle East and Africa Digital Diagnostics Industry Volume Share (%), by End User 2024 & 2032
- Figure 83: Middle East and Africa Digital Diagnostics Industry Revenue (Million), by Country 2024 & 2032
- Figure 84: Middle East and Africa Digital Diagnostics Industry Volume (K Unit), by Country 2024 & 2032
- Figure 85: Middle East and Africa Digital Diagnostics Industry Revenue Share (%), by Country 2024 & 2032
- Figure 86: Middle East and Africa Digital Diagnostics Industry Volume Share (%), by Country 2024 & 2032
- Figure 87: South America Digital Diagnostics Industry Revenue (Million), by Product 2024 & 2032
- Figure 88: South America Digital Diagnostics Industry Volume (K Unit), by Product 2024 & 2032
- Figure 89: South America Digital Diagnostics Industry Revenue Share (%), by Product 2024 & 2032
- Figure 90: South America Digital Diagnostics Industry Volume Share (%), by Product 2024 & 2032
- Figure 91: South America Digital Diagnostics Industry Revenue (Million), by Diagnosis Type 2024 & 2032
- Figure 92: South America Digital Diagnostics Industry Volume (K Unit), by Diagnosis Type 2024 & 2032
- Figure 93: South America Digital Diagnostics Industry Revenue Share (%), by Diagnosis Type 2024 & 2032
- Figure 94: South America Digital Diagnostics Industry Volume Share (%), by Diagnosis Type 2024 & 2032
- Figure 95: South America Digital Diagnostics Industry Revenue (Million), by End User 2024 & 2032
- Figure 96: South America Digital Diagnostics Industry Volume (K Unit), by End User 2024 & 2032
- Figure 97: South America Digital Diagnostics Industry Revenue Share (%), by End User 2024 & 2032
- Figure 98: South America Digital Diagnostics Industry Volume Share (%), by End User 2024 & 2032
- Figure 99: South America Digital Diagnostics Industry Revenue (Million), by Country 2024 & 2032
- Figure 100: South America Digital Diagnostics Industry Volume (K Unit), by Country 2024 & 2032
- Figure 101: South America Digital Diagnostics Industry Revenue Share (%), by Country 2024 & 2032
- Figure 102: South America Digital Diagnostics Industry Volume Share (%), by Country 2024 & 2032
List of Tables
- Table 1: Global Digital Diagnostics Industry Revenue Million Forecast, by Region 2019 & 2032
- Table 2: Global Digital Diagnostics Industry Volume K Unit Forecast, by Region 2019 & 2032
- Table 3: Global Digital Diagnostics Industry Revenue Million Forecast, by Product 2019 & 2032
- Table 4: Global Digital Diagnostics Industry Volume K Unit Forecast, by Product 2019 & 2032
- Table 5: Global Digital Diagnostics Industry Revenue Million Forecast, by Diagnosis Type 2019 & 2032
- Table 6: Global Digital Diagnostics Industry Volume K Unit Forecast, by Diagnosis Type 2019 & 2032
- Table 7: Global Digital Diagnostics Industry Revenue Million Forecast, by End User 2019 & 2032
- Table 8: Global Digital Diagnostics Industry Volume K Unit Forecast, by End User 2019 & 2032
- Table 9: Global Digital Diagnostics Industry Revenue Million Forecast, by Region 2019 & 2032
- Table 10: Global Digital Diagnostics Industry Volume K Unit Forecast, by Region 2019 & 2032
- Table 11: Global Digital Diagnostics Industry Revenue Million Forecast, by Country 2019 & 2032
- Table 12: Global Digital Diagnostics Industry Volume K Unit Forecast, by Country 2019 & 2032
- Table 13: United States Digital Diagnostics Industry Revenue (Million) Forecast, by Application 2019 & 2032
- Table 14: United States Digital Diagnostics Industry Volume (K Unit) Forecast, by Application 2019 & 2032
- Table 15: Canada Digital Diagnostics Industry Revenue (Million) Forecast, by Application 2019 & 2032
- Table 16: Canada Digital Diagnostics Industry Volume (K Unit) Forecast, by Application 2019 & 2032
- Table 17: Mexico Digital Diagnostics Industry Revenue (Million) Forecast, by Application 2019 & 2032
- Table 18: Mexico Digital Diagnostics Industry Volume (K Unit) Forecast, by Application 2019 & 2032
- Table 19: Global Digital Diagnostics Industry Revenue Million Forecast, by Country 2019 & 2032
- Table 20: Global Digital Diagnostics Industry Volume K Unit Forecast, by Country 2019 & 2032
- Table 21: Germany Digital Diagnostics Industry Revenue (Million) Forecast, by Application 2019 & 2032
- Table 22: Germany Digital Diagnostics Industry Volume (K Unit) Forecast, by Application 2019 & 2032
- Table 23: United Kingdom Digital Diagnostics Industry Revenue (Million) Forecast, by Application 2019 & 2032
- Table 24: United Kingdom Digital Diagnostics Industry Volume (K Unit) Forecast, by Application 2019 & 2032
- Table 25: France Digital Diagnostics Industry Revenue (Million) Forecast, by Application 2019 & 2032
- Table 26: France Digital Diagnostics Industry Volume (K Unit) Forecast, by Application 2019 & 2032
- Table 27: Italy Digital Diagnostics Industry Revenue (Million) Forecast, by Application 2019 & 2032
- Table 28: Italy Digital Diagnostics Industry Volume (K Unit) Forecast, by Application 2019 & 2032
- Table 29: Spain Digital Diagnostics Industry Revenue (Million) Forecast, by Application 2019 & 2032
- Table 30: Spain Digital Diagnostics Industry Volume (K Unit) Forecast, by Application 2019 & 2032
- Table 31: Rest of Europe Digital Diagnostics Industry Revenue (Million) Forecast, by Application 2019 & 2032
- Table 32: Rest of Europe Digital Diagnostics Industry Volume (K Unit) Forecast, by Application 2019 & 2032
- Table 33: Global Digital Diagnostics Industry Revenue Million Forecast, by Country 2019 & 2032
- Table 34: Global Digital Diagnostics Industry Volume K Unit Forecast, by Country 2019 & 2032
- Table 35: China Digital Diagnostics Industry Revenue (Million) Forecast, by Application 2019 & 2032
- Table 36: China Digital Diagnostics Industry Volume (K Unit) Forecast, by Application 2019 & 2032
- Table 37: Japan Digital Diagnostics Industry Revenue (Million) Forecast, by Application 2019 & 2032
- Table 38: Japan Digital Diagnostics Industry Volume (K Unit) Forecast, by Application 2019 & 2032
- Table 39: India Digital Diagnostics Industry Revenue (Million) Forecast, by Application 2019 & 2032
- Table 40: India Digital Diagnostics Industry Volume (K Unit) Forecast, by Application 2019 & 2032
- Table 41: Australia Digital Diagnostics Industry Revenue (Million) Forecast, by Application 2019 & 2032
- Table 42: Australia Digital Diagnostics Industry Volume (K Unit) Forecast, by Application 2019 & 2032
- Table 43: South Korea Digital Diagnostics Industry Revenue (Million) Forecast, by Application 2019 & 2032
- Table 44: South Korea Digital Diagnostics Industry Volume (K Unit) Forecast, by Application 2019 & 2032
- Table 45: Rest of Asia Pacific Digital Diagnostics Industry Revenue (Million) Forecast, by Application 2019 & 2032
- Table 46: Rest of Asia Pacific Digital Diagnostics Industry Volume (K Unit) Forecast, by Application 2019 & 2032
- Table 47: Global Digital Diagnostics Industry Revenue Million Forecast, by Country 2019 & 2032
- Table 48: Global Digital Diagnostics Industry Volume K Unit Forecast, by Country 2019 & 2032
- Table 49: GCC Digital Diagnostics Industry Revenue (Million) Forecast, by Application 2019 & 2032
- Table 50: GCC Digital Diagnostics Industry Volume (K Unit) Forecast, by Application 2019 & 2032
- Table 51: South Africa Digital Diagnostics Industry Revenue (Million) Forecast, by Application 2019 & 2032
- Table 52: South Africa Digital Diagnostics Industry Volume (K Unit) Forecast, by Application 2019 & 2032
- Table 53: Rest of Middle East and Africa Digital Diagnostics Industry Revenue (Million) Forecast, by Application 2019 & 2032
- Table 54: Rest of Middle East and Africa Digital Diagnostics Industry Volume (K Unit) Forecast, by Application 2019 & 2032
- Table 55: Global Digital Diagnostics Industry Revenue Million Forecast, by Country 2019 & 2032
- Table 56: Global Digital Diagnostics Industry Volume K Unit Forecast, by Country 2019 & 2032
- Table 57: Brazil Digital Diagnostics Industry Revenue (Million) Forecast, by Application 2019 & 2032
- Table 58: Brazil Digital Diagnostics Industry Volume (K Unit) Forecast, by Application 2019 & 2032
- Table 59: Argentina Digital Diagnostics Industry Revenue (Million) Forecast, by Application 2019 & 2032
- Table 60: Argentina Digital Diagnostics Industry Volume (K Unit) Forecast, by Application 2019 & 2032
- Table 61: Rest of South America Digital Diagnostics Industry Revenue (Million) Forecast, by Application 2019 & 2032
- Table 62: Rest of South America Digital Diagnostics Industry Volume (K Unit) Forecast, by Application 2019 & 2032
- Table 63: Global Digital Diagnostics Industry Revenue Million Forecast, by Product 2019 & 2032
- Table 64: Global Digital Diagnostics Industry Volume K Unit Forecast, by Product 2019 & 2032
- Table 65: Global Digital Diagnostics Industry Revenue Million Forecast, by Diagnosis Type 2019 & 2032
- Table 66: Global Digital Diagnostics Industry Volume K Unit Forecast, by Diagnosis Type 2019 & 2032
- Table 67: Global Digital Diagnostics Industry Revenue Million Forecast, by End User 2019 & 2032
- Table 68: Global Digital Diagnostics Industry Volume K Unit Forecast, by End User 2019 & 2032
- Table 69: Global Digital Diagnostics Industry Revenue Million Forecast, by Country 2019 & 2032
- Table 70: Global Digital Diagnostics Industry Volume K Unit Forecast, by Country 2019 & 2032
- Table 71: United States Digital Diagnostics Industry Revenue (Million) Forecast, by Application 2019 & 2032
- Table 72: United States Digital Diagnostics Industry Volume (K Unit) Forecast, by Application 2019 & 2032
- Table 73: Canada Digital Diagnostics Industry Revenue (Million) Forecast, by Application 2019 & 2032
- Table 74: Canada Digital Diagnostics Industry Volume (K Unit) Forecast, by Application 2019 & 2032
- Table 75: Mexico Digital Diagnostics Industry Revenue (Million) Forecast, by Application 2019 & 2032
- Table 76: Mexico Digital Diagnostics Industry Volume (K Unit) Forecast, by Application 2019 & 2032
- Table 77: Global Digital Diagnostics Industry Revenue Million Forecast, by Product 2019 & 2032
- Table 78: Global Digital Diagnostics Industry Volume K Unit Forecast, by Product 2019 & 2032
- Table 79: Global Digital Diagnostics Industry Revenue Million Forecast, by Diagnosis Type 2019 & 2032
- Table 80: Global Digital Diagnostics Industry Volume K Unit Forecast, by Diagnosis Type 2019 & 2032
- Table 81: Global Digital Diagnostics Industry Revenue Million Forecast, by End User 2019 & 2032
- Table 82: Global Digital Diagnostics Industry Volume K Unit Forecast, by End User 2019 & 2032
- Table 83: Global Digital Diagnostics Industry Revenue Million Forecast, by Country 2019 & 2032
- Table 84: Global Digital Diagnostics Industry Volume K Unit Forecast, by Country 2019 & 2032
- Table 85: Germany Digital Diagnostics Industry Revenue (Million) Forecast, by Application 2019 & 2032
- Table 86: Germany Digital Diagnostics Industry Volume (K Unit) Forecast, by Application 2019 & 2032
- Table 87: United Kingdom Digital Diagnostics Industry Revenue (Million) Forecast, by Application 2019 & 2032
- Table 88: United Kingdom Digital Diagnostics Industry Volume (K Unit) Forecast, by Application 2019 & 2032
- Table 89: France Digital Diagnostics Industry Revenue (Million) Forecast, by Application 2019 & 2032
- Table 90: France Digital Diagnostics Industry Volume (K Unit) Forecast, by Application 2019 & 2032
- Table 91: Italy Digital Diagnostics Industry Revenue (Million) Forecast, by Application 2019 & 2032
- Table 92: Italy Digital Diagnostics Industry Volume (K Unit) Forecast, by Application 2019 & 2032
- Table 93: Spain Digital Diagnostics Industry Revenue (Million) Forecast, by Application 2019 & 2032
- Table 94: Spain Digital Diagnostics Industry Volume (K Unit) Forecast, by Application 2019 & 2032
- Table 95: Rest of Europe Digital Diagnostics Industry Revenue (Million) Forecast, by Application 2019 & 2032
- Table 96: Rest of Europe Digital Diagnostics Industry Volume (K Unit) Forecast, by Application 2019 & 2032
- Table 97: Global Digital Diagnostics Industry Revenue Million Forecast, by Product 2019 & 2032
- Table 98: Global Digital Diagnostics Industry Volume K Unit Forecast, by Product 2019 & 2032
- Table 99: Global Digital Diagnostics Industry Revenue Million Forecast, by Diagnosis Type 2019 & 2032
- Table 100: Global Digital Diagnostics Industry Volume K Unit Forecast, by Diagnosis Type 2019 & 2032
- Table 101: Global Digital Diagnostics Industry Revenue Million Forecast, by End User 2019 & 2032
- Table 102: Global Digital Diagnostics Industry Volume K Unit Forecast, by End User 2019 & 2032
- Table 103: Global Digital Diagnostics Industry Revenue Million Forecast, by Country 2019 & 2032
- Table 104: Global Digital Diagnostics Industry Volume K Unit Forecast, by Country 2019 & 2032
- Table 105: China Digital Diagnostics Industry Revenue (Million) Forecast, by Application 2019 & 2032
- Table 106: China Digital Diagnostics Industry Volume (K Unit) Forecast, by Application 2019 & 2032
- Table 107: Japan Digital Diagnostics Industry Revenue (Million) Forecast, by Application 2019 & 2032
- Table 108: Japan Digital Diagnostics Industry Volume (K Unit) Forecast, by Application 2019 & 2032
- Table 109: India Digital Diagnostics Industry Revenue (Million) Forecast, by Application 2019 & 2032
- Table 110: India Digital Diagnostics Industry Volume (K Unit) Forecast, by Application 2019 & 2032
- Table 111: Australia Digital Diagnostics Industry Revenue (Million) Forecast, by Application 2019 & 2032
- Table 112: Australia Digital Diagnostics Industry Volume (K Unit) Forecast, by Application 2019 & 2032
- Table 113: South Korea Digital Diagnostics Industry Revenue (Million) Forecast, by Application 2019 & 2032
- Table 114: South Korea Digital Diagnostics Industry Volume (K Unit) Forecast, by Application 2019 & 2032
- Table 115: Rest of Asia Pacific Digital Diagnostics Industry Revenue (Million) Forecast, by Application 2019 & 2032
- Table 116: Rest of Asia Pacific Digital Diagnostics Industry Volume (K Unit) Forecast, by Application 2019 & 2032
- Table 117: Global Digital Diagnostics Industry Revenue Million Forecast, by Product 2019 & 2032
- Table 118: Global Digital Diagnostics Industry Volume K Unit Forecast, by Product 2019 & 2032
- Table 119: Global Digital Diagnostics Industry Revenue Million Forecast, by Diagnosis Type 2019 & 2032
- Table 120: Global Digital Diagnostics Industry Volume K Unit Forecast, by Diagnosis Type 2019 & 2032
- Table 121: Global Digital Diagnostics Industry Revenue Million Forecast, by End User 2019 & 2032
- Table 122: Global Digital Diagnostics Industry Volume K Unit Forecast, by End User 2019 & 2032
- Table 123: Global Digital Diagnostics Industry Revenue Million Forecast, by Country 2019 & 2032
- Table 124: Global Digital Diagnostics Industry Volume K Unit Forecast, by Country 2019 & 2032
- Table 125: GCC Digital Diagnostics Industry Revenue (Million) Forecast, by Application 2019 & 2032
- Table 126: GCC Digital Diagnostics Industry Volume (K Unit) Forecast, by Application 2019 & 2032
- Table 127: South Africa Digital Diagnostics Industry Revenue (Million) Forecast, by Application 2019 & 2032
- Table 128: South Africa Digital Diagnostics Industry Volume (K Unit) Forecast, by Application 2019 & 2032
- Table 129: Rest of Middle East and Africa Digital Diagnostics Industry Revenue (Million) Forecast, by Application 2019 & 2032
- Table 130: Rest of Middle East and Africa Digital Diagnostics Industry Volume (K Unit) Forecast, by Application 2019 & 2032
- Table 131: Global Digital Diagnostics Industry Revenue Million Forecast, by Product 2019 & 2032
- Table 132: Global Digital Diagnostics Industry Volume K Unit Forecast, by Product 2019 & 2032
- Table 133: Global Digital Diagnostics Industry Revenue Million Forecast, by Diagnosis Type 2019 & 2032
- Table 134: Global Digital Diagnostics Industry Volume K Unit Forecast, by Diagnosis Type 2019 & 2032
- Table 135: Global Digital Diagnostics Industry Revenue Million Forecast, by End User 2019 & 2032
- Table 136: Global Digital Diagnostics Industry Volume K Unit Forecast, by End User 2019 & 2032
- Table 137: Global Digital Diagnostics Industry Revenue Million Forecast, by Country 2019 & 2032
- Table 138: Global Digital Diagnostics Industry Volume K Unit Forecast, by Country 2019 & 2032
- Table 139: Brazil Digital Diagnostics Industry Revenue (Million) Forecast, by Application 2019 & 2032
- Table 140: Brazil Digital Diagnostics Industry Volume (K Unit) Forecast, by Application 2019 & 2032
- Table 141: Argentina Digital Diagnostics Industry Revenue (Million) Forecast, by Application 2019 & 2032
- Table 142: Argentina Digital Diagnostics Industry Volume (K Unit) Forecast, by Application 2019 & 2032
- Table 143: Rest of South America Digital Diagnostics Industry Revenue (Million) Forecast, by Application 2019 & 2032
- Table 144: Rest of South America Digital Diagnostics Industry Volume (K Unit) Forecast, by Application 2019 & 2032
Frequently Asked Questions
1. What is the projected Compound Annual Growth Rate (CAGR) of the Digital Diagnostics Industry?
The projected CAGR is approximately 17.23%.
2. Which companies are prominent players in the Digital Diagnostics Industry?
Key companies in the market include Siemens Healthcare GmbH, Laboratory Corporation of America Holdings, Cerora, Digital Diagnostics Inc, F Hoffmann-La Roche Ltd, GE Healthcare, Vuno Inc , Midmark Corporation, Nanox Imaging Ltd, Novasignal Corporation, Riverain Technologies, ThermoFisher Scientific Inc.
3. What are the main segments of the Digital Diagnostics Industry?
The market segments include Product, Diagnosis Type, End User.
4. Can you provide details about the market size?
The market size is estimated to be USD XX Million as of 2022.
5. What are some drivers contributing to market growth?
Rising Adoption of Digitalization in Chronic Disease Management; Increasing Burden of Chronic Diseases.
6. What are the notable trends driving market growth?
Oncology Segment is Expected to Account for the Large Market Share During the Forecast Period.
7. Are there any restraints impacting market growth?
High Cost of Instruments.
8. Can you provide examples of recent developments in the market?
In May 2022, TestCard, a MedTech company, received USD 10 million in its latest round of fundraising, which will be used primarily to further commercialize its existing product suite whilst also launching new products such as diabetes, pregnancy, CKD, and flu testing.
9. What pricing options are available for accessing the report?
Pricing options include single-user, multi-user, and enterprise licenses priced at USD 4750, USD 5250, and USD 8750 respectively.
10. Is the market size provided in terms of value or volume?
The market size is provided in terms of value, measured in Million and volume, measured in K Unit.
11. Are there any specific market keywords associated with the report?
Yes, the market keyword associated with the report is "Digital Diagnostics Industry," which aids in identifying and referencing the specific market segment covered.
12. How do I determine which pricing option suits my needs best?
The pricing options vary based on user requirements and access needs. Individual users may opt for single-user licenses, while businesses requiring broader access may choose multi-user or enterprise licenses for cost-effective access to the report.
13. Are there any additional resources or data provided in the Digital Diagnostics Industry report?
While the report offers comprehensive insights, it's advisable to review the specific contents or supplementary materials provided to ascertain if additional resources or data are available.
14. How can I stay updated on further developments or reports in the Digital Diagnostics Industry?
To stay informed about further developments, trends, and reports in the Digital Diagnostics Industry, consider subscribing to industry newsletters, following relevant companies and organizations, or regularly checking reputable industry news sources and publications.
Methodology
Step 1 - Identification of Relevant Samples Size from Population Database


Step 2 - Approaches for Defining Global Market Size (Value, Volume* & Price*)

Note*: In applicable scenarios
Step 3 - Data Sources
Primary Research
- Web Analytics
- Survey Reports
- Research Institute
- Latest Research Reports
- Opinion Leaders
Secondary Research
- Annual Reports
- White Paper
- Latest Press Release
- Industry Association
- Paid Database
- Investor Presentations

Step 4 - Data Triangulation
Involves using different sources of information in order to increase the validity of a study
These sources are likely to be stakeholders in a program - participants, other researchers, program staff, other community members, and so on.
Then we put all data in single framework & apply various statistical tools to find out the dynamic on the market.
During the analysis stage, feedback from the stakeholder groups would be compared to determine areas of agreement as well as areas of divergence
