

Key Insights
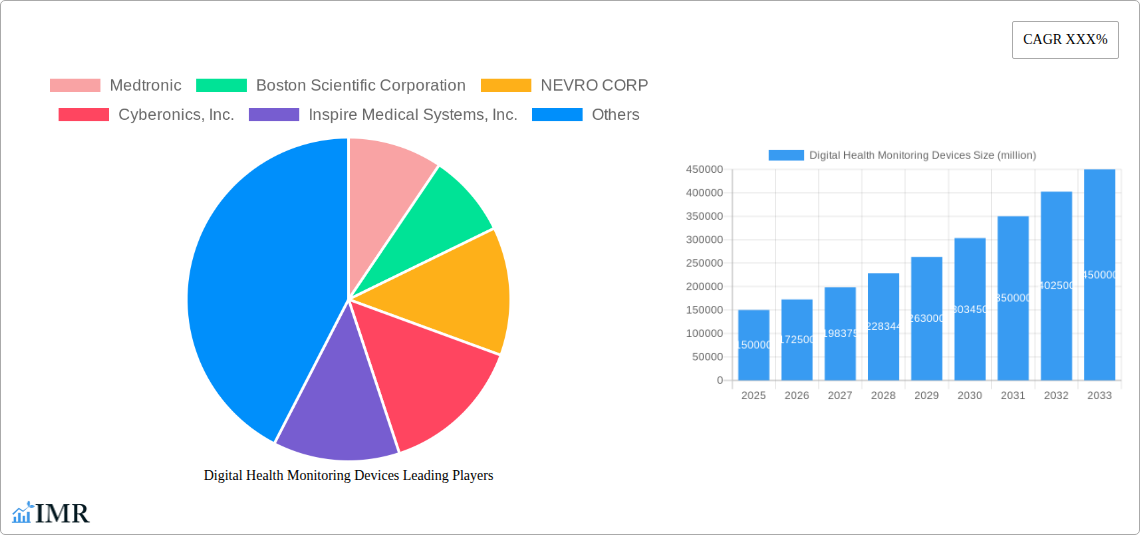
The global market for digital health monitoring devices is experiencing robust growth, driven by an aging population, increasing prevalence of chronic diseases, and the rising adoption of telehealth services. The market, estimated at $150 billion in 2025, is projected to expand at a Compound Annual Growth Rate (CAGR) of 15% from 2025 to 2033, reaching approximately $450 billion by 2033. This expansion is fueled by several key factors. Technological advancements are continuously improving the accuracy, portability, and affordability of these devices, making them accessible to a broader patient population. Furthermore, the increasing integration of these devices with electronic health records (EHRs) and cloud-based platforms facilitates seamless data sharing and improved patient care coordination. Government initiatives promoting remote patient monitoring and the rising adoption of value-based healthcare models are also contributing significantly to market growth. Major players like Medtronic, Boston Scientific, and others are driving innovation through continuous product development and strategic partnerships. However, challenges such as data security concerns, regulatory hurdles, and the need for enhanced user-friendliness remain to be addressed for sustained market growth.
Despite the significant growth potential, the market faces certain restraints. High initial investment costs for both manufacturers and consumers can limit adoption, particularly in developing economies. Concerns related to data privacy and security remain a significant hurdle, requiring robust cybersecurity measures to build consumer trust. Furthermore, the varying regulatory landscapes across different countries can create complexities for manufacturers aiming for global market penetration. The ongoing evolution of technologies requires continuous adaptation and innovation, making it crucial for companies to invest in R&D to stay competitive. Nonetheless, the long-term outlook for digital health monitoring devices remains highly positive, with continued innovation and regulatory clarity expected to drive sustained market growth.
Digital Health Monitoring Devices Market Report: 2019-2033
This comprehensive report provides an in-depth analysis of the Digital Health Monitoring Devices market, encompassing its dynamics, growth trends, key players, and future outlook. The report covers the period from 2019 to 2033, with 2025 serving as the base and estimated year. The market is segmented by device type and application, providing granular insights for informed decision-making. The total market size is projected to reach xx million units by 2033.
Digital Health Monitoring Devices Market Dynamics & Structure
The global Digital Health Monitoring Devices market, valued at xx million units in 2025, exhibits a moderately consolidated structure. Major players like Medtronic, Boston Scientific Corporation, and Abbott hold significant market share, while smaller, specialized companies focus on niche applications. Technological innovation, particularly in areas like AI-driven diagnostics and wearable sensor technology, is a primary growth driver. Stringent regulatory frameworks, particularly concerning data privacy and device safety, present both challenges and opportunities. Competitive substitutes, such as traditional methods of health monitoring, continue to exist, but the increasing convenience and accuracy of digital devices are steadily eroding their market share.
- Market Concentration: Highly concentrated, with top 5 players holding approximately xx% of market share in 2025.
- Technological Innovation: Advancements in miniaturization, wireless connectivity, and data analytics are key drivers.
- Regulatory Framework: Stringent regulations regarding data security and device approval are shaping market dynamics.
- Competitive Substitutes: Traditional monitoring methods face growing competition from digital alternatives.
- M&A Activity: An average of xx M&A deals per year were observed in the historical period (2019-2024), indicating significant consolidation.
- End-User Demographics: Aging populations and rising prevalence of chronic diseases are boosting market demand.
Digital Health Monitoring Devices Growth Trends & Insights
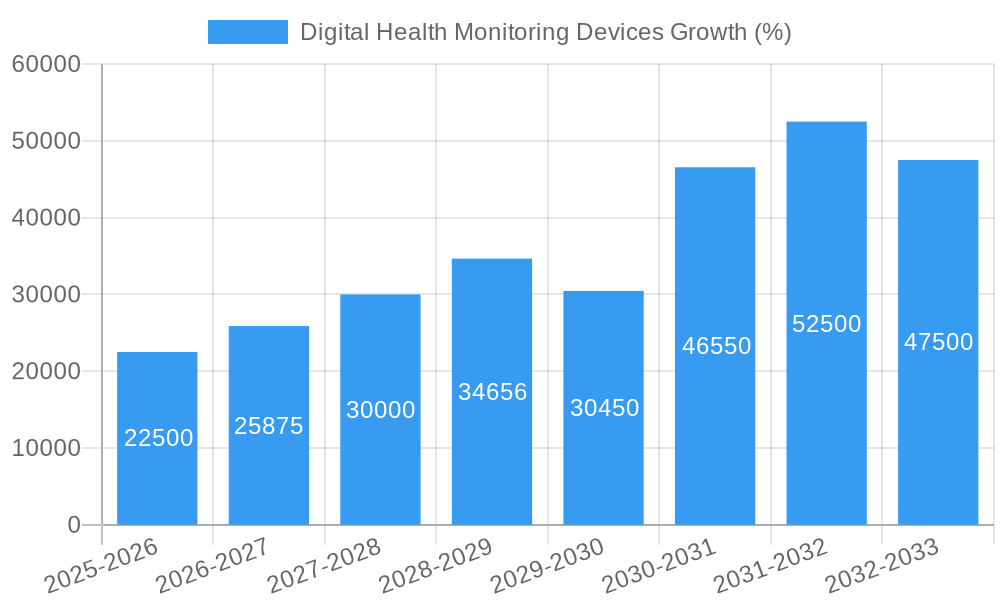
The Digital Health Monitoring Devices market witnessed robust growth throughout the historical period (2019-2024), driven by factors such as increasing healthcare expenditure, technological advancements, and rising awareness regarding preventive healthcare. The market is expected to maintain a healthy Compound Annual Growth Rate (CAGR) of xx% during the forecast period (2025-2033), reaching an estimated xx million units by 2033. This growth is fueled by the adoption of remote patient monitoring (RPM) programs, the integration of IoT and AI capabilities into devices, and a shift in consumer behavior towards proactive health management. Market penetration is expected to increase significantly, particularly in developing economies, as affordability and accessibility improve. Technological disruptions, including the introduction of advanced sensor technologies and cloud-based data analytics platforms, will further accelerate market growth.
Dominant Regions, Countries, or Segments in Digital Health Monitoring Devices
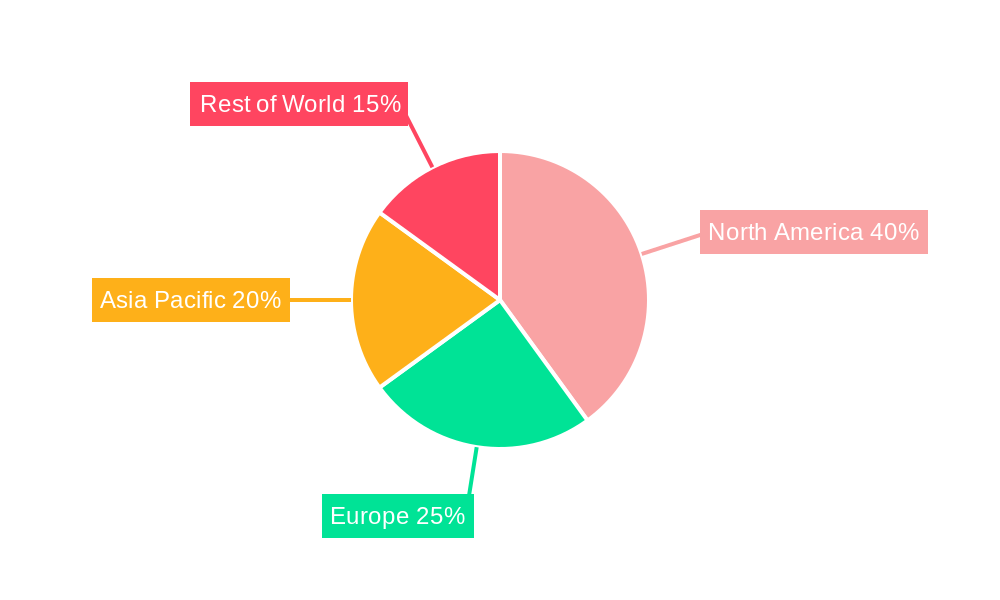
North America currently dominates the global Digital Health Monitoring Devices market, accounting for approximately xx% of the total market share in 2025. This dominance is attributable to several factors:
- Strong Healthcare Infrastructure: Well-established healthcare systems and robust IT infrastructure facilitate the adoption of digital health technologies.
- High Healthcare Expenditure: Significant investments in healthcare and a willingness to adopt innovative technologies drive demand.
- Favorable Regulatory Environment: A relatively supportive regulatory landscape encourages innovation and market entry.
- Early Adoption of Technology: High levels of technological literacy and a preference for advanced healthcare solutions contribute to strong market penetration.
Europe follows North America as a key market, with a significant and growing share. Asia-Pacific is expected to experience the fastest growth rate during the forecast period, driven by increasing disposable incomes, improving healthcare infrastructure, and a growing awareness of preventive healthcare.
Digital Health Monitoring Devices Product Landscape
The Digital Health Monitoring Devices market encompasses a diverse range of products, including wearable sensors, implantable devices, and remote monitoring systems. These devices offer diverse applications, ranging from continuous glucose monitoring and cardiac rhythm management to neurological condition tracking and sleep apnea detection. Recent innovations include improved sensor accuracy, miniaturized form factors, and enhanced data analytics capabilities, leading to more personalized and effective healthcare solutions. Unique selling propositions for these devices often include ease of use, patient convenience, and cost-effectiveness compared to traditional methods.
Key Drivers, Barriers & Challenges in Digital Health Monitoring Devices
Key Drivers: Technological advancements, rising prevalence of chronic diseases, increasing healthcare expenditure, and growing demand for remote patient monitoring are driving market growth. The integration of AI and machine learning algorithms for improved diagnostics and personalized medicine is a crucial growth accelerator.
Key Challenges: High initial costs of implementation, data security concerns, stringent regulatory requirements, and interoperability issues represent key barriers. Supply chain disruptions can impact device availability and affordability. Competition from established players and new entrants further complicates market dynamics. These factors have a quantifiable impact, potentially slowing down the market's growth rate by xx% in certain segments.
Emerging Opportunities in Digital Health Monitoring Devices
Untapped markets in developing economies present significant growth opportunities, particularly in regions with limited access to traditional healthcare services. The integration of digital health monitoring devices with telehealth platforms offers further expansion potential, enabling remote consultations and proactive health management. The development of innovative applications for specific chronic diseases, such as personalized treatment plans based on real-time data analysis, represents another avenue for growth.
Growth Accelerators in the Digital Health Monitoring Devices Industry
Technological breakthroughs, such as advancements in sensor technology, miniaturization, and AI-powered analytics, are crucial growth catalysts. Strategic partnerships between device manufacturers, healthcare providers, and technology companies are also accelerating market expansion. Government initiatives promoting the adoption of digital health technologies and investments in healthcare infrastructure further contribute to long-term growth prospects.
Key Players Shaping the Digital Health Monitoring Devices Market
- Medtronic
- Boston Scientific Corporation
- NEVRO CORP
- Cyberonics, Inc.
- Inspire Medical Systems, Inc.
- SPR Therapeutics
- ALEVA NEUROTHERAPEUTICS SA
- Bioness Inc.
- ReShape Lifesciences, Inc.
- LivaNova PLC
- NeuroPace, Inc.
- Synapse Biomedical Inc.
- Soterix Medical Inc.
- Accellent Technologies, Inc.
- Abbott
- Bioventus
Notable Milestones in Digital Health Monitoring Devices Sector
- 2020: FDA approval of a new continuous glucose monitoring system with enhanced accuracy.
- 2021: Launch of a novel wearable sensor for remote cardiac rhythm monitoring.
- 2022: Acquisition of a smaller digital health company by a major medical device manufacturer.
- 2023: Significant investment in AI-driven diagnostic capabilities for digital health devices.
- 2024: Introduction of new regulatory guidelines for data privacy in digital health monitoring.
In-Depth Digital Health Monitoring Devices Market Outlook
The future of the Digital Health Monitoring Devices market looks exceptionally bright. Continued technological innovation, expanding applications, and growing adoption in underserved regions will fuel substantial growth. Strategic partnerships and collaborations will play a crucial role in shaping the market landscape, driving innovation, and expanding market access. The integration of AI and machine learning capabilities will enhance diagnostic accuracy and provide more personalized healthcare solutions. The market presents significant opportunities for companies that can effectively navigate the regulatory landscape and deliver high-quality, user-friendly devices.
Digital Health Monitoring Devices Segmentation
-
1. Application
- 1.1. Hospital
- 1.2. Homecare
- 1.3. Clinics
- 1.4. Ambulatory Surgical Centres
- 1.5. Others
-
2. Type
- 2.1. Wireless Health
- 2.2. M-health
- 2.3. Tele-health
- 2.4. EHR/EMR
- 2.5. Others
Digital Health Monitoring Devices Segmentation By Geography
-
1. North America
- 1.1. United States
- 1.2. Canada
- 1.3. Mexico
-
2. South America
- 2.1. Brazil
- 2.2. Argentina
- 2.3. Rest of South America
-
3. Europe
- 3.1. United Kingdom
- 3.2. Germany
- 3.3. France
- 3.4. Italy
- 3.5. Spain
- 3.6. Russia
- 3.7. Benelux
- 3.8. Nordics
- 3.9. Rest of Europe
-
4. Middle East & Africa
- 4.1. Turkey
- 4.2. Israel
- 4.3. GCC
- 4.4. North Africa
- 4.5. South Africa
- 4.6. Rest of Middle East & Africa
-
5. Asia Pacific
- 5.1. China
- 5.2. India
- 5.3. Japan
- 5.4. South Korea
- 5.5. ASEAN
- 5.6. Oceania
- 5.7. Rest of Asia Pacific
Digital Health Monitoring Devices REPORT HIGHLIGHTS
| Aspects | Details |
|---|---|
| Study Period | 2019-2033 |
| Base Year | 2024 |
| Estimated Year | 2025 |
| Forecast Period | 2025-2033 |
| Historical Period | 2019-2024 |
| Growth Rate | CAGR of XXX% from 2019-2033 |
| Segmentation |
|
Table of Contents
- 1. Introduction
- 1.1. Research Scope
- 1.2. Market Segmentation
- 1.3. Research Methodology
- 1.4. Definitions and Assumptions
- 2. Executive Summary
- 2.1. Introduction
- 3. Market Dynamics
- 3.1. Introduction
- 3.2. Market Drivers
- 3.3. Market Restrains
- 3.4. Market Trends
- 4. Market Factor Analysis
- 4.1. Porters Five Forces
- 4.2. Supply/Value Chain
- 4.3. PESTEL analysis
- 4.4. Market Entropy
- 4.5. Patent/Trademark Analysis
- 5. Global Digital Health Monitoring Devices Analysis, Insights and Forecast, 2019-2031
- 5.1. Market Analysis, Insights and Forecast - by Application
- 5.1.1. Hospital
- 5.1.2. Homecare
- 5.1.3. Clinics
- 5.1.4. Ambulatory Surgical Centres
- 5.1.5. Others
- 5.2. Market Analysis, Insights and Forecast - by Type
- 5.2.1. Wireless Health
- 5.2.2. M-health
- 5.2.3. Tele-health
- 5.2.4. EHR/EMR
- 5.2.5. Others
- 5.3. Market Analysis, Insights and Forecast - by Region
- 5.3.1. North America
- 5.3.2. South America
- 5.3.3. Europe
- 5.3.4. Middle East & Africa
- 5.3.5. Asia Pacific
- 5.1. Market Analysis, Insights and Forecast - by Application
- 6. North America Digital Health Monitoring Devices Analysis, Insights and Forecast, 2019-2031
- 6.1. Market Analysis, Insights and Forecast - by Application
- 6.1.1. Hospital
- 6.1.2. Homecare
- 6.1.3. Clinics
- 6.1.4. Ambulatory Surgical Centres
- 6.1.5. Others
- 6.2. Market Analysis, Insights and Forecast - by Type
- 6.2.1. Wireless Health
- 6.2.2. M-health
- 6.2.3. Tele-health
- 6.2.4. EHR/EMR
- 6.2.5. Others
- 6.1. Market Analysis, Insights and Forecast - by Application
- 7. South America Digital Health Monitoring Devices Analysis, Insights and Forecast, 2019-2031
- 7.1. Market Analysis, Insights and Forecast - by Application
- 7.1.1. Hospital
- 7.1.2. Homecare
- 7.1.3. Clinics
- 7.1.4. Ambulatory Surgical Centres
- 7.1.5. Others
- 7.2. Market Analysis, Insights and Forecast - by Type
- 7.2.1. Wireless Health
- 7.2.2. M-health
- 7.2.3. Tele-health
- 7.2.4. EHR/EMR
- 7.2.5. Others
- 7.1. Market Analysis, Insights and Forecast - by Application
- 8. Europe Digital Health Monitoring Devices Analysis, Insights and Forecast, 2019-2031
- 8.1. Market Analysis, Insights and Forecast - by Application
- 8.1.1. Hospital
- 8.1.2. Homecare
- 8.1.3. Clinics
- 8.1.4. Ambulatory Surgical Centres
- 8.1.5. Others
- 8.2. Market Analysis, Insights and Forecast - by Type
- 8.2.1. Wireless Health
- 8.2.2. M-health
- 8.2.3. Tele-health
- 8.2.4. EHR/EMR
- 8.2.5. Others
- 8.1. Market Analysis, Insights and Forecast - by Application
- 9. Middle East & Africa Digital Health Monitoring Devices Analysis, Insights and Forecast, 2019-2031
- 9.1. Market Analysis, Insights and Forecast - by Application
- 9.1.1. Hospital
- 9.1.2. Homecare
- 9.1.3. Clinics
- 9.1.4. Ambulatory Surgical Centres
- 9.1.5. Others
- 9.2. Market Analysis, Insights and Forecast - by Type
- 9.2.1. Wireless Health
- 9.2.2. M-health
- 9.2.3. Tele-health
- 9.2.4. EHR/EMR
- 9.2.5. Others
- 9.1. Market Analysis, Insights and Forecast - by Application
- 10. Asia Pacific Digital Health Monitoring Devices Analysis, Insights and Forecast, 2019-2031
- 10.1. Market Analysis, Insights and Forecast - by Application
- 10.1.1. Hospital
- 10.1.2. Homecare
- 10.1.3. Clinics
- 10.1.4. Ambulatory Surgical Centres
- 10.1.5. Others
- 10.2. Market Analysis, Insights and Forecast - by Type
- 10.2.1. Wireless Health
- 10.2.2. M-health
- 10.2.3. Tele-health
- 10.2.4. EHR/EMR
- 10.2.5. Others
- 10.1. Market Analysis, Insights and Forecast - by Application
- 11. Competitive Analysis
- 11.1. Global Market Share Analysis 2024
- 11.2. Company Profiles
- 11.2.1 Medtronic
- 11.2.1.1. Overview
- 11.2.1.2. Products
- 11.2.1.3. SWOT Analysis
- 11.2.1.4. Recent Developments
- 11.2.1.5. Financials (Based on Availability)
- 11.2.2 Boston Scientific Corporation
- 11.2.2.1. Overview
- 11.2.2.2. Products
- 11.2.2.3. SWOT Analysis
- 11.2.2.4. Recent Developments
- 11.2.2.5. Financials (Based on Availability)
- 11.2.3 NEVRO CORP
- 11.2.3.1. Overview
- 11.2.3.2. Products
- 11.2.3.3. SWOT Analysis
- 11.2.3.4. Recent Developments
- 11.2.3.5. Financials (Based on Availability)
- 11.2.4 Cyberonics Inc.
- 11.2.4.1. Overview
- 11.2.4.2. Products
- 11.2.4.3. SWOT Analysis
- 11.2.4.4. Recent Developments
- 11.2.4.5. Financials (Based on Availability)
- 11.2.5 Inspire Medical Systems Inc.
- 11.2.5.1. Overview
- 11.2.5.2. Products
- 11.2.5.3. SWOT Analysis
- 11.2.5.4. Recent Developments
- 11.2.5.5. Financials (Based on Availability)
- 11.2.6 SPR Therapeutics
- 11.2.6.1. Overview
- 11.2.6.2. Products
- 11.2.6.3. SWOT Analysis
- 11.2.6.4. Recent Developments
- 11.2.6.5. Financials (Based on Availability)
- 11.2.7 ALEVA NEUROTHERAPEUTICS SA
- 11.2.7.1. Overview
- 11.2.7.2. Products
- 11.2.7.3. SWOT Analysis
- 11.2.7.4. Recent Developments
- 11.2.7.5. Financials (Based on Availability)
- 11.2.8 Bioness Inc.
- 11.2.8.1. Overview
- 11.2.8.2. Products
- 11.2.8.3. SWOT Analysis
- 11.2.8.4. Recent Developments
- 11.2.8.5. Financials (Based on Availability)
- 11.2.9 ReShape Lifesciences Inc.
- 11.2.9.1. Overview
- 11.2.9.2. Products
- 11.2.9.3. SWOT Analysis
- 11.2.9.4. Recent Developments
- 11.2.9.5. Financials (Based on Availability)
- 11.2.10 LivaNova PLC
- 11.2.10.1. Overview
- 11.2.10.2. Products
- 11.2.10.3. SWOT Analysis
- 11.2.10.4. Recent Developments
- 11.2.10.5. Financials (Based on Availability)
- 11.2.11 NeuroPace Inc.
- 11.2.11.1. Overview
- 11.2.11.2. Products
- 11.2.11.3. SWOT Analysis
- 11.2.11.4. Recent Developments
- 11.2.11.5. Financials (Based on Availability)
- 11.2.12 Synapse Biomedical Inc.
- 11.2.12.1. Overview
- 11.2.12.2. Products
- 11.2.12.3. SWOT Analysis
- 11.2.12.4. Recent Developments
- 11.2.12.5. Financials (Based on Availability)
- 11.2.13 Soterix Medical Inc.
- 11.2.13.1. Overview
- 11.2.13.2. Products
- 11.2.13.3. SWOT Analysis
- 11.2.13.4. Recent Developments
- 11.2.13.5. Financials (Based on Availability)
- 11.2.14 Accellent Technologies Inc.
- 11.2.14.1. Overview
- 11.2.14.2. Products
- 11.2.14.3. SWOT Analysis
- 11.2.14.4. Recent Developments
- 11.2.14.5. Financials (Based on Availability)
- 11.2.15 Abbott
- 11.2.15.1. Overview
- 11.2.15.2. Products
- 11.2.15.3. SWOT Analysis
- 11.2.15.4. Recent Developments
- 11.2.15.5. Financials (Based on Availability)
- 11.2.16 Bioventus
- 11.2.16.1. Overview
- 11.2.16.2. Products
- 11.2.16.3. SWOT Analysis
- 11.2.16.4. Recent Developments
- 11.2.16.5. Financials (Based on Availability)
- 11.2.1 Medtronic
List of Figures
- Figure 1: Global Digital Health Monitoring Devices Revenue Breakdown (million, %) by Region 2024 & 2032
- Figure 2: Global Digital Health Monitoring Devices Volume Breakdown (K, %) by Region 2024 & 2032
- Figure 3: North America Digital Health Monitoring Devices Revenue (million), by Application 2024 & 2032
- Figure 4: North America Digital Health Monitoring Devices Volume (K), by Application 2024 & 2032
- Figure 5: North America Digital Health Monitoring Devices Revenue Share (%), by Application 2024 & 2032
- Figure 6: North America Digital Health Monitoring Devices Volume Share (%), by Application 2024 & 2032
- Figure 7: North America Digital Health Monitoring Devices Revenue (million), by Type 2024 & 2032
- Figure 8: North America Digital Health Monitoring Devices Volume (K), by Type 2024 & 2032
- Figure 9: North America Digital Health Monitoring Devices Revenue Share (%), by Type 2024 & 2032
- Figure 10: North America Digital Health Monitoring Devices Volume Share (%), by Type 2024 & 2032
- Figure 11: North America Digital Health Monitoring Devices Revenue (million), by Country 2024 & 2032
- Figure 12: North America Digital Health Monitoring Devices Volume (K), by Country 2024 & 2032
- Figure 13: North America Digital Health Monitoring Devices Revenue Share (%), by Country 2024 & 2032
- Figure 14: North America Digital Health Monitoring Devices Volume Share (%), by Country 2024 & 2032
- Figure 15: South America Digital Health Monitoring Devices Revenue (million), by Application 2024 & 2032
- Figure 16: South America Digital Health Monitoring Devices Volume (K), by Application 2024 & 2032
- Figure 17: South America Digital Health Monitoring Devices Revenue Share (%), by Application 2024 & 2032
- Figure 18: South America Digital Health Monitoring Devices Volume Share (%), by Application 2024 & 2032
- Figure 19: South America Digital Health Monitoring Devices Revenue (million), by Type 2024 & 2032
- Figure 20: South America Digital Health Monitoring Devices Volume (K), by Type 2024 & 2032
- Figure 21: South America Digital Health Monitoring Devices Revenue Share (%), by Type 2024 & 2032
- Figure 22: South America Digital Health Monitoring Devices Volume Share (%), by Type 2024 & 2032
- Figure 23: South America Digital Health Monitoring Devices Revenue (million), by Country 2024 & 2032
- Figure 24: South America Digital Health Monitoring Devices Volume (K), by Country 2024 & 2032
- Figure 25: South America Digital Health Monitoring Devices Revenue Share (%), by Country 2024 & 2032
- Figure 26: South America Digital Health Monitoring Devices Volume Share (%), by Country 2024 & 2032
- Figure 27: Europe Digital Health Monitoring Devices Revenue (million), by Application 2024 & 2032
- Figure 28: Europe Digital Health Monitoring Devices Volume (K), by Application 2024 & 2032
- Figure 29: Europe Digital Health Monitoring Devices Revenue Share (%), by Application 2024 & 2032
- Figure 30: Europe Digital Health Monitoring Devices Volume Share (%), by Application 2024 & 2032
- Figure 31: Europe Digital Health Monitoring Devices Revenue (million), by Type 2024 & 2032
- Figure 32: Europe Digital Health Monitoring Devices Volume (K), by Type 2024 & 2032
- Figure 33: Europe Digital Health Monitoring Devices Revenue Share (%), by Type 2024 & 2032
- Figure 34: Europe Digital Health Monitoring Devices Volume Share (%), by Type 2024 & 2032
- Figure 35: Europe Digital Health Monitoring Devices Revenue (million), by Country 2024 & 2032
- Figure 36: Europe Digital Health Monitoring Devices Volume (K), by Country 2024 & 2032
- Figure 37: Europe Digital Health Monitoring Devices Revenue Share (%), by Country 2024 & 2032
- Figure 38: Europe Digital Health Monitoring Devices Volume Share (%), by Country 2024 & 2032
- Figure 39: Middle East & Africa Digital Health Monitoring Devices Revenue (million), by Application 2024 & 2032
- Figure 40: Middle East & Africa Digital Health Monitoring Devices Volume (K), by Application 2024 & 2032
- Figure 41: Middle East & Africa Digital Health Monitoring Devices Revenue Share (%), by Application 2024 & 2032
- Figure 42: Middle East & Africa Digital Health Monitoring Devices Volume Share (%), by Application 2024 & 2032
- Figure 43: Middle East & Africa Digital Health Monitoring Devices Revenue (million), by Type 2024 & 2032
- Figure 44: Middle East & Africa Digital Health Monitoring Devices Volume (K), by Type 2024 & 2032
- Figure 45: Middle East & Africa Digital Health Monitoring Devices Revenue Share (%), by Type 2024 & 2032
- Figure 46: Middle East & Africa Digital Health Monitoring Devices Volume Share (%), by Type 2024 & 2032
- Figure 47: Middle East & Africa Digital Health Monitoring Devices Revenue (million), by Country 2024 & 2032
- Figure 48: Middle East & Africa Digital Health Monitoring Devices Volume (K), by Country 2024 & 2032
- Figure 49: Middle East & Africa Digital Health Monitoring Devices Revenue Share (%), by Country 2024 & 2032
- Figure 50: Middle East & Africa Digital Health Monitoring Devices Volume Share (%), by Country 2024 & 2032
- Figure 51: Asia Pacific Digital Health Monitoring Devices Revenue (million), by Application 2024 & 2032
- Figure 52: Asia Pacific Digital Health Monitoring Devices Volume (K), by Application 2024 & 2032
- Figure 53: Asia Pacific Digital Health Monitoring Devices Revenue Share (%), by Application 2024 & 2032
- Figure 54: Asia Pacific Digital Health Monitoring Devices Volume Share (%), by Application 2024 & 2032
- Figure 55: Asia Pacific Digital Health Monitoring Devices Revenue (million), by Type 2024 & 2032
- Figure 56: Asia Pacific Digital Health Monitoring Devices Volume (K), by Type 2024 & 2032
- Figure 57: Asia Pacific Digital Health Monitoring Devices Revenue Share (%), by Type 2024 & 2032
- Figure 58: Asia Pacific Digital Health Monitoring Devices Volume Share (%), by Type 2024 & 2032
- Figure 59: Asia Pacific Digital Health Monitoring Devices Revenue (million), by Country 2024 & 2032
- Figure 60: Asia Pacific Digital Health Monitoring Devices Volume (K), by Country 2024 & 2032
- Figure 61: Asia Pacific Digital Health Monitoring Devices Revenue Share (%), by Country 2024 & 2032
- Figure 62: Asia Pacific Digital Health Monitoring Devices Volume Share (%), by Country 2024 & 2032
List of Tables
- Table 1: Global Digital Health Monitoring Devices Revenue million Forecast, by Region 2019 & 2032
- Table 2: Global Digital Health Monitoring Devices Volume K Forecast, by Region 2019 & 2032
- Table 3: Global Digital Health Monitoring Devices Revenue million Forecast, by Application 2019 & 2032
- Table 4: Global Digital Health Monitoring Devices Volume K Forecast, by Application 2019 & 2032
- Table 5: Global Digital Health Monitoring Devices Revenue million Forecast, by Type 2019 & 2032
- Table 6: Global Digital Health Monitoring Devices Volume K Forecast, by Type 2019 & 2032
- Table 7: Global Digital Health Monitoring Devices Revenue million Forecast, by Region 2019 & 2032
- Table 8: Global Digital Health Monitoring Devices Volume K Forecast, by Region 2019 & 2032
- Table 9: Global Digital Health Monitoring Devices Revenue million Forecast, by Application 2019 & 2032
- Table 10: Global Digital Health Monitoring Devices Volume K Forecast, by Application 2019 & 2032
- Table 11: Global Digital Health Monitoring Devices Revenue million Forecast, by Type 2019 & 2032
- Table 12: Global Digital Health Monitoring Devices Volume K Forecast, by Type 2019 & 2032
- Table 13: Global Digital Health Monitoring Devices Revenue million Forecast, by Country 2019 & 2032
- Table 14: Global Digital Health Monitoring Devices Volume K Forecast, by Country 2019 & 2032
- Table 15: United States Digital Health Monitoring Devices Revenue (million) Forecast, by Application 2019 & 2032
- Table 16: United States Digital Health Monitoring Devices Volume (K) Forecast, by Application 2019 & 2032
- Table 17: Canada Digital Health Monitoring Devices Revenue (million) Forecast, by Application 2019 & 2032
- Table 18: Canada Digital Health Monitoring Devices Volume (K) Forecast, by Application 2019 & 2032
- Table 19: Mexico Digital Health Monitoring Devices Revenue (million) Forecast, by Application 2019 & 2032
- Table 20: Mexico Digital Health Monitoring Devices Volume (K) Forecast, by Application 2019 & 2032
- Table 21: Global Digital Health Monitoring Devices Revenue million Forecast, by Application 2019 & 2032
- Table 22: Global Digital Health Monitoring Devices Volume K Forecast, by Application 2019 & 2032
- Table 23: Global Digital Health Monitoring Devices Revenue million Forecast, by Type 2019 & 2032
- Table 24: Global Digital Health Monitoring Devices Volume K Forecast, by Type 2019 & 2032
- Table 25: Global Digital Health Monitoring Devices Revenue million Forecast, by Country 2019 & 2032
- Table 26: Global Digital Health Monitoring Devices Volume K Forecast, by Country 2019 & 2032
- Table 27: Brazil Digital Health Monitoring Devices Revenue (million) Forecast, by Application 2019 & 2032
- Table 28: Brazil Digital Health Monitoring Devices Volume (K) Forecast, by Application 2019 & 2032
- Table 29: Argentina Digital Health Monitoring Devices Revenue (million) Forecast, by Application 2019 & 2032
- Table 30: Argentina Digital Health Monitoring Devices Volume (K) Forecast, by Application 2019 & 2032
- Table 31: Rest of South America Digital Health Monitoring Devices Revenue (million) Forecast, by Application 2019 & 2032
- Table 32: Rest of South America Digital Health Monitoring Devices Volume (K) Forecast, by Application 2019 & 2032
- Table 33: Global Digital Health Monitoring Devices Revenue million Forecast, by Application 2019 & 2032
- Table 34: Global Digital Health Monitoring Devices Volume K Forecast, by Application 2019 & 2032
- Table 35: Global Digital Health Monitoring Devices Revenue million Forecast, by Type 2019 & 2032
- Table 36: Global Digital Health Monitoring Devices Volume K Forecast, by Type 2019 & 2032
- Table 37: Global Digital Health Monitoring Devices Revenue million Forecast, by Country 2019 & 2032
- Table 38: Global Digital Health Monitoring Devices Volume K Forecast, by Country 2019 & 2032
- Table 39: United Kingdom Digital Health Monitoring Devices Revenue (million) Forecast, by Application 2019 & 2032
- Table 40: United Kingdom Digital Health Monitoring Devices Volume (K) Forecast, by Application 2019 & 2032
- Table 41: Germany Digital Health Monitoring Devices Revenue (million) Forecast, by Application 2019 & 2032
- Table 42: Germany Digital Health Monitoring Devices Volume (K) Forecast, by Application 2019 & 2032
- Table 43: France Digital Health Monitoring Devices Revenue (million) Forecast, by Application 2019 & 2032
- Table 44: France Digital Health Monitoring Devices Volume (K) Forecast, by Application 2019 & 2032
- Table 45: Italy Digital Health Monitoring Devices Revenue (million) Forecast, by Application 2019 & 2032
- Table 46: Italy Digital Health Monitoring Devices Volume (K) Forecast, by Application 2019 & 2032
- Table 47: Spain Digital Health Monitoring Devices Revenue (million) Forecast, by Application 2019 & 2032
- Table 48: Spain Digital Health Monitoring Devices Volume (K) Forecast, by Application 2019 & 2032
- Table 49: Russia Digital Health Monitoring Devices Revenue (million) Forecast, by Application 2019 & 2032
- Table 50: Russia Digital Health Monitoring Devices Volume (K) Forecast, by Application 2019 & 2032
- Table 51: Benelux Digital Health Monitoring Devices Revenue (million) Forecast, by Application 2019 & 2032
- Table 52: Benelux Digital Health Monitoring Devices Volume (K) Forecast, by Application 2019 & 2032
- Table 53: Nordics Digital Health Monitoring Devices Revenue (million) Forecast, by Application 2019 & 2032
- Table 54: Nordics Digital Health Monitoring Devices Volume (K) Forecast, by Application 2019 & 2032
- Table 55: Rest of Europe Digital Health Monitoring Devices Revenue (million) Forecast, by Application 2019 & 2032
- Table 56: Rest of Europe Digital Health Monitoring Devices Volume (K) Forecast, by Application 2019 & 2032
- Table 57: Global Digital Health Monitoring Devices Revenue million Forecast, by Application 2019 & 2032
- Table 58: Global Digital Health Monitoring Devices Volume K Forecast, by Application 2019 & 2032
- Table 59: Global Digital Health Monitoring Devices Revenue million Forecast, by Type 2019 & 2032
- Table 60: Global Digital Health Monitoring Devices Volume K Forecast, by Type 2019 & 2032
- Table 61: Global Digital Health Monitoring Devices Revenue million Forecast, by Country 2019 & 2032
- Table 62: Global Digital Health Monitoring Devices Volume K Forecast, by Country 2019 & 2032
- Table 63: Turkey Digital Health Monitoring Devices Revenue (million) Forecast, by Application 2019 & 2032
- Table 64: Turkey Digital Health Monitoring Devices Volume (K) Forecast, by Application 2019 & 2032
- Table 65: Israel Digital Health Monitoring Devices Revenue (million) Forecast, by Application 2019 & 2032
- Table 66: Israel Digital Health Monitoring Devices Volume (K) Forecast, by Application 2019 & 2032
- Table 67: GCC Digital Health Monitoring Devices Revenue (million) Forecast, by Application 2019 & 2032
- Table 68: GCC Digital Health Monitoring Devices Volume (K) Forecast, by Application 2019 & 2032
- Table 69: North Africa Digital Health Monitoring Devices Revenue (million) Forecast, by Application 2019 & 2032
- Table 70: North Africa Digital Health Monitoring Devices Volume (K) Forecast, by Application 2019 & 2032
- Table 71: South Africa Digital Health Monitoring Devices Revenue (million) Forecast, by Application 2019 & 2032
- Table 72: South Africa Digital Health Monitoring Devices Volume (K) Forecast, by Application 2019 & 2032
- Table 73: Rest of Middle East & Africa Digital Health Monitoring Devices Revenue (million) Forecast, by Application 2019 & 2032
- Table 74: Rest of Middle East & Africa Digital Health Monitoring Devices Volume (K) Forecast, by Application 2019 & 2032
- Table 75: Global Digital Health Monitoring Devices Revenue million Forecast, by Application 2019 & 2032
- Table 76: Global Digital Health Monitoring Devices Volume K Forecast, by Application 2019 & 2032
- Table 77: Global Digital Health Monitoring Devices Revenue million Forecast, by Type 2019 & 2032
- Table 78: Global Digital Health Monitoring Devices Volume K Forecast, by Type 2019 & 2032
- Table 79: Global Digital Health Monitoring Devices Revenue million Forecast, by Country 2019 & 2032
- Table 80: Global Digital Health Monitoring Devices Volume K Forecast, by Country 2019 & 2032
- Table 81: China Digital Health Monitoring Devices Revenue (million) Forecast, by Application 2019 & 2032
- Table 82: China Digital Health Monitoring Devices Volume (K) Forecast, by Application 2019 & 2032
- Table 83: India Digital Health Monitoring Devices Revenue (million) Forecast, by Application 2019 & 2032
- Table 84: India Digital Health Monitoring Devices Volume (K) Forecast, by Application 2019 & 2032
- Table 85: Japan Digital Health Monitoring Devices Revenue (million) Forecast, by Application 2019 & 2032
- Table 86: Japan Digital Health Monitoring Devices Volume (K) Forecast, by Application 2019 & 2032
- Table 87: South Korea Digital Health Monitoring Devices Revenue (million) Forecast, by Application 2019 & 2032
- Table 88: South Korea Digital Health Monitoring Devices Volume (K) Forecast, by Application 2019 & 2032
- Table 89: ASEAN Digital Health Monitoring Devices Revenue (million) Forecast, by Application 2019 & 2032
- Table 90: ASEAN Digital Health Monitoring Devices Volume (K) Forecast, by Application 2019 & 2032
- Table 91: Oceania Digital Health Monitoring Devices Revenue (million) Forecast, by Application 2019 & 2032
- Table 92: Oceania Digital Health Monitoring Devices Volume (K) Forecast, by Application 2019 & 2032
- Table 93: Rest of Asia Pacific Digital Health Monitoring Devices Revenue (million) Forecast, by Application 2019 & 2032
- Table 94: Rest of Asia Pacific Digital Health Monitoring Devices Volume (K) Forecast, by Application 2019 & 2032
Frequently Asked Questions
1. What is the projected Compound Annual Growth Rate (CAGR) of the Digital Health Monitoring Devices?
The projected CAGR is approximately XXX%.
2. Which companies are prominent players in the Digital Health Monitoring Devices?
Key companies in the market include Medtronic, Boston Scientific Corporation, NEVRO CORP, Cyberonics, Inc., Inspire Medical Systems, Inc., SPR Therapeutics, ALEVA NEUROTHERAPEUTICS SA, Bioness Inc., ReShape Lifesciences, Inc., LivaNova PLC, NeuroPace, Inc., Synapse Biomedical Inc., Soterix Medical Inc., Accellent Technologies, Inc., Abbott, Bioventus.
3. What are the main segments of the Digital Health Monitoring Devices?
The market segments include Application, Type.
4. Can you provide details about the market size?
The market size is estimated to be USD XXX million as of 2022.
5. What are some drivers contributing to market growth?
N/A
6. What are the notable trends driving market growth?
N/A
7. Are there any restraints impacting market growth?
N/A
8. Can you provide examples of recent developments in the market?
N/A
9. What pricing options are available for accessing the report?
Pricing options include single-user, multi-user, and enterprise licenses priced at USD 3950.00, USD 5925.00, and USD 7900.00 respectively.
10. Is the market size provided in terms of value or volume?
The market size is provided in terms of value, measured in million and volume, measured in K.
11. Are there any specific market keywords associated with the report?
Yes, the market keyword associated with the report is "Digital Health Monitoring Devices," which aids in identifying and referencing the specific market segment covered.
12. How do I determine which pricing option suits my needs best?
The pricing options vary based on user requirements and access needs. Individual users may opt for single-user licenses, while businesses requiring broader access may choose multi-user or enterprise licenses for cost-effective access to the report.
13. Are there any additional resources or data provided in the Digital Health Monitoring Devices report?
While the report offers comprehensive insights, it's advisable to review the specific contents or supplementary materials provided to ascertain if additional resources or data are available.
14. How can I stay updated on further developments or reports in the Digital Health Monitoring Devices?
To stay informed about further developments, trends, and reports in the Digital Health Monitoring Devices, consider subscribing to industry newsletters, following relevant companies and organizations, or regularly checking reputable industry news sources and publications.
Methodology
Step 1 - Identification of Relevant Samples Size from Population Database


Step 2 - Approaches for Defining Global Market Size (Value, Volume* & Price*)

Note*: In applicable scenarios
Step 3 - Data Sources
Primary Research
- Web Analytics
- Survey Reports
- Research Institute
- Latest Research Reports
- Opinion Leaders
Secondary Research
- Annual Reports
- White Paper
- Latest Press Release
- Industry Association
- Paid Database
- Investor Presentations

Step 4 - Data Triangulation
Involves using different sources of information in order to increase the validity of a study
These sources are likely to be stakeholders in a program - participants, other researchers, program staff, other community members, and so on.
Then we put all data in single framework & apply various statistical tools to find out the dynamic on the market.
During the analysis stage, feedback from the stakeholder groups would be compared to determine areas of agreement as well as areas of divergence
