

Key Insights
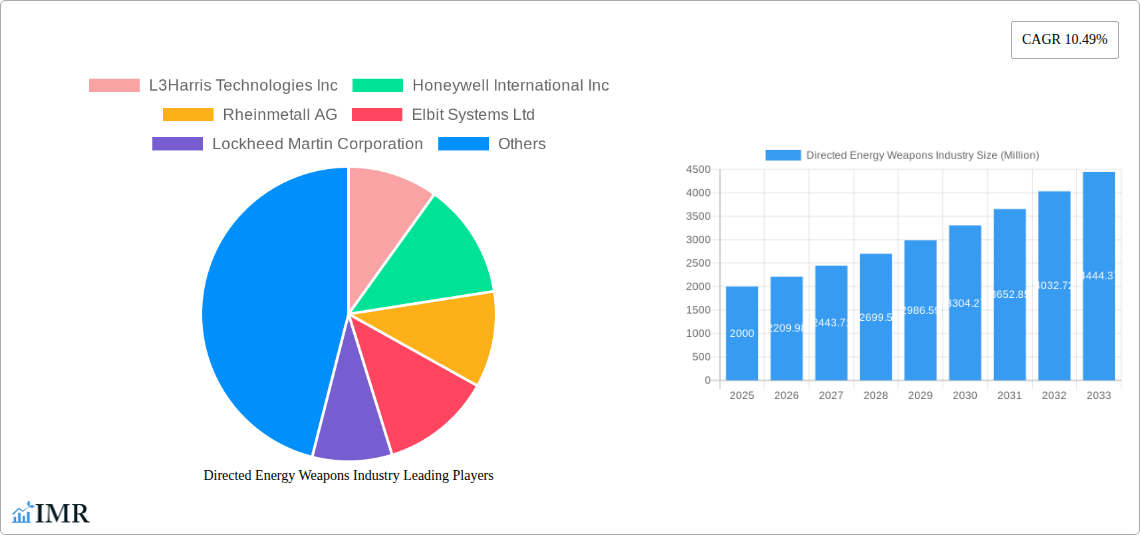
The Directed Energy Weapons (DEW) market, valued at approximately $2 billion in 2025, is experiencing robust growth, projected to reach $4 billion by 2033, driven by a 10.49% compound annual growth rate (CAGR). This expansion is fueled by increasing geopolitical tensions, the demand for precise and effective defense systems, and advancements in laser and microwave technology. The key drivers include the need for counter-drone capabilities, enhanced precision in targeting, and the potential for reduced collateral damage compared to traditional weaponry. Technological advancements are leading to smaller, lighter, and more energy-efficient DEW systems, suitable for deployment across diverse platforms—land, sea, and air—expanding their applicability across various defense and security applications. While the market faces restraints such as high initial investment costs and the need for advanced power sources, the overall trend points towards significant long-term growth. The segmentation reveals a strong preference for laser-based systems, although microwave technology is rapidly gaining traction. North America currently holds a significant market share, reflecting substantial R&D investments and a strong defense industry presence, but the Asia-Pacific region is anticipated to witness significant growth due to increased defense budgets and modernization efforts.
The competitive landscape is characterized by major players like L3Harris Technologies, Honeywell International, and Lockheed Martin, demonstrating significant investments in research and development, strategic partnerships, and mergers and acquisitions to solidify their market positions. The development of directed energy weapons is particularly advanced in North America and Europe. However, the growing interest and investment in other regions such as Asia-Pacific are expected to reshape the global market dynamics in the coming years, challenging the current dominance of established players. The ongoing focus on miniaturization, improved power efficiency, and cost reduction will further drive the expansion of this critical defense technology sector.
Directed Energy Weapons Industry Market Report: 2019-2033
This comprehensive report provides a detailed analysis of the Directed Energy Weapons (DEW) industry, encompassing market dynamics, growth trends, regional dominance, product landscape, key players, and future outlook. The study period spans 2019-2033, with 2025 as the base and estimated year. The forecast period is 2025-2033, and the historical period covers 2019-2024. The report segments the market by Type (Laser, Microwave, Other Types) and Platform (Land, Sea, Air), providing granular insights into each segment’s growth trajectory. The total market size is expected to reach xx Million by 2033.
Directed Energy Weapons Industry Market Dynamics & Structure
The Directed Energy Weapons (DEW) market is characterized by moderate concentration, with key players such as L3Harris Technologies Inc, Honeywell International Inc, Rheinmetall AG, Elbit Systems Ltd, Lockheed Martin Corporation, MBDA, Rafael Advanced Defense Systems Ltd, RTX Corporation, QinetiQ Group, BAE Systems plc, Northrop Grumman Corporation, and The Boeing Company dominating market share. The market share of the top 5 players is estimated at 60% in 2025.
- Technological Innovation: Continuous advancements in laser and microwave technology, miniaturization, and power efficiency are driving market growth.
- Regulatory Frameworks: Stringent export controls and international treaties influence market access and deployment. The regulatory landscape is expected to evolve significantly over the forecast period.
- Competitive Product Substitutes: Traditional weaponry remains a significant competitor, although DEWs offer advantages in certain applications.
- End-User Demographics: Primarily defense forces (army, navy, air force) and homeland security agencies. Growing adoption by other government agencies is anticipated.
- M&A Trends: A moderate level of M&A activity is observed, with larger companies acquiring smaller specialized firms to enhance their technology portfolios. Approximately xx M&A deals were recorded in the historical period (2019-2024).
Directed Energy Weapons Industry Growth Trends & Insights
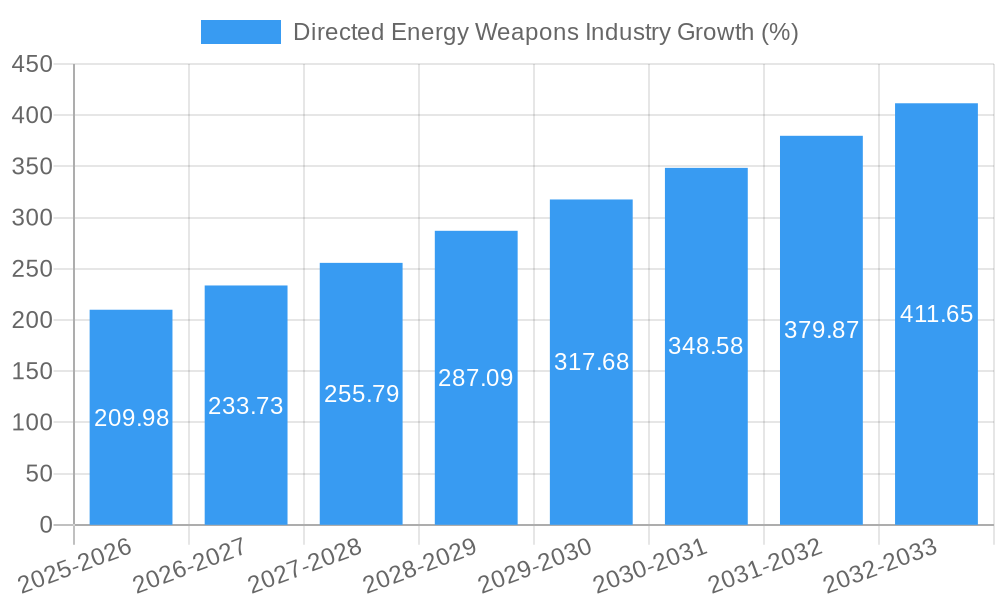
The DEW market is experiencing significant growth driven by increased defense budgets globally, rising geopolitical tensions, and the need for precision-guided, non-kinetic weapons. The market size is estimated at xx Million in 2025 and is projected to witness a Compound Annual Growth Rate (CAGR) of xx% from 2025 to 2033. Increased adoption rates among defense forces, particularly in advanced economies, are fueling this growth. Technological advancements such as improved energy efficiency, higher power output, and improved accuracy are also major contributors. Consumer behavior shifts are evident with a growing preference for advanced, precise weapons systems that minimize collateral damage. Market penetration is expected to increase from xx% in 2025 to xx% by 2033.
Dominant Regions, Countries, or Segments in Directed Energy Weapons Industry
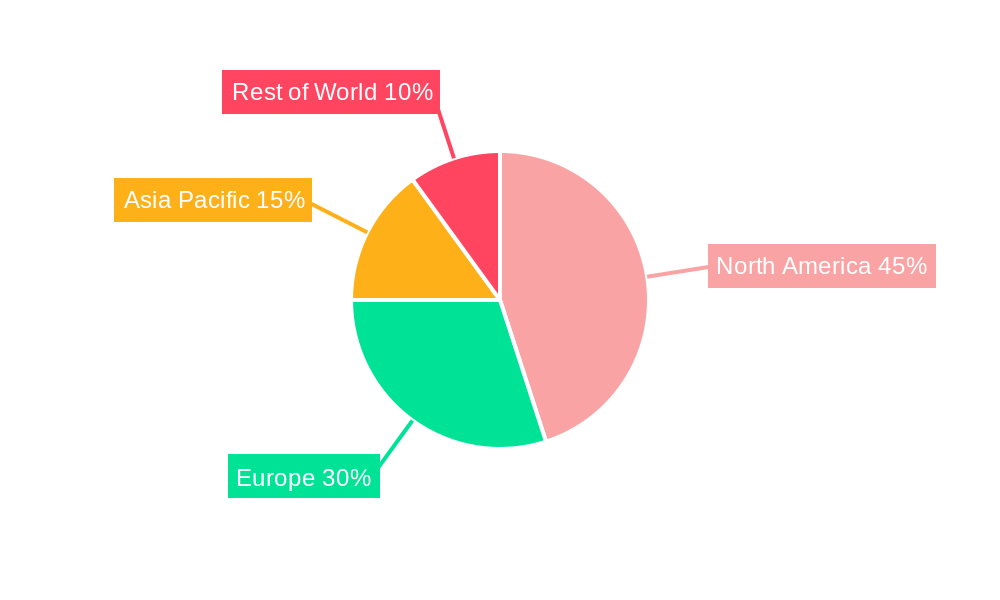
The North American region, particularly the United States, is currently the dominant market, driven by substantial defense spending, advanced technological capabilities, and robust R&D efforts. The European region is also a significant market, with several key players based there. The Asia-Pacific region is expected to witness robust growth over the forecast period, fueled by increasing defense modernization initiatives.
Type Segment: Laser weapons currently hold the largest market share, followed by Microwave and Other Types. The Laser segment is projected to maintain its dominance, driven by advancements in solid-state lasers and fiber lasers.
Platform Segment: The Air segment currently holds the highest market share, with Land and Sea segments projected to grow significantly.
Key Drivers:
- High defense budgets in major economies.
- Technological advancements in laser and microwave technologies.
- Growing demand for precision-guided weapons.
- Increasing geopolitical instability.
Dominance Factors:
- Strong R&D capabilities in leading countries.
- Favorable government policies and regulations.
- Early adoption by defense forces.
Directed Energy Weapons Industry Product Landscape
The DEW product landscape is characterized by a diverse range of weapons, including high-power lasers for targeting and disabling vehicles and low-power lasers for blinding sensors or targeting systems. Microwave weapons are designed to disrupt enemy electronic systems. Continuous advancements focus on improving power output, accuracy, and range while reducing size and weight. Unique selling propositions include enhanced precision, reduced collateral damage, and cost-effectiveness compared to traditional weaponry. Technological advancements such as adaptive optics and beam steering technologies are enhancing the performance and capabilities of DEWs.
Key Drivers, Barriers & Challenges in Directed Energy Weapons Industry
Key Drivers:
- Growing demand for precision-guided weapons systems to minimize collateral damage.
- Increasing defense budgets globally, especially in major economies.
- Advancements in laser and microwave technologies leading to higher power, accuracy, and efficiency.
Key Challenges and Restraints:
- High development and production costs limiting widespread adoption.
- Potential for unintended consequences and ethical concerns.
- Regulatory and export control complexities hindering market access.
- Technological limitations including atmospheric effects and power requirements. (Estimated impact on market growth: -xx% by 2033)
Emerging Opportunities in Directed Energy Weapons Industry
- Expanding applications in counter-drone systems and anti-missile defense.
- Development of portable and lightweight DEW systems for tactical applications.
- Growing interest in directed energy solutions for non-military applications (e.g., industrial processes).
Growth Accelerators in the Directed Energy Weapons Industry
Strategic partnerships between defense contractors and research institutions are accelerating innovation and development. Technological breakthroughs in high-power lasers and microwave sources are expanding capabilities and lowering costs. Market expansion is fueled by increasing adoption of DEWs in various defense and security applications, along with the exploration of new use cases in both military and civilian sectors.
Key Players Shaping the Directed Energy Weapons Industry Market
- L3Harris Technologies Inc
- Honeywell International Inc
- Rheinmetall AG
- Elbit Systems Ltd
- Lockheed Martin Corporation
- MBDA
- Rafael Advanced Defense Systems Ltd
- RTX Corporation
- QinetiQ Group
- BAE Systems plc
- Northrop Grumman Corporation
- The Boeing Company
Notable Milestones in Directed Energy Weapons Industry Sector
- May 2022: Rheinmetall successfully tested a laser weapon technology demonstrator for the German Bundeswehr. This signifies a major step towards operational deployment.
- July 2021: The US Navy and Air Force Research Laboratory (AFRL) initiated a five-year project to develop high-power microwave technology for disabling adversary electronics. This collaboration highlights the growing interest in microwave DEWs.
In-Depth Directed Energy Weapons Industry Market Outlook
The DEW market is poised for substantial growth, driven by continuous technological advancements, increasing defense spending, and a growing need for precise, non-kinetic weapon systems. Strategic partnerships and collaborations will play a crucial role in accelerating innovation and market expansion. The focus on developing more efficient, cost-effective, and versatile DEWs will drive future market potential. New applications, particularly in counter-UAS and anti-missile defense, represent significant opportunities for growth and market penetration.
Directed Energy Weapons Industry Segmentation
- 1. Production Analysis
- 2. Consumption Analysis
- 3. Import Market Analysis (Value & Volume)
- 4. Export Market Analysis (Value & Volume)
- 5. Price Trend Analysis
Directed Energy Weapons Industry Segmentation By Geography
-
1. North America
- 1.1. United States
- 1.2. Canada
- 1.3. Mexico
-
2. South America
- 2.1. Brazil
- 2.2. Argentina
- 2.3. Rest of South America
-
3. Europe
- 3.1. United Kingdom
- 3.2. Germany
- 3.3. France
- 3.4. Italy
- 3.5. Spain
- 3.6. Russia
- 3.7. Benelux
- 3.8. Nordics
- 3.9. Rest of Europe
-
4. Middle East & Africa
- 4.1. Turkey
- 4.2. Israel
- 4.3. GCC
- 4.4. North Africa
- 4.5. South Africa
- 4.6. Rest of Middle East & Africa
-
5. Asia Pacific
- 5.1. China
- 5.2. India
- 5.3. Japan
- 5.4. South Korea
- 5.5. ASEAN
- 5.6. Oceania
- 5.7. Rest of Asia Pacific
Directed Energy Weapons Industry REPORT HIGHLIGHTS
| Aspects | Details |
|---|---|
| Study Period | 2019-2033 |
| Base Year | 2024 |
| Estimated Year | 2025 |
| Forecast Period | 2025-2033 |
| Historical Period | 2019-2024 |
| Growth Rate | CAGR of 10.49% from 2019-2033 |
| Segmentation |
|
Table of Contents
- 1. Introduction
- 1.1. Research Scope
- 1.2. Market Segmentation
- 1.3. Research Methodology
- 1.4. Definitions and Assumptions
- 2. Executive Summary
- 2.1. Introduction
- 3. Market Dynamics
- 3.1. Introduction
- 3.2. Market Drivers
- 3.2.1. Increase in Internet of Things (IoT) and Autonomous Systems; Rise in Demand for Military and Defense Satellite Communication Solutions
- 3.3. Market Restrains
- 3.3.1. Cybersecurity Threats to Satellite Communication; Interference in Transmission of Data
- 3.4. Market Trends
- 3.4.1. Sea Segment Expected to WItness Rapid Growth
- 4. Market Factor Analysis
- 4.1. Porters Five Forces
- 4.2. Supply/Value Chain
- 4.3. PESTEL analysis
- 4.4. Market Entropy
- 4.5. Patent/Trademark Analysis
- 5. Global Directed Energy Weapons Industry Analysis, Insights and Forecast, 2019-2031
- 5.1. Market Analysis, Insights and Forecast - by Production Analysis
- 5.2. Market Analysis, Insights and Forecast - by Consumption Analysis
- 5.3. Market Analysis, Insights and Forecast - by Import Market Analysis (Value & Volume)
- 5.4. Market Analysis, Insights and Forecast - by Export Market Analysis (Value & Volume)
- 5.5. Market Analysis, Insights and Forecast - by Price Trend Analysis
- 5.6. Market Analysis, Insights and Forecast - by Region
- 5.6.1. North America
- 5.6.2. South America
- 5.6.3. Europe
- 5.6.4. Middle East & Africa
- 5.6.5. Asia Pacific
- 5.1. Market Analysis, Insights and Forecast - by Production Analysis
- 6. North America Directed Energy Weapons Industry Analysis, Insights and Forecast, 2019-2031
- 6.1. Market Analysis, Insights and Forecast - by Production Analysis
- 6.2. Market Analysis, Insights and Forecast - by Consumption Analysis
- 6.3. Market Analysis, Insights and Forecast - by Import Market Analysis (Value & Volume)
- 6.4. Market Analysis, Insights and Forecast - by Export Market Analysis (Value & Volume)
- 6.5. Market Analysis, Insights and Forecast - by Price Trend Analysis
- 6.1. Market Analysis, Insights and Forecast - by Production Analysis
- 7. South America Directed Energy Weapons Industry Analysis, Insights and Forecast, 2019-2031
- 7.1. Market Analysis, Insights and Forecast - by Production Analysis
- 7.2. Market Analysis, Insights and Forecast - by Consumption Analysis
- 7.3. Market Analysis, Insights and Forecast - by Import Market Analysis (Value & Volume)
- 7.4. Market Analysis, Insights and Forecast - by Export Market Analysis (Value & Volume)
- 7.5. Market Analysis, Insights and Forecast - by Price Trend Analysis
- 7.1. Market Analysis, Insights and Forecast - by Production Analysis
- 8. Europe Directed Energy Weapons Industry Analysis, Insights and Forecast, 2019-2031
- 8.1. Market Analysis, Insights and Forecast - by Production Analysis
- 8.2. Market Analysis, Insights and Forecast - by Consumption Analysis
- 8.3. Market Analysis, Insights and Forecast - by Import Market Analysis (Value & Volume)
- 8.4. Market Analysis, Insights and Forecast - by Export Market Analysis (Value & Volume)
- 8.5. Market Analysis, Insights and Forecast - by Price Trend Analysis
- 8.1. Market Analysis, Insights and Forecast - by Production Analysis
- 9. Middle East & Africa Directed Energy Weapons Industry Analysis, Insights and Forecast, 2019-2031
- 9.1. Market Analysis, Insights and Forecast - by Production Analysis
- 9.2. Market Analysis, Insights and Forecast - by Consumption Analysis
- 9.3. Market Analysis, Insights and Forecast - by Import Market Analysis (Value & Volume)
- 9.4. Market Analysis, Insights and Forecast - by Export Market Analysis (Value & Volume)
- 9.5. Market Analysis, Insights and Forecast - by Price Trend Analysis
- 9.1. Market Analysis, Insights and Forecast - by Production Analysis
- 10. Asia Pacific Directed Energy Weapons Industry Analysis, Insights and Forecast, 2019-2031
- 10.1. Market Analysis, Insights and Forecast - by Production Analysis
- 10.2. Market Analysis, Insights and Forecast - by Consumption Analysis
- 10.3. Market Analysis, Insights and Forecast - by Import Market Analysis (Value & Volume)
- 10.4. Market Analysis, Insights and Forecast - by Export Market Analysis (Value & Volume)
- 10.5. Market Analysis, Insights and Forecast - by Price Trend Analysis
- 10.1. Market Analysis, Insights and Forecast - by Production Analysis
- 11. North America Directed Energy Weapons Industry Analysis, Insights and Forecast, 2019-2031
- 11.1. Market Analysis, Insights and Forecast - By Country/Sub-region
- 11.1.1.
- 12. Europe Directed Energy Weapons Industry Analysis, Insights and Forecast, 2019-2031
- 12.1. Market Analysis, Insights and Forecast - By Country/Sub-region
- 12.1.1.
- 13. Asia Pacific Directed Energy Weapons Industry Analysis, Insights and Forecast, 2019-2031
- 13.1. Market Analysis, Insights and Forecast - By Country/Sub-region
- 13.1.1.
- 14. Rest of the World Directed Energy Weapons Industry Analysis, Insights and Forecast, 2019-2031
- 14.1. Market Analysis, Insights and Forecast - By Country/Sub-region
- 14.1.1.
- 15. Competitive Analysis
- 15.1. Global Market Share Analysis 2024
- 15.2. Company Profiles
- 15.2.1 L3Harris Technologies Inc
- 15.2.1.1. Overview
- 15.2.1.2. Products
- 15.2.1.3. SWOT Analysis
- 15.2.1.4. Recent Developments
- 15.2.1.5. Financials (Based on Availability)
- 15.2.2 Honeywell International Inc
- 15.2.2.1. Overview
- 15.2.2.2. Products
- 15.2.2.3. SWOT Analysis
- 15.2.2.4. Recent Developments
- 15.2.2.5. Financials (Based on Availability)
- 15.2.3 Rheinmetall AG
- 15.2.3.1. Overview
- 15.2.3.2. Products
- 15.2.3.3. SWOT Analysis
- 15.2.3.4. Recent Developments
- 15.2.3.5. Financials (Based on Availability)
- 15.2.4 Elbit Systems Ltd
- 15.2.4.1. Overview
- 15.2.4.2. Products
- 15.2.4.3. SWOT Analysis
- 15.2.4.4. Recent Developments
- 15.2.4.5. Financials (Based on Availability)
- 15.2.5 Lockheed Martin Corporation
- 15.2.5.1. Overview
- 15.2.5.2. Products
- 15.2.5.3. SWOT Analysis
- 15.2.5.4. Recent Developments
- 15.2.5.5. Financials (Based on Availability)
- 15.2.6 MBDA
- 15.2.6.1. Overview
- 15.2.6.2. Products
- 15.2.6.3. SWOT Analysis
- 15.2.6.4. Recent Developments
- 15.2.6.5. Financials (Based on Availability)
- 15.2.7 Rafael Advanced Defense Systems Ltd
- 15.2.7.1. Overview
- 15.2.7.2. Products
- 15.2.7.3. SWOT Analysis
- 15.2.7.4. Recent Developments
- 15.2.7.5. Financials (Based on Availability)
- 15.2.8 RTX Corporation
- 15.2.8.1. Overview
- 15.2.8.2. Products
- 15.2.8.3. SWOT Analysis
- 15.2.8.4. Recent Developments
- 15.2.8.5. Financials (Based on Availability)
- 15.2.9 QinetiQ Grou
- 15.2.9.1. Overview
- 15.2.9.2. Products
- 15.2.9.3. SWOT Analysis
- 15.2.9.4. Recent Developments
- 15.2.9.5. Financials (Based on Availability)
- 15.2.10 BAE Systems plc
- 15.2.10.1. Overview
- 15.2.10.2. Products
- 15.2.10.3. SWOT Analysis
- 15.2.10.4. Recent Developments
- 15.2.10.5. Financials (Based on Availability)
- 15.2.11 Northrop Grumman Corporation
- 15.2.11.1. Overview
- 15.2.11.2. Products
- 15.2.11.3. SWOT Analysis
- 15.2.11.4. Recent Developments
- 15.2.11.5. Financials (Based on Availability)
- 15.2.12 The Boeing Company
- 15.2.12.1. Overview
- 15.2.12.2. Products
- 15.2.12.3. SWOT Analysis
- 15.2.12.4. Recent Developments
- 15.2.12.5. Financials (Based on Availability)
- 15.2.1 L3Harris Technologies Inc
List of Figures
- Figure 1: Global Directed Energy Weapons Industry Revenue Breakdown (Million, %) by Region 2024 & 2032
- Figure 2: North America Directed Energy Weapons Industry Revenue (Million), by Country 2024 & 2032
- Figure 3: North America Directed Energy Weapons Industry Revenue Share (%), by Country 2024 & 2032
- Figure 4: Europe Directed Energy Weapons Industry Revenue (Million), by Country 2024 & 2032
- Figure 5: Europe Directed Energy Weapons Industry Revenue Share (%), by Country 2024 & 2032
- Figure 6: Asia Pacific Directed Energy Weapons Industry Revenue (Million), by Country 2024 & 2032
- Figure 7: Asia Pacific Directed Energy Weapons Industry Revenue Share (%), by Country 2024 & 2032
- Figure 8: Rest of the World Directed Energy Weapons Industry Revenue (Million), by Country 2024 & 2032
- Figure 9: Rest of the World Directed Energy Weapons Industry Revenue Share (%), by Country 2024 & 2032
- Figure 10: North America Directed Energy Weapons Industry Revenue (Million), by Production Analysis 2024 & 2032
- Figure 11: North America Directed Energy Weapons Industry Revenue Share (%), by Production Analysis 2024 & 2032
- Figure 12: North America Directed Energy Weapons Industry Revenue (Million), by Consumption Analysis 2024 & 2032
- Figure 13: North America Directed Energy Weapons Industry Revenue Share (%), by Consumption Analysis 2024 & 2032
- Figure 14: North America Directed Energy Weapons Industry Revenue (Million), by Import Market Analysis (Value & Volume) 2024 & 2032
- Figure 15: North America Directed Energy Weapons Industry Revenue Share (%), by Import Market Analysis (Value & Volume) 2024 & 2032
- Figure 16: North America Directed Energy Weapons Industry Revenue (Million), by Export Market Analysis (Value & Volume) 2024 & 2032
- Figure 17: North America Directed Energy Weapons Industry Revenue Share (%), by Export Market Analysis (Value & Volume) 2024 & 2032
- Figure 18: North America Directed Energy Weapons Industry Revenue (Million), by Price Trend Analysis 2024 & 2032
- Figure 19: North America Directed Energy Weapons Industry Revenue Share (%), by Price Trend Analysis 2024 & 2032
- Figure 20: North America Directed Energy Weapons Industry Revenue (Million), by Country 2024 & 2032
- Figure 21: North America Directed Energy Weapons Industry Revenue Share (%), by Country 2024 & 2032
- Figure 22: South America Directed Energy Weapons Industry Revenue (Million), by Production Analysis 2024 & 2032
- Figure 23: South America Directed Energy Weapons Industry Revenue Share (%), by Production Analysis 2024 & 2032
- Figure 24: South America Directed Energy Weapons Industry Revenue (Million), by Consumption Analysis 2024 & 2032
- Figure 25: South America Directed Energy Weapons Industry Revenue Share (%), by Consumption Analysis 2024 & 2032
- Figure 26: South America Directed Energy Weapons Industry Revenue (Million), by Import Market Analysis (Value & Volume) 2024 & 2032
- Figure 27: South America Directed Energy Weapons Industry Revenue Share (%), by Import Market Analysis (Value & Volume) 2024 & 2032
- Figure 28: South America Directed Energy Weapons Industry Revenue (Million), by Export Market Analysis (Value & Volume) 2024 & 2032
- Figure 29: South America Directed Energy Weapons Industry Revenue Share (%), by Export Market Analysis (Value & Volume) 2024 & 2032
- Figure 30: South America Directed Energy Weapons Industry Revenue (Million), by Price Trend Analysis 2024 & 2032
- Figure 31: South America Directed Energy Weapons Industry Revenue Share (%), by Price Trend Analysis 2024 & 2032
- Figure 32: South America Directed Energy Weapons Industry Revenue (Million), by Country 2024 & 2032
- Figure 33: South America Directed Energy Weapons Industry Revenue Share (%), by Country 2024 & 2032
- Figure 34: Europe Directed Energy Weapons Industry Revenue (Million), by Production Analysis 2024 & 2032
- Figure 35: Europe Directed Energy Weapons Industry Revenue Share (%), by Production Analysis 2024 & 2032
- Figure 36: Europe Directed Energy Weapons Industry Revenue (Million), by Consumption Analysis 2024 & 2032
- Figure 37: Europe Directed Energy Weapons Industry Revenue Share (%), by Consumption Analysis 2024 & 2032
- Figure 38: Europe Directed Energy Weapons Industry Revenue (Million), by Import Market Analysis (Value & Volume) 2024 & 2032
- Figure 39: Europe Directed Energy Weapons Industry Revenue Share (%), by Import Market Analysis (Value & Volume) 2024 & 2032
- Figure 40: Europe Directed Energy Weapons Industry Revenue (Million), by Export Market Analysis (Value & Volume) 2024 & 2032
- Figure 41: Europe Directed Energy Weapons Industry Revenue Share (%), by Export Market Analysis (Value & Volume) 2024 & 2032
- Figure 42: Europe Directed Energy Weapons Industry Revenue (Million), by Price Trend Analysis 2024 & 2032
- Figure 43: Europe Directed Energy Weapons Industry Revenue Share (%), by Price Trend Analysis 2024 & 2032
- Figure 44: Europe Directed Energy Weapons Industry Revenue (Million), by Country 2024 & 2032
- Figure 45: Europe Directed Energy Weapons Industry Revenue Share (%), by Country 2024 & 2032
- Figure 46: Middle East & Africa Directed Energy Weapons Industry Revenue (Million), by Production Analysis 2024 & 2032
- Figure 47: Middle East & Africa Directed Energy Weapons Industry Revenue Share (%), by Production Analysis 2024 & 2032
- Figure 48: Middle East & Africa Directed Energy Weapons Industry Revenue (Million), by Consumption Analysis 2024 & 2032
- Figure 49: Middle East & Africa Directed Energy Weapons Industry Revenue Share (%), by Consumption Analysis 2024 & 2032
- Figure 50: Middle East & Africa Directed Energy Weapons Industry Revenue (Million), by Import Market Analysis (Value & Volume) 2024 & 2032
- Figure 51: Middle East & Africa Directed Energy Weapons Industry Revenue Share (%), by Import Market Analysis (Value & Volume) 2024 & 2032
- Figure 52: Middle East & Africa Directed Energy Weapons Industry Revenue (Million), by Export Market Analysis (Value & Volume) 2024 & 2032
- Figure 53: Middle East & Africa Directed Energy Weapons Industry Revenue Share (%), by Export Market Analysis (Value & Volume) 2024 & 2032
- Figure 54: Middle East & Africa Directed Energy Weapons Industry Revenue (Million), by Price Trend Analysis 2024 & 2032
- Figure 55: Middle East & Africa Directed Energy Weapons Industry Revenue Share (%), by Price Trend Analysis 2024 & 2032
- Figure 56: Middle East & Africa Directed Energy Weapons Industry Revenue (Million), by Country 2024 & 2032
- Figure 57: Middle East & Africa Directed Energy Weapons Industry Revenue Share (%), by Country 2024 & 2032
- Figure 58: Asia Pacific Directed Energy Weapons Industry Revenue (Million), by Production Analysis 2024 & 2032
- Figure 59: Asia Pacific Directed Energy Weapons Industry Revenue Share (%), by Production Analysis 2024 & 2032
- Figure 60: Asia Pacific Directed Energy Weapons Industry Revenue (Million), by Consumption Analysis 2024 & 2032
- Figure 61: Asia Pacific Directed Energy Weapons Industry Revenue Share (%), by Consumption Analysis 2024 & 2032
- Figure 62: Asia Pacific Directed Energy Weapons Industry Revenue (Million), by Import Market Analysis (Value & Volume) 2024 & 2032
- Figure 63: Asia Pacific Directed Energy Weapons Industry Revenue Share (%), by Import Market Analysis (Value & Volume) 2024 & 2032
- Figure 64: Asia Pacific Directed Energy Weapons Industry Revenue (Million), by Export Market Analysis (Value & Volume) 2024 & 2032
- Figure 65: Asia Pacific Directed Energy Weapons Industry Revenue Share (%), by Export Market Analysis (Value & Volume) 2024 & 2032
- Figure 66: Asia Pacific Directed Energy Weapons Industry Revenue (Million), by Price Trend Analysis 2024 & 2032
- Figure 67: Asia Pacific Directed Energy Weapons Industry Revenue Share (%), by Price Trend Analysis 2024 & 2032
- Figure 68: Asia Pacific Directed Energy Weapons Industry Revenue (Million), by Country 2024 & 2032
- Figure 69: Asia Pacific Directed Energy Weapons Industry Revenue Share (%), by Country 2024 & 2032
List of Tables
- Table 1: Global Directed Energy Weapons Industry Revenue Million Forecast, by Region 2019 & 2032
- Table 2: Global Directed Energy Weapons Industry Revenue Million Forecast, by Production Analysis 2019 & 2032
- Table 3: Global Directed Energy Weapons Industry Revenue Million Forecast, by Consumption Analysis 2019 & 2032
- Table 4: Global Directed Energy Weapons Industry Revenue Million Forecast, by Import Market Analysis (Value & Volume) 2019 & 2032
- Table 5: Global Directed Energy Weapons Industry Revenue Million Forecast, by Export Market Analysis (Value & Volume) 2019 & 2032
- Table 6: Global Directed Energy Weapons Industry Revenue Million Forecast, by Price Trend Analysis 2019 & 2032
- Table 7: Global Directed Energy Weapons Industry Revenue Million Forecast, by Region 2019 & 2032
- Table 8: Global Directed Energy Weapons Industry Revenue Million Forecast, by Country 2019 & 2032
- Table 9: Directed Energy Weapons Industry Revenue (Million) Forecast, by Application 2019 & 2032
- Table 10: Global Directed Energy Weapons Industry Revenue Million Forecast, by Country 2019 & 2032
- Table 11: Directed Energy Weapons Industry Revenue (Million) Forecast, by Application 2019 & 2032
- Table 12: Global Directed Energy Weapons Industry Revenue Million Forecast, by Country 2019 & 2032
- Table 13: Directed Energy Weapons Industry Revenue (Million) Forecast, by Application 2019 & 2032
- Table 14: Global Directed Energy Weapons Industry Revenue Million Forecast, by Country 2019 & 2032
- Table 15: Directed Energy Weapons Industry Revenue (Million) Forecast, by Application 2019 & 2032
- Table 16: Global Directed Energy Weapons Industry Revenue Million Forecast, by Production Analysis 2019 & 2032
- Table 17: Global Directed Energy Weapons Industry Revenue Million Forecast, by Consumption Analysis 2019 & 2032
- Table 18: Global Directed Energy Weapons Industry Revenue Million Forecast, by Import Market Analysis (Value & Volume) 2019 & 2032
- Table 19: Global Directed Energy Weapons Industry Revenue Million Forecast, by Export Market Analysis (Value & Volume) 2019 & 2032
- Table 20: Global Directed Energy Weapons Industry Revenue Million Forecast, by Price Trend Analysis 2019 & 2032
- Table 21: Global Directed Energy Weapons Industry Revenue Million Forecast, by Country 2019 & 2032
- Table 22: United States Directed Energy Weapons Industry Revenue (Million) Forecast, by Application 2019 & 2032
- Table 23: Canada Directed Energy Weapons Industry Revenue (Million) Forecast, by Application 2019 & 2032
- Table 24: Mexico Directed Energy Weapons Industry Revenue (Million) Forecast, by Application 2019 & 2032
- Table 25: Global Directed Energy Weapons Industry Revenue Million Forecast, by Production Analysis 2019 & 2032
- Table 26: Global Directed Energy Weapons Industry Revenue Million Forecast, by Consumption Analysis 2019 & 2032
- Table 27: Global Directed Energy Weapons Industry Revenue Million Forecast, by Import Market Analysis (Value & Volume) 2019 & 2032
- Table 28: Global Directed Energy Weapons Industry Revenue Million Forecast, by Export Market Analysis (Value & Volume) 2019 & 2032
- Table 29: Global Directed Energy Weapons Industry Revenue Million Forecast, by Price Trend Analysis 2019 & 2032
- Table 30: Global Directed Energy Weapons Industry Revenue Million Forecast, by Country 2019 & 2032
- Table 31: Brazil Directed Energy Weapons Industry Revenue (Million) Forecast, by Application 2019 & 2032
- Table 32: Argentina Directed Energy Weapons Industry Revenue (Million) Forecast, by Application 2019 & 2032
- Table 33: Rest of South America Directed Energy Weapons Industry Revenue (Million) Forecast, by Application 2019 & 2032
- Table 34: Global Directed Energy Weapons Industry Revenue Million Forecast, by Production Analysis 2019 & 2032
- Table 35: Global Directed Energy Weapons Industry Revenue Million Forecast, by Consumption Analysis 2019 & 2032
- Table 36: Global Directed Energy Weapons Industry Revenue Million Forecast, by Import Market Analysis (Value & Volume) 2019 & 2032
- Table 37: Global Directed Energy Weapons Industry Revenue Million Forecast, by Export Market Analysis (Value & Volume) 2019 & 2032
- Table 38: Global Directed Energy Weapons Industry Revenue Million Forecast, by Price Trend Analysis 2019 & 2032
- Table 39: Global Directed Energy Weapons Industry Revenue Million Forecast, by Country 2019 & 2032
- Table 40: United Kingdom Directed Energy Weapons Industry Revenue (Million) Forecast, by Application 2019 & 2032
- Table 41: Germany Directed Energy Weapons Industry Revenue (Million) Forecast, by Application 2019 & 2032
- Table 42: France Directed Energy Weapons Industry Revenue (Million) Forecast, by Application 2019 & 2032
- Table 43: Italy Directed Energy Weapons Industry Revenue (Million) Forecast, by Application 2019 & 2032
- Table 44: Spain Directed Energy Weapons Industry Revenue (Million) Forecast, by Application 2019 & 2032
- Table 45: Russia Directed Energy Weapons Industry Revenue (Million) Forecast, by Application 2019 & 2032
- Table 46: Benelux Directed Energy Weapons Industry Revenue (Million) Forecast, by Application 2019 & 2032
- Table 47: Nordics Directed Energy Weapons Industry Revenue (Million) Forecast, by Application 2019 & 2032
- Table 48: Rest of Europe Directed Energy Weapons Industry Revenue (Million) Forecast, by Application 2019 & 2032
- Table 49: Global Directed Energy Weapons Industry Revenue Million Forecast, by Production Analysis 2019 & 2032
- Table 50: Global Directed Energy Weapons Industry Revenue Million Forecast, by Consumption Analysis 2019 & 2032
- Table 51: Global Directed Energy Weapons Industry Revenue Million Forecast, by Import Market Analysis (Value & Volume) 2019 & 2032
- Table 52: Global Directed Energy Weapons Industry Revenue Million Forecast, by Export Market Analysis (Value & Volume) 2019 & 2032
- Table 53: Global Directed Energy Weapons Industry Revenue Million Forecast, by Price Trend Analysis 2019 & 2032
- Table 54: Global Directed Energy Weapons Industry Revenue Million Forecast, by Country 2019 & 2032
- Table 55: Turkey Directed Energy Weapons Industry Revenue (Million) Forecast, by Application 2019 & 2032
- Table 56: Israel Directed Energy Weapons Industry Revenue (Million) Forecast, by Application 2019 & 2032
- Table 57: GCC Directed Energy Weapons Industry Revenue (Million) Forecast, by Application 2019 & 2032
- Table 58: North Africa Directed Energy Weapons Industry Revenue (Million) Forecast, by Application 2019 & 2032
- Table 59: South Africa Directed Energy Weapons Industry Revenue (Million) Forecast, by Application 2019 & 2032
- Table 60: Rest of Middle East & Africa Directed Energy Weapons Industry Revenue (Million) Forecast, by Application 2019 & 2032
- Table 61: Global Directed Energy Weapons Industry Revenue Million Forecast, by Production Analysis 2019 & 2032
- Table 62: Global Directed Energy Weapons Industry Revenue Million Forecast, by Consumption Analysis 2019 & 2032
- Table 63: Global Directed Energy Weapons Industry Revenue Million Forecast, by Import Market Analysis (Value & Volume) 2019 & 2032
- Table 64: Global Directed Energy Weapons Industry Revenue Million Forecast, by Export Market Analysis (Value & Volume) 2019 & 2032
- Table 65: Global Directed Energy Weapons Industry Revenue Million Forecast, by Price Trend Analysis 2019 & 2032
- Table 66: Global Directed Energy Weapons Industry Revenue Million Forecast, by Country 2019 & 2032
- Table 67: China Directed Energy Weapons Industry Revenue (Million) Forecast, by Application 2019 & 2032
- Table 68: India Directed Energy Weapons Industry Revenue (Million) Forecast, by Application 2019 & 2032
- Table 69: Japan Directed Energy Weapons Industry Revenue (Million) Forecast, by Application 2019 & 2032
- Table 70: South Korea Directed Energy Weapons Industry Revenue (Million) Forecast, by Application 2019 & 2032
- Table 71: ASEAN Directed Energy Weapons Industry Revenue (Million) Forecast, by Application 2019 & 2032
- Table 72: Oceania Directed Energy Weapons Industry Revenue (Million) Forecast, by Application 2019 & 2032
- Table 73: Rest of Asia Pacific Directed Energy Weapons Industry Revenue (Million) Forecast, by Application 2019 & 2032
Frequently Asked Questions
1. What is the projected Compound Annual Growth Rate (CAGR) of the Directed Energy Weapons Industry?
The projected CAGR is approximately 10.49%.
2. Which companies are prominent players in the Directed Energy Weapons Industry?
Key companies in the market include L3Harris Technologies Inc, Honeywell International Inc, Rheinmetall AG, Elbit Systems Ltd, Lockheed Martin Corporation, MBDA, Rafael Advanced Defense Systems Ltd, RTX Corporation, QinetiQ Grou, BAE Systems plc, Northrop Grumman Corporation, The Boeing Company.
3. What are the main segments of the Directed Energy Weapons Industry?
The market segments include Production Analysis, Consumption Analysis, Import Market Analysis (Value & Volume), Export Market Analysis (Value & Volume), Price Trend Analysis.
4. Can you provide details about the market size?
The market size is estimated to be USD XX Million as of 2022.
5. What are some drivers contributing to market growth?
Increase in Internet of Things (IoT) and Autonomous Systems; Rise in Demand for Military and Defense Satellite Communication Solutions.
6. What are the notable trends driving market growth?
Sea Segment Expected to WItness Rapid Growth.
7. Are there any restraints impacting market growth?
Cybersecurity Threats to Satellite Communication; Interference in Transmission of Data.
8. Can you provide examples of recent developments in the market?
May 2022: Rheinmetall announced that it had successfully tested the laser weapon technology demonstrator version built on behalf of the German Bundeswehr forces.
9. What pricing options are available for accessing the report?
Pricing options include single-user, multi-user, and enterprise licenses priced at USD 4750, USD 5250, and USD 8750 respectively.
10. Is the market size provided in terms of value or volume?
The market size is provided in terms of value, measured in Million.
11. Are there any specific market keywords associated with the report?
Yes, the market keyword associated with the report is "Directed Energy Weapons Industry," which aids in identifying and referencing the specific market segment covered.
12. How do I determine which pricing option suits my needs best?
The pricing options vary based on user requirements and access needs. Individual users may opt for single-user licenses, while businesses requiring broader access may choose multi-user or enterprise licenses for cost-effective access to the report.
13. Are there any additional resources or data provided in the Directed Energy Weapons Industry report?
While the report offers comprehensive insights, it's advisable to review the specific contents or supplementary materials provided to ascertain if additional resources or data are available.
14. How can I stay updated on further developments or reports in the Directed Energy Weapons Industry?
To stay informed about further developments, trends, and reports in the Directed Energy Weapons Industry, consider subscribing to industry newsletters, following relevant companies and organizations, or regularly checking reputable industry news sources and publications.
Methodology
Step 1 - Identification of Relevant Samples Size from Population Database


Step 2 - Approaches for Defining Global Market Size (Value, Volume* & Price*)

Note*: In applicable scenarios
Step 3 - Data Sources
Primary Research
- Web Analytics
- Survey Reports
- Research Institute
- Latest Research Reports
- Opinion Leaders
Secondary Research
- Annual Reports
- White Paper
- Latest Press Release
- Industry Association
- Paid Database
- Investor Presentations

Step 4 - Data Triangulation
Involves using different sources of information in order to increase the validity of a study
These sources are likely to be stakeholders in a program - participants, other researchers, program staff, other community members, and so on.
Then we put all data in single framework & apply various statistical tools to find out the dynamic on the market.
During the analysis stage, feedback from the stakeholder groups would be compared to determine areas of agreement as well as areas of divergence
