

Key Insights
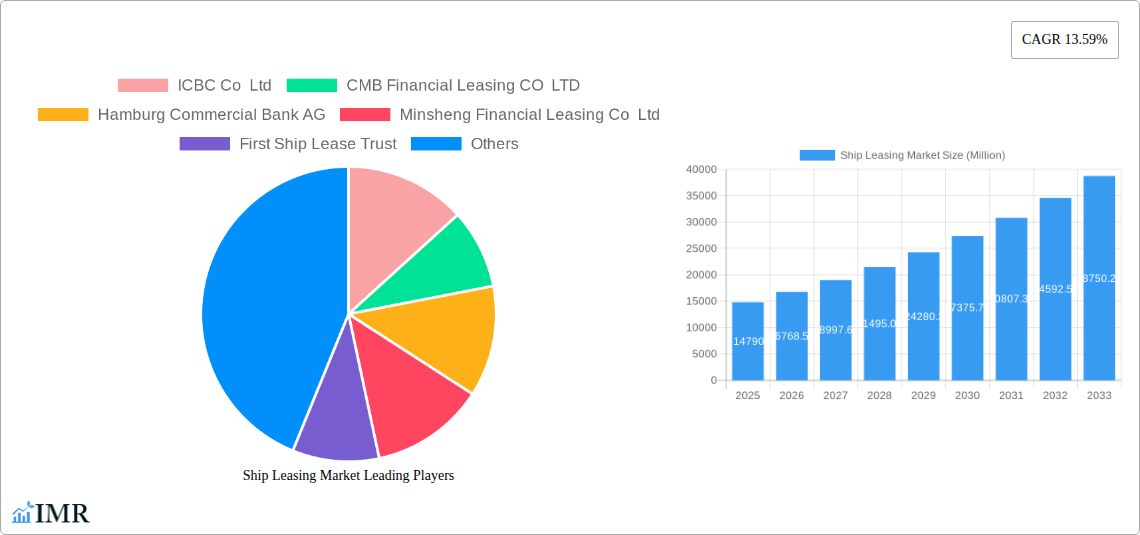
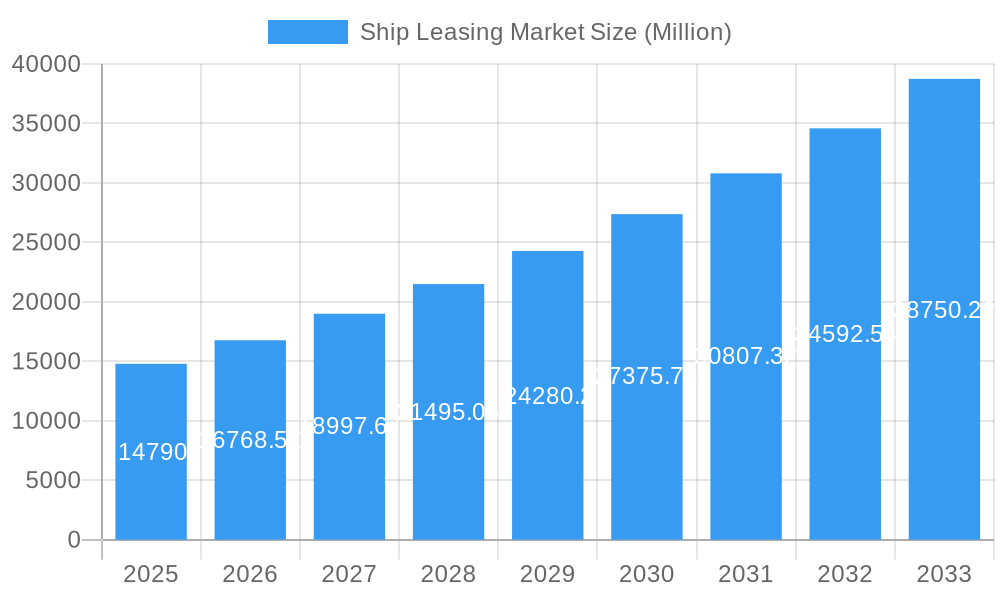
The global ship leasing market, valued at $14.79 billion in 2025, is projected to experience robust growth, driven by increasing global trade volumes and the rising demand for efficient and cost-effective shipping solutions. The market's Compound Annual Growth Rate (CAGR) of 13.59% from 2025 to 2033 indicates significant expansion opportunities. Key drivers include the growing preference for leasing over outright ownership, particularly among smaller shipping companies seeking to manage capital expenditure effectively. Furthermore, the ongoing evolution of shipping technology, including the adoption of more fuel-efficient vessels and digitalization initiatives, is influencing leasing contracts and fostering market growth. The market is segmented by lease type (financial lease, full-service lease), application (container ships, bulk carriers), and lease duration (real-time lease, periodic tenancy, bareboat charter). Competition is fierce, with major players like ICBC Co Ltd, CMB Financial Leasing CO LTD, and A P Møller - Mærsk A/S vying for market share. Geographical distribution shows strong presence in North America, Europe, and Asia Pacific, reflecting the global nature of the shipping industry. However, regulatory changes, fluctuations in fuel prices, and geopolitical instability represent potential market restraints.
Ship Leasing Market Market Size (In Billion)
The forecast period (2025-2033) is expected to witness a considerable increase in the demand for specialized vessels, such as LNG carriers and container ships, further fueling market growth. The Asia-Pacific region, particularly China and India, is anticipated to lead regional growth due to expanding trade activities and infrastructure development within these markets. The growing adoption of digital platforms for lease management and improved transparency in the leasing process is expected to enhance efficiency and attract more participants. Full-service leasing, which includes maintenance and operational support, is gaining traction, providing comprehensive solutions to lessors. Meanwhile, the emergence of new technologies, such as autonomous shipping, presents both opportunities and challenges, requiring adaptation and innovation within the leasing sector to meet evolving industry needs. Overall, the ship leasing market is poised for sustained growth, driven by a combination of favorable macroeconomic factors and technological advancements.
Ship Leasing Market Company Market Share
Ship Leasing Market: A Comprehensive Report (2019-2033)
This in-depth report provides a comprehensive analysis of the global Ship Leasing Market, encompassing its current state, future trajectory, and key players. The study period covers 2019-2033, with 2025 as the base and estimated year. We segment the market by lease type (Financial Lease, Full-Service Lease), application (Container Ships, Bulk Carriers), and lease type (Real-Time Lease, Periodic Tenancy, Bareboat Charter, Other Types), offering granular insights for informed decision-making. The report's quantitative and qualitative data, derived from rigorous research, equips stakeholders with the knowledge needed to navigate the complexities of this dynamic market. The market size is projected to reach xx Million by 2033.
Ship Leasing Market Dynamics & Structure
The global ship leasing market exhibits a moderately concentrated structure, with key players like ICBC Co Ltd, CMB Financial Leasing CO LTD, and A P Møller - Mærsk A/S holding significant market share. Technological innovations, such as digitalization of leasing processes and the adoption of advanced vessel monitoring systems, are key drivers. Stringent regulatory frameworks governing maritime safety and environmental compliance influence market dynamics. The market witnesses continuous competitive pressure from alternative financing options and evolving leasing structures. Mergers and acquisitions (M&A) activity is moderate, reflecting consolidation trends within the industry.
- Market Concentration: The top 5 players account for approximately xx% of the market share in 2025.
- Technological Innovation: Adoption of AI-powered predictive maintenance and IoT-based fleet management is accelerating.
- Regulatory Framework: IMO 2020 regulations and other environmental regulations significantly impact leasing contracts and vessel specifications.
- M&A Activity: An average of xx M&A deals per year were observed in the historical period (2019-2024).
- Innovation Barriers: High upfront investment costs and technological complexity can hinder innovation adoption.
Ship Leasing Market Growth Trends & Insights
The ship leasing market experienced significant growth in the historical period (2019-2024), driven by increasing global trade volumes and the demand for efficient shipping solutions. The market size is projected to grow at a CAGR of xx% during the forecast period (2025-2033), reaching xx Million by 2033. Technological disruptions, such as autonomous shipping technologies and the growing adoption of digital platforms, are reshaping market dynamics. Shifts in consumer behavior, with an increased focus on sustainability and environmental compliance, are influencing leasing preferences. Market penetration of digital leasing platforms is expected to increase significantly in the forecast period.
Dominant Regions, Countries, or Segments in Ship Leasing Market
Asia-Pacific is currently the dominant region in the ship leasing market, driven by robust economic growth, expanding trade activities, and a large fleet of vessels. Within lease types, Financial Lease holds the largest market share due to its flexible terms and cost-effectiveness. Container ships dominate application segments, fueled by the growth of global containerized trade.
- Key Drivers in Asia-Pacific: Strong economic growth, expanding port infrastructure, and government support for maritime industries.
- Financial Lease Dominance: Favorable tax implications and flexibility in lease terms contribute to its high market share.
- Container Ship Application: Growth in e-commerce and global trade fuels demand for container ship leasing.
- Market Share: Asia-Pacific holds approximately xx% of the global market share in 2025. Financial Lease holds xx%, and Container Ships hold xx%.
Ship Leasing Market Product Landscape
The ship leasing market offers a diverse range of products, including Financial Leases tailored to specific vessel types and operational needs, and Full-Service Leases encompassing maintenance and crew management. Innovative lease structures, such as real-time leases and periodic tenancy, cater to evolving customer requirements. Technological advancements enhance efficiency and transparency, with digital platforms streamlining processes and improving data visibility. Unique selling propositions focus on cost optimization, flexibility, and risk mitigation for lessees.
Key Drivers, Barriers & Challenges in Ship Leasing Market
Key Drivers: Growing global trade, increasing demand for efficient shipping solutions, and technological advancements driving operational efficiencies. Government initiatives supporting maritime development and infrastructure investments further accelerate market growth.
Key Challenges: Fluctuations in freight rates, geopolitical instability affecting trade routes, and stringent environmental regulations impacting vessel specifications and operational costs. These factors can lead to supply chain disruptions and increased leasing costs. The average cost of leasing a container ship increased by xx% in 2024 compared to 2019 due to various factors.
Emerging Opportunities in Ship Leasing Market
Untapped markets in developing economies, increasing demand for specialized vessels (e.g., LNG carriers), and the integration of sustainable technologies present significant opportunities. The rising adoption of digital leasing platforms and blockchain technology offer potential for enhanced transparency and efficiency. Focus on environmental sustainability and carbon reduction initiatives are driving demand for eco-friendly vessel leasing options.
Growth Accelerators in the Ship Leasing Market Industry
Technological advancements, such as autonomous vessel technology and AI-driven optimization, are set to redefine market dynamics. Strategic partnerships between leasing companies and technology providers are accelerating innovation. Expansion into new markets and diversification of vessel types offer significant growth potential.
Key Players Shaping the Ship Leasing Market Market
- ICBC Co Ltd
- CMB Financial Leasing CO LTD
- Hamburg Commercial Bank AG
- Minsheng Financial Leasing Co Ltd
- First Ship Lease Trust
- MUFG Bank Ltd
- Bothra Group
- Bank of Communications Financial Leasing Co Ltd
- Galbraiths Ltd
- A P Møller - Mærsk A/S
- Global Ship Lease Inc
Notable Milestones in Ship Leasing Market Sector
- 2021: Introduction of new digital platforms for lease management by several key players.
- 2022: Significant investment in eco-friendly vessel technologies by leading leasing companies.
- 2023: Several M&A deals were finalized resulting in market consolidation.
- 2024: Implementation of new regulations impacting vessel emission standards.
In-Depth Ship Leasing Market Market Outlook
The ship leasing market is poised for continued growth, driven by sustained global trade and the adoption of innovative technologies. Strategic partnerships, expansion into new markets, and investment in sustainable solutions will shape future market dynamics. The focus on operational efficiency and environmental compliance will create opportunities for companies offering advanced leasing solutions and technologically superior vessels.
Ship Leasing Market Segmentation
-
1. Lease Type
- 1.1. Financial Lease
- 1.2. Full-Service Lease
-
2. Application
- 2.1. Container Ships
- 2.2. Bulk Carriers
-
3. Type
- 3.1. Real-Time Lease
- 3.2. Periodic Tenancy
- 3.3. Bareboat Charter
- 3.4. Other Types
Ship Leasing Market Segmentation By Geography
-
1. North America
- 1.1. United States
- 1.2. Canada
-
2. Europe
- 2.1. United Kingdom
- 2.2. France
- 2.3. Germany
- 2.4. Rest of Europe
-
3. Asia Pacific
- 3.1. China
- 3.2. India
- 3.3. Japan
- 3.4. South Korea
- 3.5. Rest of Asia Pacific
-
4. Latin America
- 4.1. Brazil
- 4.2. Rest of Latin America
-
5. Middle East and Africa
- 5.1. United Arab Emirates
- 5.2. Saudi Arabia
- 5.3. South Africa
- 5.4. Rest of Middle East and Africa
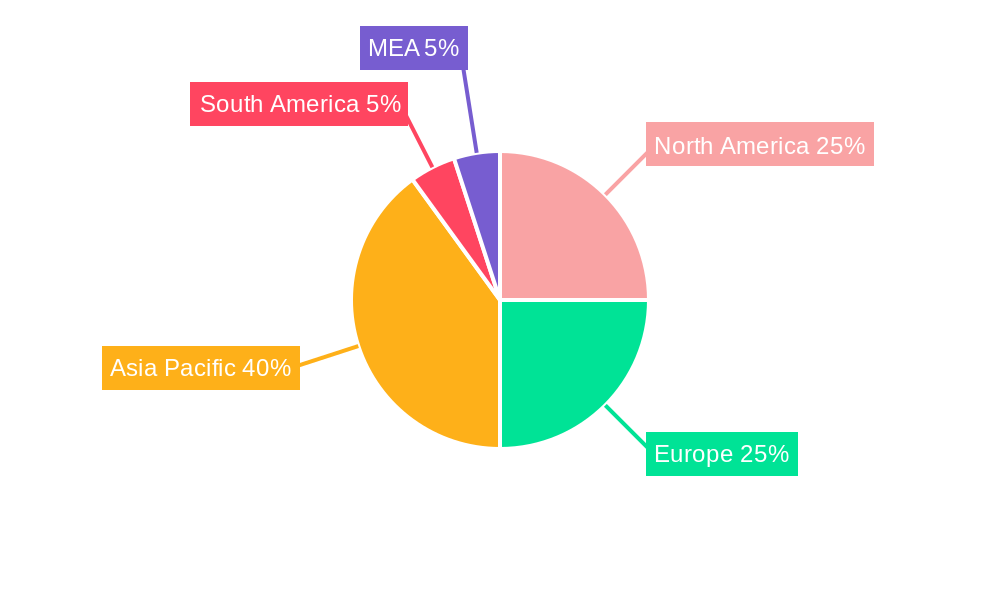
Ship Leasing Market Regional Market Share
Geographic Coverage of Ship Leasing Market
Ship Leasing Market REPORT HIGHLIGHTS
| Aspects | Details |
|---|---|
| Study Period | 2020-2034 |
| Base Year | 2025 |
| Estimated Year | 2026 |
| Forecast Period | 2026-2034 |
| Historical Period | 2020-2025 |
| Growth Rate | CAGR of 12% from 2020-2034 |
| Segmentation |
|
Table of Contents
- 1. Introduction
- 1.1. Research Scope
- 1.2. Market Segmentation
- 1.3. Research Objective
- 1.4. Definitions and Assumptions
- 2. Executive Summary
- 2.1. Market Snapshot
- 3. Market Dynamics
- 3.1. Market Drivers
- 3.2. Market Restrains
- 3.3. Market Trends
- 3.4. Market Opportunities
- 4. Market Factor Analysis
- 4.1. Porters Five Forces
- 4.1.1. Bargaining Power of Suppliers
- 4.1.2. Bargaining Power of Buyers
- 4.1.3. Threat of New Entrants
- 4.1.4. Threat of Substitutes
- 4.1.5. Competitive Rivalry
- 4.2. PESTEL analysis
- 4.3. BCG Analysis
- 4.3.1. Stars (High Growth, High Market Share)
- 4.3.2. Cash Cows (Low Growth, High Market Share)
- 4.3.3. Question Mark (High Growth, Low Market Share)
- 4.3.4. Dogs (Low Growth, Low Market Share)
- 4.4. Ansoff Matrix Analysis
- 4.5. Supply Chain Analysis
- 4.6. Regulatory Landscape
- 4.7. Current Market Potential and Opportunity Assessment (TAM–SAM–SOM Framework)
- 4.8. IMR Analyst Note
- 4.1. Porters Five Forces
- 5. Market Analysis, Insights and Forecast 2021-2033
- 5.1. Market Analysis, Insights and Forecast - by Lease Type
- 5.1.1. Financial Lease
- 5.1.2. Full-Service Lease
- 5.2. Market Analysis, Insights and Forecast - by Application
- 5.2.1. Container Ships
- 5.2.2. Bulk Carriers
- 5.3. Market Analysis, Insights and Forecast - by Type
- 5.3.1. Real-Time Lease
- 5.3.2. Periodic Tenancy
- 5.3.3. Bareboat Charter
- 5.3.4. Other Types
- 5.4. Market Analysis, Insights and Forecast - by Region
- 5.4.1. North America
- 5.4.2. Europe
- 5.4.3. Asia Pacific
- 5.4.4. Latin America
- 5.4.5. Middle East and Africa
- 5.1. Market Analysis, Insights and Forecast - by Lease Type
- 6. Global Ship Leasing Market Analysis, Insights and Forecast, 2021-2033
- 6.1. Market Analysis, Insights and Forecast - by Lease Type
- 6.1.1. Financial Lease
- 6.1.2. Full-Service Lease
- 6.2. Market Analysis, Insights and Forecast - by Application
- 6.2.1. Container Ships
- 6.2.2. Bulk Carriers
- 6.3. Market Analysis, Insights and Forecast - by Type
- 6.3.1. Real-Time Lease
- 6.3.2. Periodic Tenancy
- 6.3.3. Bareboat Charter
- 6.3.4. Other Types
- 6.1. Market Analysis, Insights and Forecast - by Lease Type
- 7. North America Ship Leasing Market Analysis, Insights and Forecast, 2020-2032
- 7.1. Market Analysis, Insights and Forecast - by Lease Type
- 7.1.1. Financial Lease
- 7.1.2. Full-Service Lease
- 7.2. Market Analysis, Insights and Forecast - by Application
- 7.2.1. Container Ships
- 7.2.2. Bulk Carriers
- 7.3. Market Analysis, Insights and Forecast - by Type
- 7.3.1. Real-Time Lease
- 7.3.2. Periodic Tenancy
- 7.3.3. Bareboat Charter
- 7.3.4. Other Types
- 7.1. Market Analysis, Insights and Forecast - by Lease Type
- 8. Europe Ship Leasing Market Analysis, Insights and Forecast, 2020-2032
- 8.1. Market Analysis, Insights and Forecast - by Lease Type
- 8.1.1. Financial Lease
- 8.1.2. Full-Service Lease
- 8.2. Market Analysis, Insights and Forecast - by Application
- 8.2.1. Container Ships
- 8.2.2. Bulk Carriers
- 8.3. Market Analysis, Insights and Forecast - by Type
- 8.3.1. Real-Time Lease
- 8.3.2. Periodic Tenancy
- 8.3.3. Bareboat Charter
- 8.3.4. Other Types
- 8.1. Market Analysis, Insights and Forecast - by Lease Type
- 9. Asia Pacific Ship Leasing Market Analysis, Insights and Forecast, 2020-2032
- 9.1. Market Analysis, Insights and Forecast - by Lease Type
- 9.1.1. Financial Lease
- 9.1.2. Full-Service Lease
- 9.2. Market Analysis, Insights and Forecast - by Application
- 9.2.1. Container Ships
- 9.2.2. Bulk Carriers
- 9.3. Market Analysis, Insights and Forecast - by Type
- 9.3.1. Real-Time Lease
- 9.3.2. Periodic Tenancy
- 9.3.3. Bareboat Charter
- 9.3.4. Other Types
- 9.1. Market Analysis, Insights and Forecast - by Lease Type
- 10. Latin America Ship Leasing Market Analysis, Insights and Forecast, 2020-2032
- 10.1. Market Analysis, Insights and Forecast - by Lease Type
- 10.1.1. Financial Lease
- 10.1.2. Full-Service Lease
- 10.2. Market Analysis, Insights and Forecast - by Application
- 10.2.1. Container Ships
- 10.2.2. Bulk Carriers
- 10.3. Market Analysis, Insights and Forecast - by Type
- 10.3.1. Real-Time Lease
- 10.3.2. Periodic Tenancy
- 10.3.3. Bareboat Charter
- 10.3.4. Other Types
- 10.1. Market Analysis, Insights and Forecast - by Lease Type
- 11. Middle East and Africa Ship Leasing Market Analysis, Insights and Forecast, 2020-2032
- 11.1. Market Analysis, Insights and Forecast - by Lease Type
- 11.1.1. Financial Lease
- 11.1.2. Full-Service Lease
- 11.2. Market Analysis, Insights and Forecast - by Application
- 11.2.1. Container Ships
- 11.2.2. Bulk Carriers
- 11.3. Market Analysis, Insights and Forecast - by Type
- 11.3.1. Real-Time Lease
- 11.3.2. Periodic Tenancy
- 11.3.3. Bareboat Charter
- 11.3.4. Other Types
- 11.1. Market Analysis, Insights and Forecast - by Lease Type
- 12. Competitive Analysis
- 12.1. Company Profiles
- 12.1.1 ICBC Co Ltd
- 12.1.1.1. Company Overview
- 12.1.1.2. Products
- 12.1.1.3. Company Financials
- 12.1.1.4. SWOT Analysis
- 12.1.2 CMB Financial Leasing CO LTD
- 12.1.2.1. Company Overview
- 12.1.2.2. Products
- 12.1.2.3. Company Financials
- 12.1.2.4. SWOT Analysis
- 12.1.3 Hamburg Commercial Bank AG
- 12.1.3.1. Company Overview
- 12.1.3.2. Products
- 12.1.3.3. Company Financials
- 12.1.3.4. SWOT Analysis
- 12.1.4 Minsheng Financial Leasing Co Ltd
- 12.1.4.1. Company Overview
- 12.1.4.2. Products
- 12.1.4.3. Company Financials
- 12.1.4.4. SWOT Analysis
- 12.1.5 First Ship Lease Trust
- 12.1.5.1. Company Overview
- 12.1.5.2. Products
- 12.1.5.3. Company Financials
- 12.1.5.4. SWOT Analysis
- 12.1.6 MUFG Bank Ltd
- 12.1.6.1. Company Overview
- 12.1.6.2. Products
- 12.1.6.3. Company Financials
- 12.1.6.4. SWOT Analysis
- 12.1.7 Bothra Group
- 12.1.7.1. Company Overview
- 12.1.7.2. Products
- 12.1.7.3. Company Financials
- 12.1.7.4. SWOT Analysis
- 12.1.8 Bank of Communications Financial Leasing Co Ltd
- 12.1.8.1. Company Overview
- 12.1.8.2. Products
- 12.1.8.3. Company Financials
- 12.1.8.4. SWOT Analysis
- 12.1.9 Galbraiths Ltd
- 12.1.9.1. Company Overview
- 12.1.9.2. Products
- 12.1.9.3. Company Financials
- 12.1.9.4. SWOT Analysis
- 12.1.10 A P Møller - Mærsk A/S
- 12.1.10.1. Company Overview
- 12.1.10.2. Products
- 12.1.10.3. Company Financials
- 12.1.10.4. SWOT Analysis
- 12.1.11 Global Ship Lease Inc
- 12.1.11.1. Company Overview
- 12.1.11.2. Products
- 12.1.11.3. Company Financials
- 12.1.11.4. SWOT Analysis
- 12.1.1 ICBC Co Ltd
- 12.2. Market Entropy
- 12.2.1 Company's Key Areas Served
- 12.2.2 Recent Developments
- 12.3. Company Market Share Analysis 2025
- 12.3.1 Top 5 Companies Market Share Analysis
- 12.3.2 Top 3 Companies Market Share Analysis
- 12.4. List of Potential Customers
- 13. Research Methodology
List of Figures
- Figure 1: Global Ship Leasing Market Revenue Breakdown (billion, %) by Region 2025 & 2033
- Figure 2: North America Ship Leasing Market Revenue (billion), by Lease Type 2025 & 2033
- Figure 3: North America Ship Leasing Market Revenue Share (%), by Lease Type 2025 & 2033
- Figure 4: North America Ship Leasing Market Revenue (billion), by Application 2025 & 2033
- Figure 5: North America Ship Leasing Market Revenue Share (%), by Application 2025 & 2033
- Figure 6: North America Ship Leasing Market Revenue (billion), by Type 2025 & 2033
- Figure 7: North America Ship Leasing Market Revenue Share (%), by Type 2025 & 2033
- Figure 8: North America Ship Leasing Market Revenue (billion), by Country 2025 & 2033
- Figure 9: North America Ship Leasing Market Revenue Share (%), by Country 2025 & 2033
- Figure 10: Europe Ship Leasing Market Revenue (billion), by Lease Type 2025 & 2033
- Figure 11: Europe Ship Leasing Market Revenue Share (%), by Lease Type 2025 & 2033
- Figure 12: Europe Ship Leasing Market Revenue (billion), by Application 2025 & 2033
- Figure 13: Europe Ship Leasing Market Revenue Share (%), by Application 2025 & 2033
- Figure 14: Europe Ship Leasing Market Revenue (billion), by Type 2025 & 2033
- Figure 15: Europe Ship Leasing Market Revenue Share (%), by Type 2025 & 2033
- Figure 16: Europe Ship Leasing Market Revenue (billion), by Country 2025 & 2033
- Figure 17: Europe Ship Leasing Market Revenue Share (%), by Country 2025 & 2033
- Figure 18: Asia Pacific Ship Leasing Market Revenue (billion), by Lease Type 2025 & 2033
- Figure 19: Asia Pacific Ship Leasing Market Revenue Share (%), by Lease Type 2025 & 2033
- Figure 20: Asia Pacific Ship Leasing Market Revenue (billion), by Application 2025 & 2033
- Figure 21: Asia Pacific Ship Leasing Market Revenue Share (%), by Application 2025 & 2033
- Figure 22: Asia Pacific Ship Leasing Market Revenue (billion), by Type 2025 & 2033
- Figure 23: Asia Pacific Ship Leasing Market Revenue Share (%), by Type 2025 & 2033
- Figure 24: Asia Pacific Ship Leasing Market Revenue (billion), by Country 2025 & 2033
- Figure 25: Asia Pacific Ship Leasing Market Revenue Share (%), by Country 2025 & 2033
- Figure 26: Latin America Ship Leasing Market Revenue (billion), by Lease Type 2025 & 2033
- Figure 27: Latin America Ship Leasing Market Revenue Share (%), by Lease Type 2025 & 2033
- Figure 28: Latin America Ship Leasing Market Revenue (billion), by Application 2025 & 2033
- Figure 29: Latin America Ship Leasing Market Revenue Share (%), by Application 2025 & 2033
- Figure 30: Latin America Ship Leasing Market Revenue (billion), by Type 2025 & 2033
- Figure 31: Latin America Ship Leasing Market Revenue Share (%), by Type 2025 & 2033
- Figure 32: Latin America Ship Leasing Market Revenue (billion), by Country 2025 & 2033
- Figure 33: Latin America Ship Leasing Market Revenue Share (%), by Country 2025 & 2033
- Figure 34: Middle East and Africa Ship Leasing Market Revenue (billion), by Lease Type 2025 & 2033
- Figure 35: Middle East and Africa Ship Leasing Market Revenue Share (%), by Lease Type 2025 & 2033
- Figure 36: Middle East and Africa Ship Leasing Market Revenue (billion), by Application 2025 & 2033
- Figure 37: Middle East and Africa Ship Leasing Market Revenue Share (%), by Application 2025 & 2033
- Figure 38: Middle East and Africa Ship Leasing Market Revenue (billion), by Type 2025 & 2033
- Figure 39: Middle East and Africa Ship Leasing Market Revenue Share (%), by Type 2025 & 2033
- Figure 40: Middle East and Africa Ship Leasing Market Revenue (billion), by Country 2025 & 2033
- Figure 41: Middle East and Africa Ship Leasing Market Revenue Share (%), by Country 2025 & 2033
List of Tables
- Table 1: Global Ship Leasing Market Revenue billion Forecast, by Lease Type 2020 & 2033
- Table 2: Global Ship Leasing Market Revenue billion Forecast, by Application 2020 & 2033
- Table 3: Global Ship Leasing Market Revenue billion Forecast, by Type 2020 & 2033
- Table 4: Global Ship Leasing Market Revenue billion Forecast, by Region 2020 & 2033
- Table 5: Global Ship Leasing Market Revenue billion Forecast, by Lease Type 2020 & 2033
- Table 6: Global Ship Leasing Market Revenue billion Forecast, by Application 2020 & 2033
- Table 7: Global Ship Leasing Market Revenue billion Forecast, by Type 2020 & 2033
- Table 8: Global Ship Leasing Market Revenue billion Forecast, by Country 2020 & 2033
- Table 9: United States Ship Leasing Market Revenue (billion) Forecast, by Application 2020 & 2033
- Table 10: Canada Ship Leasing Market Revenue (billion) Forecast, by Application 2020 & 2033
- Table 11: Global Ship Leasing Market Revenue billion Forecast, by Lease Type 2020 & 2033
- Table 12: Global Ship Leasing Market Revenue billion Forecast, by Application 2020 & 2033
- Table 13: Global Ship Leasing Market Revenue billion Forecast, by Type 2020 & 2033
- Table 14: Global Ship Leasing Market Revenue billion Forecast, by Country 2020 & 2033
- Table 15: United Kingdom Ship Leasing Market Revenue (billion) Forecast, by Application 2020 & 2033
- Table 16: France Ship Leasing Market Revenue (billion) Forecast, by Application 2020 & 2033
- Table 17: Germany Ship Leasing Market Revenue (billion) Forecast, by Application 2020 & 2033
- Table 18: Rest of Europe Ship Leasing Market Revenue (billion) Forecast, by Application 2020 & 2033
- Table 19: Global Ship Leasing Market Revenue billion Forecast, by Lease Type 2020 & 2033
- Table 20: Global Ship Leasing Market Revenue billion Forecast, by Application 2020 & 2033
- Table 21: Global Ship Leasing Market Revenue billion Forecast, by Type 2020 & 2033
- Table 22: Global Ship Leasing Market Revenue billion Forecast, by Country 2020 & 2033
- Table 23: China Ship Leasing Market Revenue (billion) Forecast, by Application 2020 & 2033
- Table 24: India Ship Leasing Market Revenue (billion) Forecast, by Application 2020 & 2033
- Table 25: Japan Ship Leasing Market Revenue (billion) Forecast, by Application 2020 & 2033
- Table 26: South Korea Ship Leasing Market Revenue (billion) Forecast, by Application 2020 & 2033
- Table 27: Rest of Asia Pacific Ship Leasing Market Revenue (billion) Forecast, by Application 2020 & 2033
- Table 28: Global Ship Leasing Market Revenue billion Forecast, by Lease Type 2020 & 2033
- Table 29: Global Ship Leasing Market Revenue billion Forecast, by Application 2020 & 2033
- Table 30: Global Ship Leasing Market Revenue billion Forecast, by Type 2020 & 2033
- Table 31: Global Ship Leasing Market Revenue billion Forecast, by Country 2020 & 2033
- Table 32: Brazil Ship Leasing Market Revenue (billion) Forecast, by Application 2020 & 2033
- Table 33: Rest of Latin America Ship Leasing Market Revenue (billion) Forecast, by Application 2020 & 2033
- Table 34: Global Ship Leasing Market Revenue billion Forecast, by Lease Type 2020 & 2033
- Table 35: Global Ship Leasing Market Revenue billion Forecast, by Application 2020 & 2033
- Table 36: Global Ship Leasing Market Revenue billion Forecast, by Type 2020 & 2033
- Table 37: Global Ship Leasing Market Revenue billion Forecast, by Country 2020 & 2033
- Table 38: United Arab Emirates Ship Leasing Market Revenue (billion) Forecast, by Application 2020 & 2033
- Table 39: Saudi Arabia Ship Leasing Market Revenue (billion) Forecast, by Application 2020 & 2033
- Table 40: South Africa Ship Leasing Market Revenue (billion) Forecast, by Application 2020 & 2033
- Table 41: Rest of Middle East and Africa Ship Leasing Market Revenue (billion) Forecast, by Application 2020 & 2033
Frequently Asked Questions
1. What is the projected Compound Annual Growth Rate (CAGR) of the Ship Leasing Market?
The projected CAGR is approximately 12%.
2. Which companies are prominent players in the Ship Leasing Market?
Key companies in the market include ICBC Co Ltd, CMB Financial Leasing CO LTD, Hamburg Commercial Bank AG, Minsheng Financial Leasing Co Ltd, First Ship Lease Trust, MUFG Bank Ltd, Bothra Group, Bank of Communications Financial Leasing Co Ltd, Galbraiths Ltd, A P Møller - Mærsk A/S, Global Ship Lease Inc.
3. What are the main segments of the Ship Leasing Market?
The market segments include Lease Type, Application, Type.
4. Can you provide details about the market size?
The market size is estimated to be USD 15.78 billion as of 2022.
5. What are some drivers contributing to market growth?
N/A
6. What are the notable trends driving market growth?
Bareboat Charter Segment is Expected to Witness Significant Growth During the Forecast Period.
7. Are there any restraints impacting market growth?
N/A
8. Can you provide examples of recent developments in the market?
N/A
9. What pricing options are available for accessing the report?
Pricing options include single-user, multi-user, and enterprise licenses priced at USD 4750, USD 5250, and USD 8750 respectively.
10. Is the market size provided in terms of value or volume?
The market size is provided in terms of value, measured in billion.
11. Are there any specific market keywords associated with the report?
Yes, the market keyword associated with the report is "Ship Leasing Market," which aids in identifying and referencing the specific market segment covered.
12. How do I determine which pricing option suits my needs best?
The pricing options vary based on user requirements and access needs. Individual users may opt for single-user licenses, while businesses requiring broader access may choose multi-user or enterprise licenses for cost-effective access to the report.
13. Are there any additional resources or data provided in the Ship Leasing Market report?
While the report offers comprehensive insights, it's advisable to review the specific contents or supplementary materials provided to ascertain if additional resources or data are available.
14. How can I stay updated on further developments or reports in the Ship Leasing Market?
To stay informed about further developments, trends, and reports in the Ship Leasing Market, consider subscribing to industry newsletters, following relevant companies and organizations, or regularly checking reputable industry news sources and publications.
Methodology
Step 1 - Identification of Relevant Samples Size from Population Database


Step 2 - Approaches for Defining Global Market Size (Value, Volume* & Price*)

Note*: In applicable scenarios
Step 3 - Data Sources
Primary Research
- Web Analytics
- Survey Reports
- Research Institute
- Latest Research Reports
- Opinion Leaders
Secondary Research
- Annual Reports
- White Paper
- Latest Press Release
- Industry Association
- Paid Database
- Investor Presentations

Step 4 - Data Triangulation
Involves using different sources of information in order to increase the validity of a study
These sources are likely to be stakeholders in a program - participants, other researchers, program staff, other community members, and so on.
Then we put all data in single framework & apply various statistical tools to find out the dynamic on the market.
During the analysis stage, feedback from the stakeholder groups would be compared to determine areas of agreement as well as areas of divergence