

Key Insights
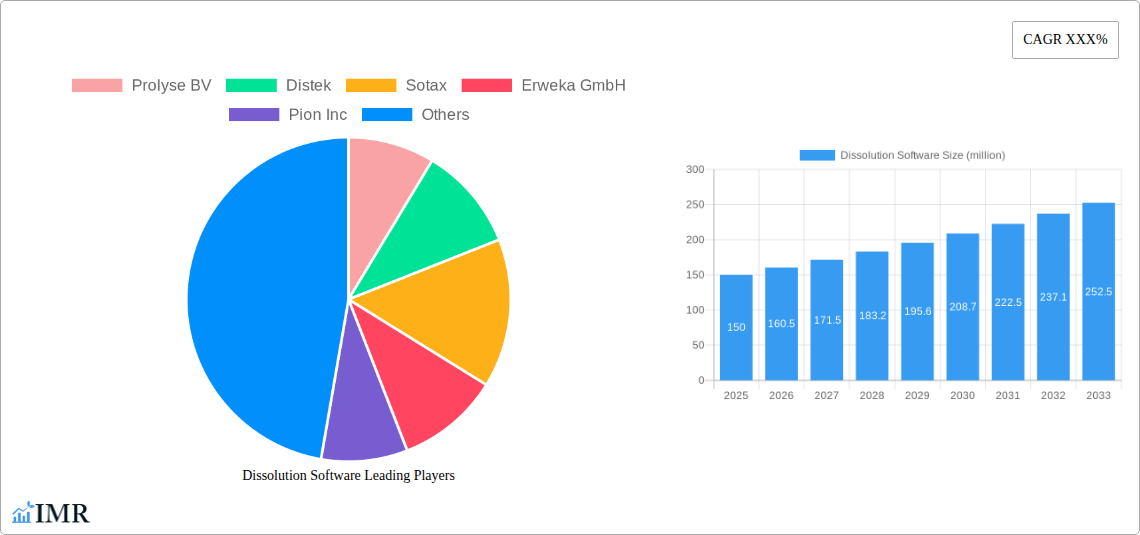
The Dissolution Testing Software market is experiencing robust growth, driven by increasing regulatory scrutiny in the pharmaceutical industry and the need for efficient, automated data analysis. The market, estimated at $150 million in 2025, is projected to exhibit a Compound Annual Growth Rate (CAGR) of 7% from 2025 to 2033, reaching approximately $250 million by 2033. This growth is fueled by several key factors. Firstly, the rising demand for improved data management and regulatory compliance is pushing pharmaceutical companies to adopt advanced dissolution testing software solutions. These solutions offer enhanced data integrity, streamlined workflows, and reduced manual errors, leading to significant cost savings and improved operational efficiency. Secondly, the increasing adoption of sophisticated analytical techniques and the integration of software with dissolution testing instruments are further contributing to market expansion. This integration facilitates seamless data transfer and analysis, eliminating manual data entry and minimizing the risk of human error. Finally, the continuous innovation in software features, such as advanced reporting capabilities, 21 CFR Part 11 compliance, and data visualization tools, is attracting a wider range of users.
Major players in this market, including Prolyse BV, Distek, Sotax, Erweka GmbH, Pion Inc, Agilent, Kohan Instruments Co., LTD., APL Software and Pharma Consulting Company, and Pharma Test, are actively engaged in developing innovative software solutions and expanding their market presence. However, the market faces certain restraints, such as the high initial investment cost of software and the need for specialized training. Despite these challenges, the long-term growth prospects for dissolution testing software remain positive, driven by the continued emphasis on quality control and regulatory compliance within the pharmaceutical industry. The increasing adoption of cloud-based solutions and the growing adoption of advanced analytical techniques are also expected to propel market growth in the coming years. Furthermore, emerging markets in Asia and Latin America are poised to offer substantial growth opportunities for vendors in the coming years.
Dissolution Software Market Report: 2019-2033
This comprehensive report provides an in-depth analysis of the global Dissolution Software market, encompassing market dynamics, growth trends, regional analysis, competitive landscape, and future outlook. The study period covers 2019-2033, with a base year of 2025 and a forecast period of 2025-2033. The report is crucial for pharmaceutical companies, software developers, regulatory bodies, and investors seeking to understand and capitalize on opportunities within this rapidly evolving market. The market is segmented by [Insert Segmentation Details Here, e.g., software type, end-user, application]. The parent market is Pharmaceutical Equipment and the child market is Dissolution Testing Software.
Dissolution Software Market Dynamics & Structure
The global Dissolution Software market is characterized by moderate concentration, with key players holding significant market shares. In 2025, the top five players – Prolyse BV, Distek, Sotax, Erweka GmbH, and Pion Inc – are estimated to collectively hold approximately xx% of the market. Technological innovation, driven by the need for improved accuracy, automation, and data analysis capabilities, is a major driver. Stringent regulatory frameworks governing pharmaceutical testing and data integrity heavily influence market dynamics. Competitive substitutes, such as manual dissolution testing methods, still exist but are progressively being replaced by automated software solutions. The end-user demographics are primarily pharmaceutical companies, contract research organizations (CROs), and academic research institutions. M&A activity in the sector has been moderate, with approximately xx deals recorded between 2019 and 2024, primarily focused on consolidating smaller players.
- Market Concentration: Moderately concentrated, top 5 players holding xx% market share in 2025.
- Technological Innovation: Focus on enhanced accuracy, automation, and data analytics.
- Regulatory Frameworks: Stringent regulations impacting data integrity and testing procedures.
- Competitive Substitutes: Manual testing methods face progressive replacement by software solutions.
- End-User Demographics: Pharmaceutical companies, CROs, and academic institutions.
- M&A Activity: Approximately xx deals between 2019 and 2024.
Dissolution Software Growth Trends & Insights
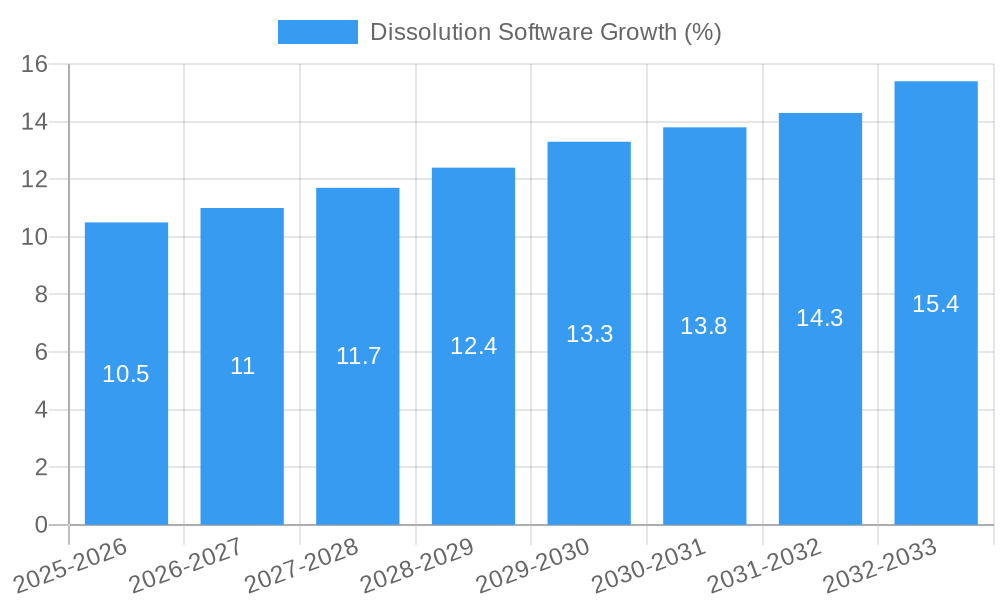
The Dissolution Software market experienced significant growth during the historical period (2019-2024), driven by increasing adoption rates within the pharmaceutical industry. The market size was valued at approximately $xx million in 2024 and is projected to reach $xx million by 2033, exhibiting a CAGR of xx% during the forecast period (2025-2033). This growth is fueled by factors such as the rising demand for efficient and reliable dissolution testing, advancements in data analytics and automation, and increasing regulatory scrutiny. Technological disruptions, such as cloud-based solutions and AI-powered data analysis, are further accelerating market expansion. Consumer behavior shifts towards greater reliance on digital solutions and automated workflows contribute to market penetration increases. The market penetration rate in 2025 is estimated to be xx%, expected to rise to xx% by 2033.
Dominant Regions, Countries, or Segments in Dissolution Software
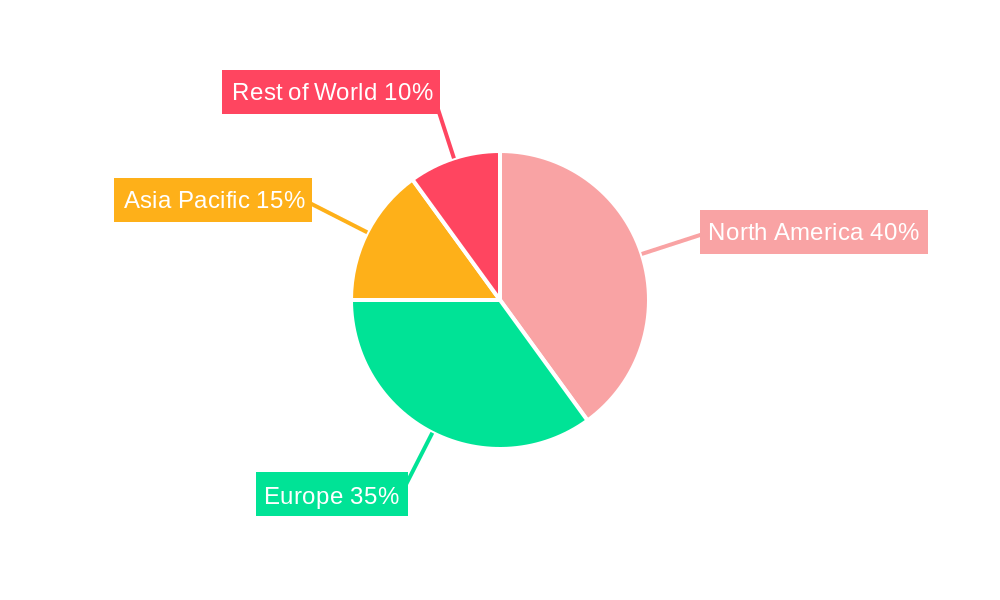
North America holds the dominant position in the Dissolution Software market, accounting for approximately xx% of the global market share in 2025. This dominance is attributable to a combination of factors including the presence of major pharmaceutical companies, robust regulatory frameworks, and significant investments in R&D. Europe follows as a major market, while the Asia-Pacific region is expected to demonstrate significant growth potential in the coming years, driven by increasing pharmaceutical manufacturing and growing adoption of advanced technologies.
- North America: Strong presence of pharmaceutical companies, robust R&D investments, and stringent regulations drive market dominance.
- Europe: Established pharmaceutical industry and regulatory landscape contribute to substantial market share.
- Asia-Pacific: High growth potential driven by increasing pharmaceutical manufacturing and technological adoption.
- Key Drivers: Strong regulatory environment, high R&D spending, and increasing adoption of automated testing.
Dissolution Software Product Landscape
The Dissolution Software market offers a range of products catering to diverse needs, from basic data acquisition and analysis to sophisticated, automated systems integrated with advanced data management tools. Key product innovations focus on enhancing data accuracy, reducing testing time, and improving regulatory compliance. Advancements include cloud-based solutions, improved user interfaces, and integration with laboratory information management systems (LIMS). Unique selling propositions often center on ease of use, data integrity, compliance features, and superior analytical capabilities.
Key Drivers, Barriers & Challenges in Dissolution Software
Key Drivers: The primary drivers include the increasing demand for efficient and compliant dissolution testing, stricter regulatory requirements for data integrity, and the rising adoption of automation in pharmaceutical manufacturing. The need for improved data analysis capabilities and enhanced laboratory workflows also significantly drives market growth.
Key Barriers & Challenges: High initial investment costs for advanced software solutions, limited technical expertise in certain regions, and the complexities associated with integrating software with existing laboratory equipment pose significant challenges. Regulatory hurdles and evolving compliance standards can also impede market growth. Competition among established players and the emergence of new entrants introduce significant competitive pressure.
Emerging Opportunities in Dissolution Software
Emerging opportunities lie in the integration of AI and machine learning for predictive modeling and improved data interpretation, the expansion of cloud-based solutions for enhanced accessibility and data sharing, and the development of specialized software for niche applications like personalized medicine and advanced drug delivery systems. Untapped markets in emerging economies offer significant growth potential.
Growth Accelerators in the Dissolution Software Industry
Strategic partnerships between software developers and pharmaceutical companies are accelerating market growth by fostering innovation and facilitating wider adoption. Technological breakthroughs in AI and cloud computing are expanding capabilities and creating new market segments. Expansion strategies targeting untapped markets, particularly in emerging economies, are crucial for sustained growth.
Key Players Shaping the Dissolution Software Market
- Prolyse BV
- Distek
- Sotax
- Erweka GmbH
- Pion Inc
- Agilent
- Kohan Instruments Co., LTD.
- APL Software and Pharma Consulting Company
- Pharma Test
Notable Milestones in Dissolution Software Sector
- 2020: Introduction of AI-powered data analysis capabilities by Prolyse BV.
- 2022: Launch of cloud-based dissolution software by Distek.
- 2023: Acquisition of a smaller software company by Agilent.
- 2024: Release of new regulatory compliance features by Sotax. (Further milestones can be added here as needed based on the available data)
In-Depth Dissolution Software Market Outlook
The future of the Dissolution Software market looks promising, driven by continuous technological advancements, increasing regulatory scrutiny, and the growing adoption of automated testing methods. Strategic partnerships, expansion into emerging markets, and innovation in areas such as AI and cloud computing will fuel market growth. The market is poised for sustained expansion, presenting significant opportunities for industry players to capitalize on through strategic investments and innovation.
Dissolution Software Segmentation
-
1. Application
- 1.1. Scientific Research Institutions
- 1.2. Pharmaceutical Industry
- 1.3. Other
-
2. Type
- 2.1. Online Stripping System
- 2.2. Offline Stripping System
- 2.3. Other
Dissolution Software Segmentation By Geography
-
1. North America
- 1.1. United States
- 1.2. Canada
- 1.3. Mexico
-
2. South America
- 2.1. Brazil
- 2.2. Argentina
- 2.3. Rest of South America
-
3. Europe
- 3.1. United Kingdom
- 3.2. Germany
- 3.3. France
- 3.4. Italy
- 3.5. Spain
- 3.6. Russia
- 3.7. Benelux
- 3.8. Nordics
- 3.9. Rest of Europe
-
4. Middle East & Africa
- 4.1. Turkey
- 4.2. Israel
- 4.3. GCC
- 4.4. North Africa
- 4.5. South Africa
- 4.6. Rest of Middle East & Africa
-
5. Asia Pacific
- 5.1. China
- 5.2. India
- 5.3. Japan
- 5.4. South Korea
- 5.5. ASEAN
- 5.6. Oceania
- 5.7. Rest of Asia Pacific
Dissolution Software REPORT HIGHLIGHTS
| Aspects | Details |
|---|---|
| Study Period | 2019-2033 |
| Base Year | 2024 |
| Estimated Year | 2025 |
| Forecast Period | 2025-2033 |
| Historical Period | 2019-2024 |
| Growth Rate | CAGR of XXX% from 2019-2033 |
| Segmentation |
|
Table of Contents
- 1. Introduction
- 1.1. Research Scope
- 1.2. Market Segmentation
- 1.3. Research Methodology
- 1.4. Definitions and Assumptions
- 2. Executive Summary
- 2.1. Introduction
- 3. Market Dynamics
- 3.1. Introduction
- 3.2. Market Drivers
- 3.3. Market Restrains
- 3.4. Market Trends
- 4. Market Factor Analysis
- 4.1. Porters Five Forces
- 4.2. Supply/Value Chain
- 4.3. PESTEL analysis
- 4.4. Market Entropy
- 4.5. Patent/Trademark Analysis
- 5. Global Dissolution Software Analysis, Insights and Forecast, 2019-2031
- 5.1. Market Analysis, Insights and Forecast - by Application
- 5.1.1. Scientific Research Institutions
- 5.1.2. Pharmaceutical Industry
- 5.1.3. Other
- 5.2. Market Analysis, Insights and Forecast - by Type
- 5.2.1. Online Stripping System
- 5.2.2. Offline Stripping System
- 5.2.3. Other
- 5.3. Market Analysis, Insights and Forecast - by Region
- 5.3.1. North America
- 5.3.2. South America
- 5.3.3. Europe
- 5.3.4. Middle East & Africa
- 5.3.5. Asia Pacific
- 5.1. Market Analysis, Insights and Forecast - by Application
- 6. North America Dissolution Software Analysis, Insights and Forecast, 2019-2031
- 6.1. Market Analysis, Insights and Forecast - by Application
- 6.1.1. Scientific Research Institutions
- 6.1.2. Pharmaceutical Industry
- 6.1.3. Other
- 6.2. Market Analysis, Insights and Forecast - by Type
- 6.2.1. Online Stripping System
- 6.2.2. Offline Stripping System
- 6.2.3. Other
- 6.1. Market Analysis, Insights and Forecast - by Application
- 7. South America Dissolution Software Analysis, Insights and Forecast, 2019-2031
- 7.1. Market Analysis, Insights and Forecast - by Application
- 7.1.1. Scientific Research Institutions
- 7.1.2. Pharmaceutical Industry
- 7.1.3. Other
- 7.2. Market Analysis, Insights and Forecast - by Type
- 7.2.1. Online Stripping System
- 7.2.2. Offline Stripping System
- 7.2.3. Other
- 7.1. Market Analysis, Insights and Forecast - by Application
- 8. Europe Dissolution Software Analysis, Insights and Forecast, 2019-2031
- 8.1. Market Analysis, Insights and Forecast - by Application
- 8.1.1. Scientific Research Institutions
- 8.1.2. Pharmaceutical Industry
- 8.1.3. Other
- 8.2. Market Analysis, Insights and Forecast - by Type
- 8.2.1. Online Stripping System
- 8.2.2. Offline Stripping System
- 8.2.3. Other
- 8.1. Market Analysis, Insights and Forecast - by Application
- 9. Middle East & Africa Dissolution Software Analysis, Insights and Forecast, 2019-2031
- 9.1. Market Analysis, Insights and Forecast - by Application
- 9.1.1. Scientific Research Institutions
- 9.1.2. Pharmaceutical Industry
- 9.1.3. Other
- 9.2. Market Analysis, Insights and Forecast - by Type
- 9.2.1. Online Stripping System
- 9.2.2. Offline Stripping System
- 9.2.3. Other
- 9.1. Market Analysis, Insights and Forecast - by Application
- 10. Asia Pacific Dissolution Software Analysis, Insights and Forecast, 2019-2031
- 10.1. Market Analysis, Insights and Forecast - by Application
- 10.1.1. Scientific Research Institutions
- 10.1.2. Pharmaceutical Industry
- 10.1.3. Other
- 10.2. Market Analysis, Insights and Forecast - by Type
- 10.2.1. Online Stripping System
- 10.2.2. Offline Stripping System
- 10.2.3. Other
- 10.1. Market Analysis, Insights and Forecast - by Application
- 11. Competitive Analysis
- 11.1. Global Market Share Analysis 2024
- 11.2. Company Profiles
- 11.2.1 Prolyse BV
- 11.2.1.1. Overview
- 11.2.1.2. Products
- 11.2.1.3. SWOT Analysis
- 11.2.1.4. Recent Developments
- 11.2.1.5. Financials (Based on Availability)
- 11.2.2 Distek
- 11.2.2.1. Overview
- 11.2.2.2. Products
- 11.2.2.3. SWOT Analysis
- 11.2.2.4. Recent Developments
- 11.2.2.5. Financials (Based on Availability)
- 11.2.3 Sotax
- 11.2.3.1. Overview
- 11.2.3.2. Products
- 11.2.3.3. SWOT Analysis
- 11.2.3.4. Recent Developments
- 11.2.3.5. Financials (Based on Availability)
- 11.2.4 Erweka GmbH
- 11.2.4.1. Overview
- 11.2.4.2. Products
- 11.2.4.3. SWOT Analysis
- 11.2.4.4. Recent Developments
- 11.2.4.5. Financials (Based on Availability)
- 11.2.5 Pion Inc
- 11.2.5.1. Overview
- 11.2.5.2. Products
- 11.2.5.3. SWOT Analysis
- 11.2.5.4. Recent Developments
- 11.2.5.5. Financials (Based on Availability)
- 11.2.6 Agilent
- 11.2.6.1. Overview
- 11.2.6.2. Products
- 11.2.6.3. SWOT Analysis
- 11.2.6.4. Recent Developments
- 11.2.6.5. Financials (Based on Availability)
- 11.2.7 Kohan Instruments Co. LTD.
- 11.2.7.1. Overview
- 11.2.7.2. Products
- 11.2.7.3. SWOT Analysis
- 11.2.7.4. Recent Developments
- 11.2.7.5. Financials (Based on Availability)
- 11.2.8 APL Software and Pharma Consulting Company
- 11.2.8.1. Overview
- 11.2.8.2. Products
- 11.2.8.3. SWOT Analysis
- 11.2.8.4. Recent Developments
- 11.2.8.5. Financials (Based on Availability)
- 11.2.9 Pharma Test
- 11.2.9.1. Overview
- 11.2.9.2. Products
- 11.2.9.3. SWOT Analysis
- 11.2.9.4. Recent Developments
- 11.2.9.5. Financials (Based on Availability)
- 11.2.1 Prolyse BV
List of Figures
- Figure 1: Global Dissolution Software Revenue Breakdown (million, %) by Region 2024 & 2032
- Figure 2: North America Dissolution Software Revenue (million), by Application 2024 & 2032
- Figure 3: North America Dissolution Software Revenue Share (%), by Application 2024 & 2032
- Figure 4: North America Dissolution Software Revenue (million), by Type 2024 & 2032
- Figure 5: North America Dissolution Software Revenue Share (%), by Type 2024 & 2032
- Figure 6: North America Dissolution Software Revenue (million), by Country 2024 & 2032
- Figure 7: North America Dissolution Software Revenue Share (%), by Country 2024 & 2032
- Figure 8: South America Dissolution Software Revenue (million), by Application 2024 & 2032
- Figure 9: South America Dissolution Software Revenue Share (%), by Application 2024 & 2032
- Figure 10: South America Dissolution Software Revenue (million), by Type 2024 & 2032
- Figure 11: South America Dissolution Software Revenue Share (%), by Type 2024 & 2032
- Figure 12: South America Dissolution Software Revenue (million), by Country 2024 & 2032
- Figure 13: South America Dissolution Software Revenue Share (%), by Country 2024 & 2032
- Figure 14: Europe Dissolution Software Revenue (million), by Application 2024 & 2032
- Figure 15: Europe Dissolution Software Revenue Share (%), by Application 2024 & 2032
- Figure 16: Europe Dissolution Software Revenue (million), by Type 2024 & 2032
- Figure 17: Europe Dissolution Software Revenue Share (%), by Type 2024 & 2032
- Figure 18: Europe Dissolution Software Revenue (million), by Country 2024 & 2032
- Figure 19: Europe Dissolution Software Revenue Share (%), by Country 2024 & 2032
- Figure 20: Middle East & Africa Dissolution Software Revenue (million), by Application 2024 & 2032
- Figure 21: Middle East & Africa Dissolution Software Revenue Share (%), by Application 2024 & 2032
- Figure 22: Middle East & Africa Dissolution Software Revenue (million), by Type 2024 & 2032
- Figure 23: Middle East & Africa Dissolution Software Revenue Share (%), by Type 2024 & 2032
- Figure 24: Middle East & Africa Dissolution Software Revenue (million), by Country 2024 & 2032
- Figure 25: Middle East & Africa Dissolution Software Revenue Share (%), by Country 2024 & 2032
- Figure 26: Asia Pacific Dissolution Software Revenue (million), by Application 2024 & 2032
- Figure 27: Asia Pacific Dissolution Software Revenue Share (%), by Application 2024 & 2032
- Figure 28: Asia Pacific Dissolution Software Revenue (million), by Type 2024 & 2032
- Figure 29: Asia Pacific Dissolution Software Revenue Share (%), by Type 2024 & 2032
- Figure 30: Asia Pacific Dissolution Software Revenue (million), by Country 2024 & 2032
- Figure 31: Asia Pacific Dissolution Software Revenue Share (%), by Country 2024 & 2032
List of Tables
- Table 1: Global Dissolution Software Revenue million Forecast, by Region 2019 & 2032
- Table 2: Global Dissolution Software Revenue million Forecast, by Application 2019 & 2032
- Table 3: Global Dissolution Software Revenue million Forecast, by Type 2019 & 2032
- Table 4: Global Dissolution Software Revenue million Forecast, by Region 2019 & 2032
- Table 5: Global Dissolution Software Revenue million Forecast, by Application 2019 & 2032
- Table 6: Global Dissolution Software Revenue million Forecast, by Type 2019 & 2032
- Table 7: Global Dissolution Software Revenue million Forecast, by Country 2019 & 2032
- Table 8: United States Dissolution Software Revenue (million) Forecast, by Application 2019 & 2032
- Table 9: Canada Dissolution Software Revenue (million) Forecast, by Application 2019 & 2032
- Table 10: Mexico Dissolution Software Revenue (million) Forecast, by Application 2019 & 2032
- Table 11: Global Dissolution Software Revenue million Forecast, by Application 2019 & 2032
- Table 12: Global Dissolution Software Revenue million Forecast, by Type 2019 & 2032
- Table 13: Global Dissolution Software Revenue million Forecast, by Country 2019 & 2032
- Table 14: Brazil Dissolution Software Revenue (million) Forecast, by Application 2019 & 2032
- Table 15: Argentina Dissolution Software Revenue (million) Forecast, by Application 2019 & 2032
- Table 16: Rest of South America Dissolution Software Revenue (million) Forecast, by Application 2019 & 2032
- Table 17: Global Dissolution Software Revenue million Forecast, by Application 2019 & 2032
- Table 18: Global Dissolution Software Revenue million Forecast, by Type 2019 & 2032
- Table 19: Global Dissolution Software Revenue million Forecast, by Country 2019 & 2032
- Table 20: United Kingdom Dissolution Software Revenue (million) Forecast, by Application 2019 & 2032
- Table 21: Germany Dissolution Software Revenue (million) Forecast, by Application 2019 & 2032
- Table 22: France Dissolution Software Revenue (million) Forecast, by Application 2019 & 2032
- Table 23: Italy Dissolution Software Revenue (million) Forecast, by Application 2019 & 2032
- Table 24: Spain Dissolution Software Revenue (million) Forecast, by Application 2019 & 2032
- Table 25: Russia Dissolution Software Revenue (million) Forecast, by Application 2019 & 2032
- Table 26: Benelux Dissolution Software Revenue (million) Forecast, by Application 2019 & 2032
- Table 27: Nordics Dissolution Software Revenue (million) Forecast, by Application 2019 & 2032
- Table 28: Rest of Europe Dissolution Software Revenue (million) Forecast, by Application 2019 & 2032
- Table 29: Global Dissolution Software Revenue million Forecast, by Application 2019 & 2032
- Table 30: Global Dissolution Software Revenue million Forecast, by Type 2019 & 2032
- Table 31: Global Dissolution Software Revenue million Forecast, by Country 2019 & 2032
- Table 32: Turkey Dissolution Software Revenue (million) Forecast, by Application 2019 & 2032
- Table 33: Israel Dissolution Software Revenue (million) Forecast, by Application 2019 & 2032
- Table 34: GCC Dissolution Software Revenue (million) Forecast, by Application 2019 & 2032
- Table 35: North Africa Dissolution Software Revenue (million) Forecast, by Application 2019 & 2032
- Table 36: South Africa Dissolution Software Revenue (million) Forecast, by Application 2019 & 2032
- Table 37: Rest of Middle East & Africa Dissolution Software Revenue (million) Forecast, by Application 2019 & 2032
- Table 38: Global Dissolution Software Revenue million Forecast, by Application 2019 & 2032
- Table 39: Global Dissolution Software Revenue million Forecast, by Type 2019 & 2032
- Table 40: Global Dissolution Software Revenue million Forecast, by Country 2019 & 2032
- Table 41: China Dissolution Software Revenue (million) Forecast, by Application 2019 & 2032
- Table 42: India Dissolution Software Revenue (million) Forecast, by Application 2019 & 2032
- Table 43: Japan Dissolution Software Revenue (million) Forecast, by Application 2019 & 2032
- Table 44: South Korea Dissolution Software Revenue (million) Forecast, by Application 2019 & 2032
- Table 45: ASEAN Dissolution Software Revenue (million) Forecast, by Application 2019 & 2032
- Table 46: Oceania Dissolution Software Revenue (million) Forecast, by Application 2019 & 2032
- Table 47: Rest of Asia Pacific Dissolution Software Revenue (million) Forecast, by Application 2019 & 2032
Frequently Asked Questions
1. What is the projected Compound Annual Growth Rate (CAGR) of the Dissolution Software?
The projected CAGR is approximately XXX%.
2. Which companies are prominent players in the Dissolution Software?
Key companies in the market include Prolyse BV, Distek, Sotax, Erweka GmbH, Pion Inc, Agilent, Kohan Instruments Co., LTD., APL Software and Pharma Consulting Company, Pharma Test.
3. What are the main segments of the Dissolution Software?
The market segments include Application, Type.
4. Can you provide details about the market size?
The market size is estimated to be USD XXX million as of 2022.
5. What are some drivers contributing to market growth?
N/A
6. What are the notable trends driving market growth?
N/A
7. Are there any restraints impacting market growth?
N/A
8. Can you provide examples of recent developments in the market?
N/A
9. What pricing options are available for accessing the report?
Pricing options include single-user, multi-user, and enterprise licenses priced at USD 4250.00, USD 6375.00, and USD 8500.00 respectively.
10. Is the market size provided in terms of value or volume?
The market size is provided in terms of value, measured in million.
11. Are there any specific market keywords associated with the report?
Yes, the market keyword associated with the report is "Dissolution Software," which aids in identifying and referencing the specific market segment covered.
12. How do I determine which pricing option suits my needs best?
The pricing options vary based on user requirements and access needs. Individual users may opt for single-user licenses, while businesses requiring broader access may choose multi-user or enterprise licenses for cost-effective access to the report.
13. Are there any additional resources or data provided in the Dissolution Software report?
While the report offers comprehensive insights, it's advisable to review the specific contents or supplementary materials provided to ascertain if additional resources or data are available.
14. How can I stay updated on further developments or reports in the Dissolution Software?
To stay informed about further developments, trends, and reports in the Dissolution Software, consider subscribing to industry newsletters, following relevant companies and organizations, or regularly checking reputable industry news sources and publications.
Methodology
Step 1 - Identification of Relevant Samples Size from Population Database


Step 2 - Approaches for Defining Global Market Size (Value, Volume* & Price*)

Note*: In applicable scenarios
Step 3 - Data Sources
Primary Research
- Web Analytics
- Survey Reports
- Research Institute
- Latest Research Reports
- Opinion Leaders
Secondary Research
- Annual Reports
- White Paper
- Latest Press Release
- Industry Association
- Paid Database
- Investor Presentations

Step 4 - Data Triangulation
Involves using different sources of information in order to increase the validity of a study
These sources are likely to be stakeholders in a program - participants, other researchers, program staff, other community members, and so on.
Then we put all data in single framework & apply various statistical tools to find out the dynamic on the market.
During the analysis stage, feedback from the stakeholder groups would be compared to determine areas of agreement as well as areas of divergence
