

Key Insights
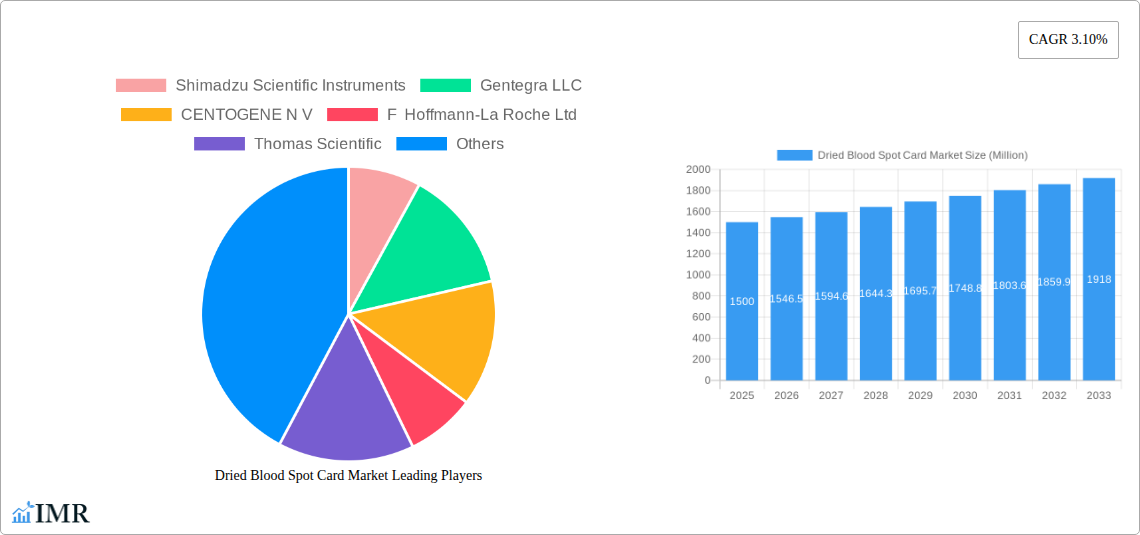
The Dried Blood Spot (DBS) card market is experiencing steady growth, driven by the increasing adoption of DBS technology in various applications, including infectious disease testing, newborn screening, and forensic analysis. The market's expansion is fueled by several factors: the non-invasive nature of DBS sampling, its cost-effectiveness compared to traditional venous blood collection, and its suitability for remote sample collection and transportation. This makes DBS cards particularly valuable in resource-limited settings and for large-scale screening programs. The market is segmented by card type (Ahlstrom, Whatman, FTA, and others) and application, with infectious disease testing and newborn screening currently dominating. Technological advancements, such as improved card materials and automated processing techniques, are further propelling market growth. While the market is fragmented, with several key players like Shimadzu Scientific Instruments, QIAGEN, and PerkinElmer competing, the increasing demand for reliable and efficient diagnostics is creating opportunities for market expansion. The forecast period of 2025-2033 anticipates continued growth, driven by the aforementioned factors and further penetration into emerging markets.
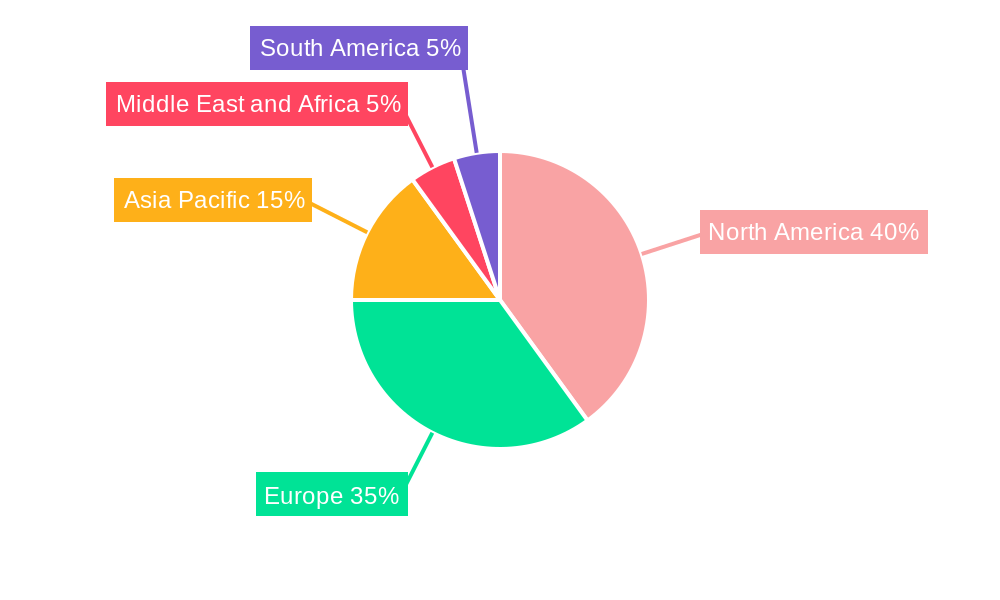
The geographic distribution of the DBS card market reflects varying levels of healthcare infrastructure and adoption rates. North America and Europe are currently leading the market due to higher awareness and established healthcare systems. However, Asia Pacific is poised for significant growth in the coming years, driven by increasing healthcare spending and rising prevalence of infectious diseases. The competitive landscape features both established players with extensive experience in diagnostics and emerging companies offering innovative solutions. Strategic partnerships and collaborations between manufacturers and healthcare providers are anticipated to further shape the market trajectory, leading to wider adoption and improved accessibility of DBS testing. Furthermore, regulatory approvals and standardization efforts will play a crucial role in ensuring the quality and reliability of DBS cards, contributing to market stability and growth.
Dried Blood Spot Card Market: A Comprehensive Report (2019-2033)
This comprehensive report provides an in-depth analysis of the Dried Blood Spot (DBS) Card market, encompassing market dynamics, growth trends, regional analysis, product landscape, and key player strategies. With a focus on the parent market of diagnostic testing and the child market of DBS cards, this report offers valuable insights for industry professionals, investors, and researchers seeking to understand and capitalize on the opportunities within this rapidly evolving sector. The study period covers 2019-2033, with a base year of 2025 and a forecast period of 2025-2033. The market size is presented in million units.
Dried Blood Spot Card Market Market Dynamics & Structure
The Dried Blood Spot (DBS) card market is characterized by moderate concentration, with several key players holding significant market share. Technological innovations, particularly in molecular diagnostics and automation, are major growth drivers. Stringent regulatory frameworks governing diagnostic testing influence market dynamics, while the availability of alternative sample collection methods presents competitive pressure. The end-user demographic spans various healthcare settings, including hospitals, laboratories, and research institutions. M&A activity within the diagnostics sector remains relatively active, albeit at a moderate pace in the DBS card market specifically. Recent years have seen approximately xx M&A deals annually, with xx% focused on enhancing product portfolios and geographic reach.
- Market Concentration: Moderately concentrated, with top 5 players holding approximately xx% market share in 2024.
- Technological Innovation: Advancements in molecular diagnostics and automation are driving efficiency and expanding applications.
- Regulatory Landscape: Stringent regulatory approvals (e.g., FDA, CE marking) create barriers to entry but ensure product safety and efficacy.
- Competitive Substitutes: Alternative sample collection methods (e.g., venous blood draws) pose competitive pressure, but DBS cards offer advantages in convenience and cost-effectiveness.
- End-User Demographics: Hospitals, clinical laboratories, research institutions, and forensic laboratories represent key end-user segments.
- M&A Trends: Annual M&A deal volume estimated at xx, with a focus on expanding product lines and geographical presence.
Dried Blood Spot Card Market Growth Trends & Insights
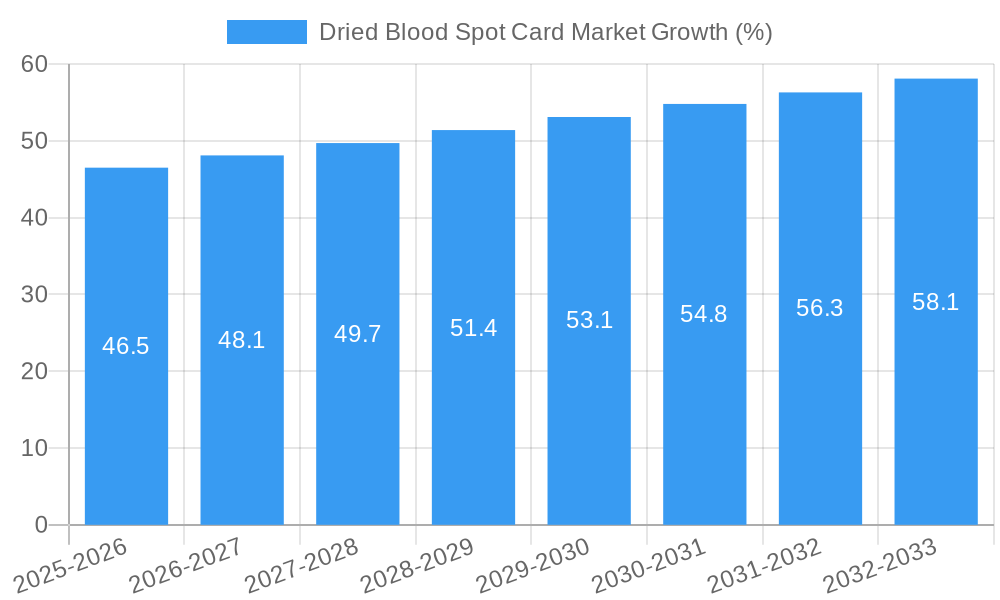
The DBS card market exhibits a robust growth trajectory, driven by increasing adoption in various applications. The market size was valued at xx million units in 2024 and is projected to reach xx million units by 2033, exhibiting a CAGR of xx%. This growth is fueled by several factors: the rising prevalence of infectious diseases, expanding newborn screening programs globally, the increasing demand for point-of-care diagnostics, and advancements in molecular diagnostic techniques enabling more accurate and efficient analysis from smaller sample volumes. Consumer preference is shifting towards less invasive and more convenient sample collection methods, bolstering DBS card adoption. Technological disruptions, such as the integration of microfluidics and lab-on-a-chip technologies, further enhance the efficiency and versatility of DBS cards, increasing their market penetration across various diagnostic applications.
Dominant Regions, Countries, or Segments in Dried Blood Spot Card Market
North America currently holds the largest market share in the DBS card market, driven by high healthcare expenditure, advanced healthcare infrastructure, and a strong focus on research and development. Europe follows closely, showing significant growth potential due to increasing adoption of advanced diagnostic techniques. The Asia-Pacific region presents a substantial emerging market, fueled by rising healthcare expenditure and expanding healthcare infrastructure, particularly in countries like India and China. Within segments, the Infectious Disease Testing application dominates, followed by Newborn Screening. Ahlstrom and Whatman cards hold the largest shares in the card type segment.
- Key Regional Drivers:
- North America: High healthcare spending, advanced infrastructure, strong R&D investments.
- Europe: Growing adoption of advanced diagnostic techniques, robust healthcare systems.
- Asia-Pacific: Rising healthcare expenditure, expanding infrastructure, increasing prevalence of infectious diseases.
- Dominant Application Segment: Infectious Disease Testing, driven by the increasing prevalence of infectious diseases and the need for rapid, efficient diagnostics.
- Dominant Card Type Segment: Ahlstrom and Whatman cards hold significant market shares due to their established reputation and widespread availability.
Dried Blood Spot Card Market Product Landscape
The DBS card market offers a variety of products, differing in material composition (e.g., cellulose, glass fiber), size, and intended application. Innovations focus on improving sample stability, reducing the risk of contamination, and enhancing the ease of use. Recent advancements include incorporating novel matrix materials for improved analyte recovery and integrating functionalities for automated sample processing. These innovations enhance overall performance metrics, such as analyte stability and ease of handling, while improving the quality of downstream assays. Unique selling propositions include enhanced sample stability, reduced assay variability and improved ease of use.
Key Drivers, Barriers & Challenges in Dried Blood Spot Card Market
Key Drivers:
- Rising prevalence of infectious diseases and chronic conditions.
- Increasing demand for point-of-care diagnostics.
- Growing adoption of advanced molecular diagnostic techniques.
- Government initiatives promoting newborn screening and disease surveillance.
Key Challenges:
- Stringent regulatory requirements for diagnostic products.
- Supply chain disruptions impacting material availability and production costs.
- Competition from alternative sample collection methods.
- Potential for inconsistent sample quality and handling errors. This can lead to a xx% rate of sample rejection in some applications.
Emerging Opportunities in Dried Blood Spot Card Market
Emerging opportunities include expanding into untapped markets in developing countries, developing DBS cards for novel applications (e.g., pharmacogenomics, environmental monitoring), and integrating digital technologies for remote sample collection and data management. The development of novel materials and enhanced functionalities for improved sample stability and assay performance offers significant market expansion opportunities.
Growth Accelerators in the Dried Blood Spot Card Market Industry
Technological advancements, particularly in areas such as microfluidics and lab-on-a-chip technologies, are playing a key role in accelerating market growth. Strategic partnerships between DBS card manufacturers and diagnostic assay developers are streamlining workflows and creating comprehensive solutions. Expanding into new applications, such as environmental monitoring and veterinary diagnostics, presents substantial opportunities for future growth.
Key Players Shaping the Dried Blood Spot Card Market Market
- Shimadzu Scientific Instruments
- Gentegra LLC
- CENTOGENE N V
- F Hoffmann-La Roche Ltd
- Thomas Scientific
- Hemaxis
- Lipomic Healthcare
- Eastern Business Forms Inc
- ARCHIMEDlife
- QIAGEN
- PerkinElmer
- Ahlstrom-Munksjö
Notable Milestones in Dried Blood Spot Card Market Sector
- August 2022: Boston Heart Diagnostics Corporation launched a broad range of tests utilizing DBS collection for various health assessments (cardiovascular, diabetes, wellness).
- June 2022: A study demonstrated the efficacy and cost-effectiveness of Whatman FTA cards in molecular diagnostics for Yellow Fever Virus detection.
In-Depth Dried Blood Spot Card Market Market Outlook
The Dried Blood Spot card market is poised for sustained growth, driven by continuous technological advancements, expanding applications, and increasing demand for convenient and cost-effective diagnostic solutions. Strategic partnerships and market expansion into developing countries will be key factors driving future market potential. The market offers significant opportunities for companies to develop innovative products and expand their market share.
Dried Blood Spot Card Market Segmentation
-
1. Card Type
- 1.1. Ahlstrom 226
- 1.2. Whatman 903
- 1.3. FTA
- 1.4. Others
-
2. Application
- 2.1. Infectious Disease Testing
- 2.2. Newborn Screening
- 2.3. Forensics
- 2.4. Therapeutic Drug Monitoring
- 2.5. Others
Dried Blood Spot Card Market Segmentation By Geography
-
1. North America
- 1.1. United States
- 1.2. Canada
- 1.3. Mexico
-
2. Europe
- 2.1. Germany
- 2.2. United Kingdom
- 2.3. France
- 2.4. Italy
- 2.5. Spain
- 2.6. Rest of Europe
-
3. Asia Pacific
- 3.1. China
- 3.2. Japan
- 3.3. India
- 3.4. Australia
- 3.5. South Korea
- 3.6. Rest of Asia Pacific
-
4. Middle East and Africa
- 4.1. GCC
- 4.2. South Africa
- 4.3. Rest of Middle East and Africa
-
5. South America
- 5.1. Brazil
- 5.2. Argentina
- 5.3. Rest of South America
Dried Blood Spot Card Market REPORT HIGHLIGHTS
| Aspects | Details |
|---|---|
| Study Period | 2019-2033 |
| Base Year | 2024 |
| Estimated Year | 2025 |
| Forecast Period | 2025-2033 |
| Historical Period | 2019-2024 |
| Growth Rate | CAGR of 3.10% from 2019-2033 |
| Segmentation |
|
Table of Contents
- 1. Introduction
- 1.1. Research Scope
- 1.2. Market Segmentation
- 1.3. Research Methodology
- 1.4. Definitions and Assumptions
- 2. Executive Summary
- 2.1. Introduction
- 3. Market Dynamics
- 3.1. Introduction
- 3.2. Market Drivers
- 3.2.1. Increasing Use of DBS Cards in Diagnostic Testing; Rise of Forensic Toxicology Applications
- 3.3. Market Restrains
- 3.3.1. Contamination Caused in DBS Collection Cards
- 3.4. Market Trends
- 3.4.1. Newborn Screening Segment is Expected to Witness Considerable Growth Over the Forecast Period
- 4. Market Factor Analysis
- 4.1. Porters Five Forces
- 4.2. Supply/Value Chain
- 4.3. PESTEL analysis
- 4.4. Market Entropy
- 4.5. Patent/Trademark Analysis
- 5. Global Dried Blood Spot Card Market Analysis, Insights and Forecast, 2019-2031
- 5.1. Market Analysis, Insights and Forecast - by Card Type
- 5.1.1. Ahlstrom 226
- 5.1.2. Whatman 903
- 5.1.3. FTA
- 5.1.4. Others
- 5.2. Market Analysis, Insights and Forecast - by Application
- 5.2.1. Infectious Disease Testing
- 5.2.2. Newborn Screening
- 5.2.3. Forensics
- 5.2.4. Therapeutic Drug Monitoring
- 5.2.5. Others
- 5.3. Market Analysis, Insights and Forecast - by Region
- 5.3.1. North America
- 5.3.2. Europe
- 5.3.3. Asia Pacific
- 5.3.4. Middle East and Africa
- 5.3.5. South America
- 5.1. Market Analysis, Insights and Forecast - by Card Type
- 6. North America Dried Blood Spot Card Market Analysis, Insights and Forecast, 2019-2031
- 6.1. Market Analysis, Insights and Forecast - by Card Type
- 6.1.1. Ahlstrom 226
- 6.1.2. Whatman 903
- 6.1.3. FTA
- 6.1.4. Others
- 6.2. Market Analysis, Insights and Forecast - by Application
- 6.2.1. Infectious Disease Testing
- 6.2.2. Newborn Screening
- 6.2.3. Forensics
- 6.2.4. Therapeutic Drug Monitoring
- 6.2.5. Others
- 6.1. Market Analysis, Insights and Forecast - by Card Type
- 7. Europe Dried Blood Spot Card Market Analysis, Insights and Forecast, 2019-2031
- 7.1. Market Analysis, Insights and Forecast - by Card Type
- 7.1.1. Ahlstrom 226
- 7.1.2. Whatman 903
- 7.1.3. FTA
- 7.1.4. Others
- 7.2. Market Analysis, Insights and Forecast - by Application
- 7.2.1. Infectious Disease Testing
- 7.2.2. Newborn Screening
- 7.2.3. Forensics
- 7.2.4. Therapeutic Drug Monitoring
- 7.2.5. Others
- 7.1. Market Analysis, Insights and Forecast - by Card Type
- 8. Asia Pacific Dried Blood Spot Card Market Analysis, Insights and Forecast, 2019-2031
- 8.1. Market Analysis, Insights and Forecast - by Card Type
- 8.1.1. Ahlstrom 226
- 8.1.2. Whatman 903
- 8.1.3. FTA
- 8.1.4. Others
- 8.2. Market Analysis, Insights and Forecast - by Application
- 8.2.1. Infectious Disease Testing
- 8.2.2. Newborn Screening
- 8.2.3. Forensics
- 8.2.4. Therapeutic Drug Monitoring
- 8.2.5. Others
- 8.1. Market Analysis, Insights and Forecast - by Card Type
- 9. Middle East and Africa Dried Blood Spot Card Market Analysis, Insights and Forecast, 2019-2031
- 9.1. Market Analysis, Insights and Forecast - by Card Type
- 9.1.1. Ahlstrom 226
- 9.1.2. Whatman 903
- 9.1.3. FTA
- 9.1.4. Others
- 9.2. Market Analysis, Insights and Forecast - by Application
- 9.2.1. Infectious Disease Testing
- 9.2.2. Newborn Screening
- 9.2.3. Forensics
- 9.2.4. Therapeutic Drug Monitoring
- 9.2.5. Others
- 9.1. Market Analysis, Insights and Forecast - by Card Type
- 10. South America Dried Blood Spot Card Market Analysis, Insights and Forecast, 2019-2031
- 10.1. Market Analysis, Insights and Forecast - by Card Type
- 10.1.1. Ahlstrom 226
- 10.1.2. Whatman 903
- 10.1.3. FTA
- 10.1.4. Others
- 10.2. Market Analysis, Insights and Forecast - by Application
- 10.2.1. Infectious Disease Testing
- 10.2.2. Newborn Screening
- 10.2.3. Forensics
- 10.2.4. Therapeutic Drug Monitoring
- 10.2.5. Others
- 10.1. Market Analysis, Insights and Forecast - by Card Type
- 11. North America Dried Blood Spot Card Market Analysis, Insights and Forecast, 2019-2031
- 11.1. Market Analysis, Insights and Forecast - By Country/Sub-region
- 11.1.1 United States
- 11.1.2 Canada
- 11.1.3 Mexico
- 12. Europe Dried Blood Spot Card Market Analysis, Insights and Forecast, 2019-2031
- 12.1. Market Analysis, Insights and Forecast - By Country/Sub-region
- 12.1.1 Germany
- 12.1.2 United Kingdom
- 12.1.3 France
- 12.1.4 Italy
- 12.1.5 Spain
- 12.1.6 Rest of Europe
- 13. Asia Pacific Dried Blood Spot Card Market Analysis, Insights and Forecast, 2019-2031
- 13.1. Market Analysis, Insights and Forecast - By Country/Sub-region
- 13.1.1 China
- 13.1.2 Japan
- 13.1.3 India
- 13.1.4 Australia
- 13.1.5 South Korea
- 13.1.6 Rest of Asia Pacific
- 14. Middle East and Africa Dried Blood Spot Card Market Analysis, Insights and Forecast, 2019-2031
- 14.1. Market Analysis, Insights and Forecast - By Country/Sub-region
- 14.1.1 GCC
- 14.1.2 South Africa
- 14.1.3 Rest of Middle East and Africa
- 15. South America Dried Blood Spot Card Market Analysis, Insights and Forecast, 2019-2031
- 15.1. Market Analysis, Insights and Forecast - By Country/Sub-region
- 15.1.1 Brazil
- 15.1.2 Argentina
- 15.1.3 Rest of South America
- 16. Competitive Analysis
- 16.1. Global Market Share Analysis 2024
- 16.2. Company Profiles
- 16.2.1 Shimadzu Scientific Instruments
- 16.2.1.1. Overview
- 16.2.1.2. Products
- 16.2.1.3. SWOT Analysis
- 16.2.1.4. Recent Developments
- 16.2.1.5. Financials (Based on Availability)
- 16.2.2 Gentegra LLC
- 16.2.2.1. Overview
- 16.2.2.2. Products
- 16.2.2.3. SWOT Analysis
- 16.2.2.4. Recent Developments
- 16.2.2.5. Financials (Based on Availability)
- 16.2.3 CENTOGENE N V
- 16.2.3.1. Overview
- 16.2.3.2. Products
- 16.2.3.3. SWOT Analysis
- 16.2.3.4. Recent Developments
- 16.2.3.5. Financials (Based on Availability)
- 16.2.4 F Hoffmann-La Roche Ltd
- 16.2.4.1. Overview
- 16.2.4.2. Products
- 16.2.4.3. SWOT Analysis
- 16.2.4.4. Recent Developments
- 16.2.4.5. Financials (Based on Availability)
- 16.2.5 Thomas Scientific
- 16.2.5.1. Overview
- 16.2.5.2. Products
- 16.2.5.3. SWOT Analysis
- 16.2.5.4. Recent Developments
- 16.2.5.5. Financials (Based on Availability)
- 16.2.6 Hemaxis
- 16.2.6.1. Overview
- 16.2.6.2. Products
- 16.2.6.3. SWOT Analysis
- 16.2.6.4. Recent Developments
- 16.2.6.5. Financials (Based on Availability)
- 16.2.7 Lipomic Healthcare
- 16.2.7.1. Overview
- 16.2.7.2. Products
- 16.2.7.3. SWOT Analysis
- 16.2.7.4. Recent Developments
- 16.2.7.5. Financials (Based on Availability)
- 16.2.8 Eastern Business Forms Inc
- 16.2.8.1. Overview
- 16.2.8.2. Products
- 16.2.8.3. SWOT Analysis
- 16.2.8.4. Recent Developments
- 16.2.8.5. Financials (Based on Availability)
- 16.2.9 ARCHIMEDlife
- 16.2.9.1. Overview
- 16.2.9.2. Products
- 16.2.9.3. SWOT Analysis
- 16.2.9.4. Recent Developments
- 16.2.9.5. Financials (Based on Availability)
- 16.2.10 QIAGEN
- 16.2.10.1. Overview
- 16.2.10.2. Products
- 16.2.10.3. SWOT Analysis
- 16.2.10.4. Recent Developments
- 16.2.10.5. Financials (Based on Availability)
- 16.2.11 PerkinElmer
- 16.2.11.1. Overview
- 16.2.11.2. Products
- 16.2.11.3. SWOT Analysis
- 16.2.11.4. Recent Developments
- 16.2.11.5. Financials (Based on Availability)
- 16.2.12 Ahlstrom-Munksjö
- 16.2.12.1. Overview
- 16.2.12.2. Products
- 16.2.12.3. SWOT Analysis
- 16.2.12.4. Recent Developments
- 16.2.12.5. Financials (Based on Availability)
- 16.2.1 Shimadzu Scientific Instruments
List of Figures
- Figure 1: Global Dried Blood Spot Card Market Revenue Breakdown (Million, %) by Region 2024 & 2032
- Figure 2: Global Dried Blood Spot Card Market Volume Breakdown (K Unit, %) by Region 2024 & 2032
- Figure 3: North America Dried Blood Spot Card Market Revenue (Million), by Country 2024 & 2032
- Figure 4: North America Dried Blood Spot Card Market Volume (K Unit), by Country 2024 & 2032
- Figure 5: North America Dried Blood Spot Card Market Revenue Share (%), by Country 2024 & 2032
- Figure 6: North America Dried Blood Spot Card Market Volume Share (%), by Country 2024 & 2032
- Figure 7: Europe Dried Blood Spot Card Market Revenue (Million), by Country 2024 & 2032
- Figure 8: Europe Dried Blood Spot Card Market Volume (K Unit), by Country 2024 & 2032
- Figure 9: Europe Dried Blood Spot Card Market Revenue Share (%), by Country 2024 & 2032
- Figure 10: Europe Dried Blood Spot Card Market Volume Share (%), by Country 2024 & 2032
- Figure 11: Asia Pacific Dried Blood Spot Card Market Revenue (Million), by Country 2024 & 2032
- Figure 12: Asia Pacific Dried Blood Spot Card Market Volume (K Unit), by Country 2024 & 2032
- Figure 13: Asia Pacific Dried Blood Spot Card Market Revenue Share (%), by Country 2024 & 2032
- Figure 14: Asia Pacific Dried Blood Spot Card Market Volume Share (%), by Country 2024 & 2032
- Figure 15: Middle East and Africa Dried Blood Spot Card Market Revenue (Million), by Country 2024 & 2032
- Figure 16: Middle East and Africa Dried Blood Spot Card Market Volume (K Unit), by Country 2024 & 2032
- Figure 17: Middle East and Africa Dried Blood Spot Card Market Revenue Share (%), by Country 2024 & 2032
- Figure 18: Middle East and Africa Dried Blood Spot Card Market Volume Share (%), by Country 2024 & 2032
- Figure 19: South America Dried Blood Spot Card Market Revenue (Million), by Country 2024 & 2032
- Figure 20: South America Dried Blood Spot Card Market Volume (K Unit), by Country 2024 & 2032
- Figure 21: South America Dried Blood Spot Card Market Revenue Share (%), by Country 2024 & 2032
- Figure 22: South America Dried Blood Spot Card Market Volume Share (%), by Country 2024 & 2032
- Figure 23: North America Dried Blood Spot Card Market Revenue (Million), by Card Type 2024 & 2032
- Figure 24: North America Dried Blood Spot Card Market Volume (K Unit), by Card Type 2024 & 2032
- Figure 25: North America Dried Blood Spot Card Market Revenue Share (%), by Card Type 2024 & 2032
- Figure 26: North America Dried Blood Spot Card Market Volume Share (%), by Card Type 2024 & 2032
- Figure 27: North America Dried Blood Spot Card Market Revenue (Million), by Application 2024 & 2032
- Figure 28: North America Dried Blood Spot Card Market Volume (K Unit), by Application 2024 & 2032
- Figure 29: North America Dried Blood Spot Card Market Revenue Share (%), by Application 2024 & 2032
- Figure 30: North America Dried Blood Spot Card Market Volume Share (%), by Application 2024 & 2032
- Figure 31: North America Dried Blood Spot Card Market Revenue (Million), by Country 2024 & 2032
- Figure 32: North America Dried Blood Spot Card Market Volume (K Unit), by Country 2024 & 2032
- Figure 33: North America Dried Blood Spot Card Market Revenue Share (%), by Country 2024 & 2032
- Figure 34: North America Dried Blood Spot Card Market Volume Share (%), by Country 2024 & 2032
- Figure 35: Europe Dried Blood Spot Card Market Revenue (Million), by Card Type 2024 & 2032
- Figure 36: Europe Dried Blood Spot Card Market Volume (K Unit), by Card Type 2024 & 2032
- Figure 37: Europe Dried Blood Spot Card Market Revenue Share (%), by Card Type 2024 & 2032
- Figure 38: Europe Dried Blood Spot Card Market Volume Share (%), by Card Type 2024 & 2032
- Figure 39: Europe Dried Blood Spot Card Market Revenue (Million), by Application 2024 & 2032
- Figure 40: Europe Dried Blood Spot Card Market Volume (K Unit), by Application 2024 & 2032
- Figure 41: Europe Dried Blood Spot Card Market Revenue Share (%), by Application 2024 & 2032
- Figure 42: Europe Dried Blood Spot Card Market Volume Share (%), by Application 2024 & 2032
- Figure 43: Europe Dried Blood Spot Card Market Revenue (Million), by Country 2024 & 2032
- Figure 44: Europe Dried Blood Spot Card Market Volume (K Unit), by Country 2024 & 2032
- Figure 45: Europe Dried Blood Spot Card Market Revenue Share (%), by Country 2024 & 2032
- Figure 46: Europe Dried Blood Spot Card Market Volume Share (%), by Country 2024 & 2032
- Figure 47: Asia Pacific Dried Blood Spot Card Market Revenue (Million), by Card Type 2024 & 2032
- Figure 48: Asia Pacific Dried Blood Spot Card Market Volume (K Unit), by Card Type 2024 & 2032
- Figure 49: Asia Pacific Dried Blood Spot Card Market Revenue Share (%), by Card Type 2024 & 2032
- Figure 50: Asia Pacific Dried Blood Spot Card Market Volume Share (%), by Card Type 2024 & 2032
- Figure 51: Asia Pacific Dried Blood Spot Card Market Revenue (Million), by Application 2024 & 2032
- Figure 52: Asia Pacific Dried Blood Spot Card Market Volume (K Unit), by Application 2024 & 2032
- Figure 53: Asia Pacific Dried Blood Spot Card Market Revenue Share (%), by Application 2024 & 2032
- Figure 54: Asia Pacific Dried Blood Spot Card Market Volume Share (%), by Application 2024 & 2032
- Figure 55: Asia Pacific Dried Blood Spot Card Market Revenue (Million), by Country 2024 & 2032
- Figure 56: Asia Pacific Dried Blood Spot Card Market Volume (K Unit), by Country 2024 & 2032
- Figure 57: Asia Pacific Dried Blood Spot Card Market Revenue Share (%), by Country 2024 & 2032
- Figure 58: Asia Pacific Dried Blood Spot Card Market Volume Share (%), by Country 2024 & 2032
- Figure 59: Middle East and Africa Dried Blood Spot Card Market Revenue (Million), by Card Type 2024 & 2032
- Figure 60: Middle East and Africa Dried Blood Spot Card Market Volume (K Unit), by Card Type 2024 & 2032
- Figure 61: Middle East and Africa Dried Blood Spot Card Market Revenue Share (%), by Card Type 2024 & 2032
- Figure 62: Middle East and Africa Dried Blood Spot Card Market Volume Share (%), by Card Type 2024 & 2032
- Figure 63: Middle East and Africa Dried Blood Spot Card Market Revenue (Million), by Application 2024 & 2032
- Figure 64: Middle East and Africa Dried Blood Spot Card Market Volume (K Unit), by Application 2024 & 2032
- Figure 65: Middle East and Africa Dried Blood Spot Card Market Revenue Share (%), by Application 2024 & 2032
- Figure 66: Middle East and Africa Dried Blood Spot Card Market Volume Share (%), by Application 2024 & 2032
- Figure 67: Middle East and Africa Dried Blood Spot Card Market Revenue (Million), by Country 2024 & 2032
- Figure 68: Middle East and Africa Dried Blood Spot Card Market Volume (K Unit), by Country 2024 & 2032
- Figure 69: Middle East and Africa Dried Blood Spot Card Market Revenue Share (%), by Country 2024 & 2032
- Figure 70: Middle East and Africa Dried Blood Spot Card Market Volume Share (%), by Country 2024 & 2032
- Figure 71: South America Dried Blood Spot Card Market Revenue (Million), by Card Type 2024 & 2032
- Figure 72: South America Dried Blood Spot Card Market Volume (K Unit), by Card Type 2024 & 2032
- Figure 73: South America Dried Blood Spot Card Market Revenue Share (%), by Card Type 2024 & 2032
- Figure 74: South America Dried Blood Spot Card Market Volume Share (%), by Card Type 2024 & 2032
- Figure 75: South America Dried Blood Spot Card Market Revenue (Million), by Application 2024 & 2032
- Figure 76: South America Dried Blood Spot Card Market Volume (K Unit), by Application 2024 & 2032
- Figure 77: South America Dried Blood Spot Card Market Revenue Share (%), by Application 2024 & 2032
- Figure 78: South America Dried Blood Spot Card Market Volume Share (%), by Application 2024 & 2032
- Figure 79: South America Dried Blood Spot Card Market Revenue (Million), by Country 2024 & 2032
- Figure 80: South America Dried Blood Spot Card Market Volume (K Unit), by Country 2024 & 2032
- Figure 81: South America Dried Blood Spot Card Market Revenue Share (%), by Country 2024 & 2032
- Figure 82: South America Dried Blood Spot Card Market Volume Share (%), by Country 2024 & 2032
List of Tables
- Table 1: Global Dried Blood Spot Card Market Revenue Million Forecast, by Region 2019 & 2032
- Table 2: Global Dried Blood Spot Card Market Volume K Unit Forecast, by Region 2019 & 2032
- Table 3: Global Dried Blood Spot Card Market Revenue Million Forecast, by Card Type 2019 & 2032
- Table 4: Global Dried Blood Spot Card Market Volume K Unit Forecast, by Card Type 2019 & 2032
- Table 5: Global Dried Blood Spot Card Market Revenue Million Forecast, by Application 2019 & 2032
- Table 6: Global Dried Blood Spot Card Market Volume K Unit Forecast, by Application 2019 & 2032
- Table 7: Global Dried Blood Spot Card Market Revenue Million Forecast, by Region 2019 & 2032
- Table 8: Global Dried Blood Spot Card Market Volume K Unit Forecast, by Region 2019 & 2032
- Table 9: Global Dried Blood Spot Card Market Revenue Million Forecast, by Country 2019 & 2032
- Table 10: Global Dried Blood Spot Card Market Volume K Unit Forecast, by Country 2019 & 2032
- Table 11: United States Dried Blood Spot Card Market Revenue (Million) Forecast, by Application 2019 & 2032
- Table 12: United States Dried Blood Spot Card Market Volume (K Unit) Forecast, by Application 2019 & 2032
- Table 13: Canada Dried Blood Spot Card Market Revenue (Million) Forecast, by Application 2019 & 2032
- Table 14: Canada Dried Blood Spot Card Market Volume (K Unit) Forecast, by Application 2019 & 2032
- Table 15: Mexico Dried Blood Spot Card Market Revenue (Million) Forecast, by Application 2019 & 2032
- Table 16: Mexico Dried Blood Spot Card Market Volume (K Unit) Forecast, by Application 2019 & 2032
- Table 17: Global Dried Blood Spot Card Market Revenue Million Forecast, by Country 2019 & 2032
- Table 18: Global Dried Blood Spot Card Market Volume K Unit Forecast, by Country 2019 & 2032
- Table 19: Germany Dried Blood Spot Card Market Revenue (Million) Forecast, by Application 2019 & 2032
- Table 20: Germany Dried Blood Spot Card Market Volume (K Unit) Forecast, by Application 2019 & 2032
- Table 21: United Kingdom Dried Blood Spot Card Market Revenue (Million) Forecast, by Application 2019 & 2032
- Table 22: United Kingdom Dried Blood Spot Card Market Volume (K Unit) Forecast, by Application 2019 & 2032
- Table 23: France Dried Blood Spot Card Market Revenue (Million) Forecast, by Application 2019 & 2032
- Table 24: France Dried Blood Spot Card Market Volume (K Unit) Forecast, by Application 2019 & 2032
- Table 25: Italy Dried Blood Spot Card Market Revenue (Million) Forecast, by Application 2019 & 2032
- Table 26: Italy Dried Blood Spot Card Market Volume (K Unit) Forecast, by Application 2019 & 2032
- Table 27: Spain Dried Blood Spot Card Market Revenue (Million) Forecast, by Application 2019 & 2032
- Table 28: Spain Dried Blood Spot Card Market Volume (K Unit) Forecast, by Application 2019 & 2032
- Table 29: Rest of Europe Dried Blood Spot Card Market Revenue (Million) Forecast, by Application 2019 & 2032
- Table 30: Rest of Europe Dried Blood Spot Card Market Volume (K Unit) Forecast, by Application 2019 & 2032
- Table 31: Global Dried Blood Spot Card Market Revenue Million Forecast, by Country 2019 & 2032
- Table 32: Global Dried Blood Spot Card Market Volume K Unit Forecast, by Country 2019 & 2032
- Table 33: China Dried Blood Spot Card Market Revenue (Million) Forecast, by Application 2019 & 2032
- Table 34: China Dried Blood Spot Card Market Volume (K Unit) Forecast, by Application 2019 & 2032
- Table 35: Japan Dried Blood Spot Card Market Revenue (Million) Forecast, by Application 2019 & 2032
- Table 36: Japan Dried Blood Spot Card Market Volume (K Unit) Forecast, by Application 2019 & 2032
- Table 37: India Dried Blood Spot Card Market Revenue (Million) Forecast, by Application 2019 & 2032
- Table 38: India Dried Blood Spot Card Market Volume (K Unit) Forecast, by Application 2019 & 2032
- Table 39: Australia Dried Blood Spot Card Market Revenue (Million) Forecast, by Application 2019 & 2032
- Table 40: Australia Dried Blood Spot Card Market Volume (K Unit) Forecast, by Application 2019 & 2032
- Table 41: South Korea Dried Blood Spot Card Market Revenue (Million) Forecast, by Application 2019 & 2032
- Table 42: South Korea Dried Blood Spot Card Market Volume (K Unit) Forecast, by Application 2019 & 2032
- Table 43: Rest of Asia Pacific Dried Blood Spot Card Market Revenue (Million) Forecast, by Application 2019 & 2032
- Table 44: Rest of Asia Pacific Dried Blood Spot Card Market Volume (K Unit) Forecast, by Application 2019 & 2032
- Table 45: Global Dried Blood Spot Card Market Revenue Million Forecast, by Country 2019 & 2032
- Table 46: Global Dried Blood Spot Card Market Volume K Unit Forecast, by Country 2019 & 2032
- Table 47: GCC Dried Blood Spot Card Market Revenue (Million) Forecast, by Application 2019 & 2032
- Table 48: GCC Dried Blood Spot Card Market Volume (K Unit) Forecast, by Application 2019 & 2032
- Table 49: South Africa Dried Blood Spot Card Market Revenue (Million) Forecast, by Application 2019 & 2032
- Table 50: South Africa Dried Blood Spot Card Market Volume (K Unit) Forecast, by Application 2019 & 2032
- Table 51: Rest of Middle East and Africa Dried Blood Spot Card Market Revenue (Million) Forecast, by Application 2019 & 2032
- Table 52: Rest of Middle East and Africa Dried Blood Spot Card Market Volume (K Unit) Forecast, by Application 2019 & 2032
- Table 53: Global Dried Blood Spot Card Market Revenue Million Forecast, by Country 2019 & 2032
- Table 54: Global Dried Blood Spot Card Market Volume K Unit Forecast, by Country 2019 & 2032
- Table 55: Brazil Dried Blood Spot Card Market Revenue (Million) Forecast, by Application 2019 & 2032
- Table 56: Brazil Dried Blood Spot Card Market Volume (K Unit) Forecast, by Application 2019 & 2032
- Table 57: Argentina Dried Blood Spot Card Market Revenue (Million) Forecast, by Application 2019 & 2032
- Table 58: Argentina Dried Blood Spot Card Market Volume (K Unit) Forecast, by Application 2019 & 2032
- Table 59: Rest of South America Dried Blood Spot Card Market Revenue (Million) Forecast, by Application 2019 & 2032
- Table 60: Rest of South America Dried Blood Spot Card Market Volume (K Unit) Forecast, by Application 2019 & 2032
- Table 61: Global Dried Blood Spot Card Market Revenue Million Forecast, by Card Type 2019 & 2032
- Table 62: Global Dried Blood Spot Card Market Volume K Unit Forecast, by Card Type 2019 & 2032
- Table 63: Global Dried Blood Spot Card Market Revenue Million Forecast, by Application 2019 & 2032
- Table 64: Global Dried Blood Spot Card Market Volume K Unit Forecast, by Application 2019 & 2032
- Table 65: Global Dried Blood Spot Card Market Revenue Million Forecast, by Country 2019 & 2032
- Table 66: Global Dried Blood Spot Card Market Volume K Unit Forecast, by Country 2019 & 2032
- Table 67: United States Dried Blood Spot Card Market Revenue (Million) Forecast, by Application 2019 & 2032
- Table 68: United States Dried Blood Spot Card Market Volume (K Unit) Forecast, by Application 2019 & 2032
- Table 69: Canada Dried Blood Spot Card Market Revenue (Million) Forecast, by Application 2019 & 2032
- Table 70: Canada Dried Blood Spot Card Market Volume (K Unit) Forecast, by Application 2019 & 2032
- Table 71: Mexico Dried Blood Spot Card Market Revenue (Million) Forecast, by Application 2019 & 2032
- Table 72: Mexico Dried Blood Spot Card Market Volume (K Unit) Forecast, by Application 2019 & 2032
- Table 73: Global Dried Blood Spot Card Market Revenue Million Forecast, by Card Type 2019 & 2032
- Table 74: Global Dried Blood Spot Card Market Volume K Unit Forecast, by Card Type 2019 & 2032
- Table 75: Global Dried Blood Spot Card Market Revenue Million Forecast, by Application 2019 & 2032
- Table 76: Global Dried Blood Spot Card Market Volume K Unit Forecast, by Application 2019 & 2032
- Table 77: Global Dried Blood Spot Card Market Revenue Million Forecast, by Country 2019 & 2032
- Table 78: Global Dried Blood Spot Card Market Volume K Unit Forecast, by Country 2019 & 2032
- Table 79: Germany Dried Blood Spot Card Market Revenue (Million) Forecast, by Application 2019 & 2032
- Table 80: Germany Dried Blood Spot Card Market Volume (K Unit) Forecast, by Application 2019 & 2032
- Table 81: United Kingdom Dried Blood Spot Card Market Revenue (Million) Forecast, by Application 2019 & 2032
- Table 82: United Kingdom Dried Blood Spot Card Market Volume (K Unit) Forecast, by Application 2019 & 2032
- Table 83: France Dried Blood Spot Card Market Revenue (Million) Forecast, by Application 2019 & 2032
- Table 84: France Dried Blood Spot Card Market Volume (K Unit) Forecast, by Application 2019 & 2032
- Table 85: Italy Dried Blood Spot Card Market Revenue (Million) Forecast, by Application 2019 & 2032
- Table 86: Italy Dried Blood Spot Card Market Volume (K Unit) Forecast, by Application 2019 & 2032
- Table 87: Spain Dried Blood Spot Card Market Revenue (Million) Forecast, by Application 2019 & 2032
- Table 88: Spain Dried Blood Spot Card Market Volume (K Unit) Forecast, by Application 2019 & 2032
- Table 89: Rest of Europe Dried Blood Spot Card Market Revenue (Million) Forecast, by Application 2019 & 2032
- Table 90: Rest of Europe Dried Blood Spot Card Market Volume (K Unit) Forecast, by Application 2019 & 2032
- Table 91: Global Dried Blood Spot Card Market Revenue Million Forecast, by Card Type 2019 & 2032
- Table 92: Global Dried Blood Spot Card Market Volume K Unit Forecast, by Card Type 2019 & 2032
- Table 93: Global Dried Blood Spot Card Market Revenue Million Forecast, by Application 2019 & 2032
- Table 94: Global Dried Blood Spot Card Market Volume K Unit Forecast, by Application 2019 & 2032
- Table 95: Global Dried Blood Spot Card Market Revenue Million Forecast, by Country 2019 & 2032
- Table 96: Global Dried Blood Spot Card Market Volume K Unit Forecast, by Country 2019 & 2032
- Table 97: China Dried Blood Spot Card Market Revenue (Million) Forecast, by Application 2019 & 2032
- Table 98: China Dried Blood Spot Card Market Volume (K Unit) Forecast, by Application 2019 & 2032
- Table 99: Japan Dried Blood Spot Card Market Revenue (Million) Forecast, by Application 2019 & 2032
- Table 100: Japan Dried Blood Spot Card Market Volume (K Unit) Forecast, by Application 2019 & 2032
- Table 101: India Dried Blood Spot Card Market Revenue (Million) Forecast, by Application 2019 & 2032
- Table 102: India Dried Blood Spot Card Market Volume (K Unit) Forecast, by Application 2019 & 2032
- Table 103: Australia Dried Blood Spot Card Market Revenue (Million) Forecast, by Application 2019 & 2032
- Table 104: Australia Dried Blood Spot Card Market Volume (K Unit) Forecast, by Application 2019 & 2032
- Table 105: South Korea Dried Blood Spot Card Market Revenue (Million) Forecast, by Application 2019 & 2032
- Table 106: South Korea Dried Blood Spot Card Market Volume (K Unit) Forecast, by Application 2019 & 2032
- Table 107: Rest of Asia Pacific Dried Blood Spot Card Market Revenue (Million) Forecast, by Application 2019 & 2032
- Table 108: Rest of Asia Pacific Dried Blood Spot Card Market Volume (K Unit) Forecast, by Application 2019 & 2032
- Table 109: Global Dried Blood Spot Card Market Revenue Million Forecast, by Card Type 2019 & 2032
- Table 110: Global Dried Blood Spot Card Market Volume K Unit Forecast, by Card Type 2019 & 2032
- Table 111: Global Dried Blood Spot Card Market Revenue Million Forecast, by Application 2019 & 2032
- Table 112: Global Dried Blood Spot Card Market Volume K Unit Forecast, by Application 2019 & 2032
- Table 113: Global Dried Blood Spot Card Market Revenue Million Forecast, by Country 2019 & 2032
- Table 114: Global Dried Blood Spot Card Market Volume K Unit Forecast, by Country 2019 & 2032
- Table 115: GCC Dried Blood Spot Card Market Revenue (Million) Forecast, by Application 2019 & 2032
- Table 116: GCC Dried Blood Spot Card Market Volume (K Unit) Forecast, by Application 2019 & 2032
- Table 117: South Africa Dried Blood Spot Card Market Revenue (Million) Forecast, by Application 2019 & 2032
- Table 118: South Africa Dried Blood Spot Card Market Volume (K Unit) Forecast, by Application 2019 & 2032
- Table 119: Rest of Middle East and Africa Dried Blood Spot Card Market Revenue (Million) Forecast, by Application 2019 & 2032
- Table 120: Rest of Middle East and Africa Dried Blood Spot Card Market Volume (K Unit) Forecast, by Application 2019 & 2032
- Table 121: Global Dried Blood Spot Card Market Revenue Million Forecast, by Card Type 2019 & 2032
- Table 122: Global Dried Blood Spot Card Market Volume K Unit Forecast, by Card Type 2019 & 2032
- Table 123: Global Dried Blood Spot Card Market Revenue Million Forecast, by Application 2019 & 2032
- Table 124: Global Dried Blood Spot Card Market Volume K Unit Forecast, by Application 2019 & 2032
- Table 125: Global Dried Blood Spot Card Market Revenue Million Forecast, by Country 2019 & 2032
- Table 126: Global Dried Blood Spot Card Market Volume K Unit Forecast, by Country 2019 & 2032
- Table 127: Brazil Dried Blood Spot Card Market Revenue (Million) Forecast, by Application 2019 & 2032
- Table 128: Brazil Dried Blood Spot Card Market Volume (K Unit) Forecast, by Application 2019 & 2032
- Table 129: Argentina Dried Blood Spot Card Market Revenue (Million) Forecast, by Application 2019 & 2032
- Table 130: Argentina Dried Blood Spot Card Market Volume (K Unit) Forecast, by Application 2019 & 2032
- Table 131: Rest of South America Dried Blood Spot Card Market Revenue (Million) Forecast, by Application 2019 & 2032
- Table 132: Rest of South America Dried Blood Spot Card Market Volume (K Unit) Forecast, by Application 2019 & 2032
Frequently Asked Questions
1. What is the projected Compound Annual Growth Rate (CAGR) of the Dried Blood Spot Card Market?
The projected CAGR is approximately 3.10%.
2. Which companies are prominent players in the Dried Blood Spot Card Market?
Key companies in the market include Shimadzu Scientific Instruments, Gentegra LLC, CENTOGENE N V, F Hoffmann-La Roche Ltd, Thomas Scientific, Hemaxis, Lipomic Healthcare, Eastern Business Forms Inc, ARCHIMEDlife, QIAGEN, PerkinElmer, Ahlstrom-Munksjö.
3. What are the main segments of the Dried Blood Spot Card Market?
The market segments include Card Type, Application.
4. Can you provide details about the market size?
The market size is estimated to be USD XX Million as of 2022.
5. What are some drivers contributing to market growth?
Increasing Use of DBS Cards in Diagnostic Testing; Rise of Forensic Toxicology Applications.
6. What are the notable trends driving market growth?
Newborn Screening Segment is Expected to Witness Considerable Growth Over the Forecast Period.
7. Are there any restraints impacting market growth?
Contamination Caused in DBS Collection Cards.
8. Can you provide examples of recent developments in the market?
In August 2022, Boston Heart Diagnostics Corporation launched a broad range of tests with a dried blood spot collection for a broad range of applications including cardiovascular risk factors, type 2 diabetes, and wellness assessments for cognitive, nutritional, women's, and men's health.
9. What pricing options are available for accessing the report?
Pricing options include single-user, multi-user, and enterprise licenses priced at USD 4750, USD 5250, and USD 8750 respectively.
10. Is the market size provided in terms of value or volume?
The market size is provided in terms of value, measured in Million and volume, measured in K Unit.
11. Are there any specific market keywords associated with the report?
Yes, the market keyword associated with the report is "Dried Blood Spot Card Market," which aids in identifying and referencing the specific market segment covered.
12. How do I determine which pricing option suits my needs best?
The pricing options vary based on user requirements and access needs. Individual users may opt for single-user licenses, while businesses requiring broader access may choose multi-user or enterprise licenses for cost-effective access to the report.
13. Are there any additional resources or data provided in the Dried Blood Spot Card Market report?
While the report offers comprehensive insights, it's advisable to review the specific contents or supplementary materials provided to ascertain if additional resources or data are available.
14. How can I stay updated on further developments or reports in the Dried Blood Spot Card Market?
To stay informed about further developments, trends, and reports in the Dried Blood Spot Card Market, consider subscribing to industry newsletters, following relevant companies and organizations, or regularly checking reputable industry news sources and publications.
Methodology
Step 1 - Identification of Relevant Samples Size from Population Database


Step 2 - Approaches for Defining Global Market Size (Value, Volume* & Price*)

Note*: In applicable scenarios
Step 3 - Data Sources
Primary Research
- Web Analytics
- Survey Reports
- Research Institute
- Latest Research Reports
- Opinion Leaders
Secondary Research
- Annual Reports
- White Paper
- Latest Press Release
- Industry Association
- Paid Database
- Investor Presentations

Step 4 - Data Triangulation
Involves using different sources of information in order to increase the validity of a study
These sources are likely to be stakeholders in a program - participants, other researchers, program staff, other community members, and so on.
Then we put all data in single framework & apply various statistical tools to find out the dynamic on the market.
During the analysis stage, feedback from the stakeholder groups would be compared to determine areas of agreement as well as areas of divergence
