

Key Insights
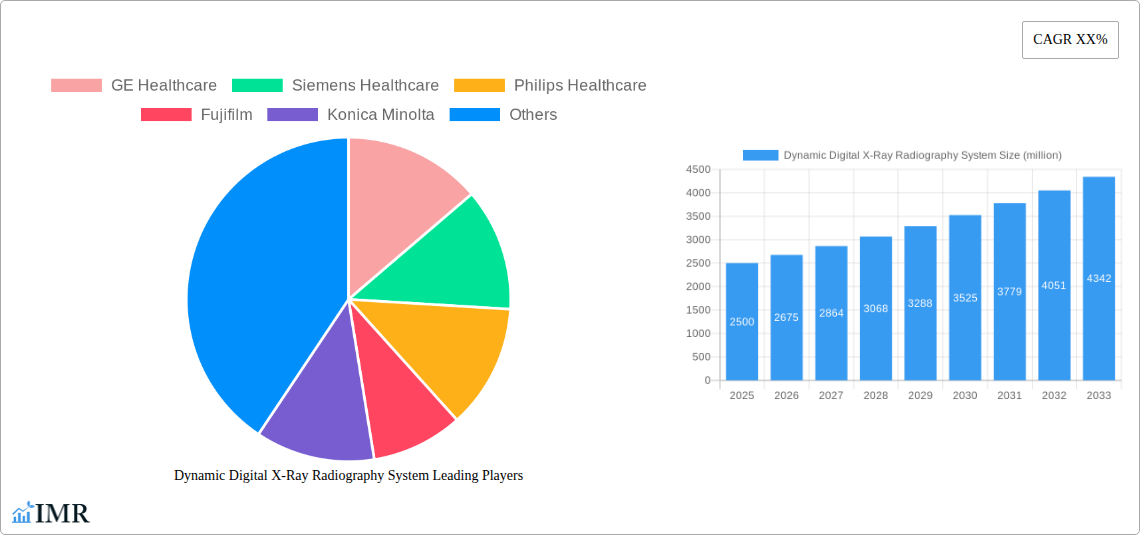
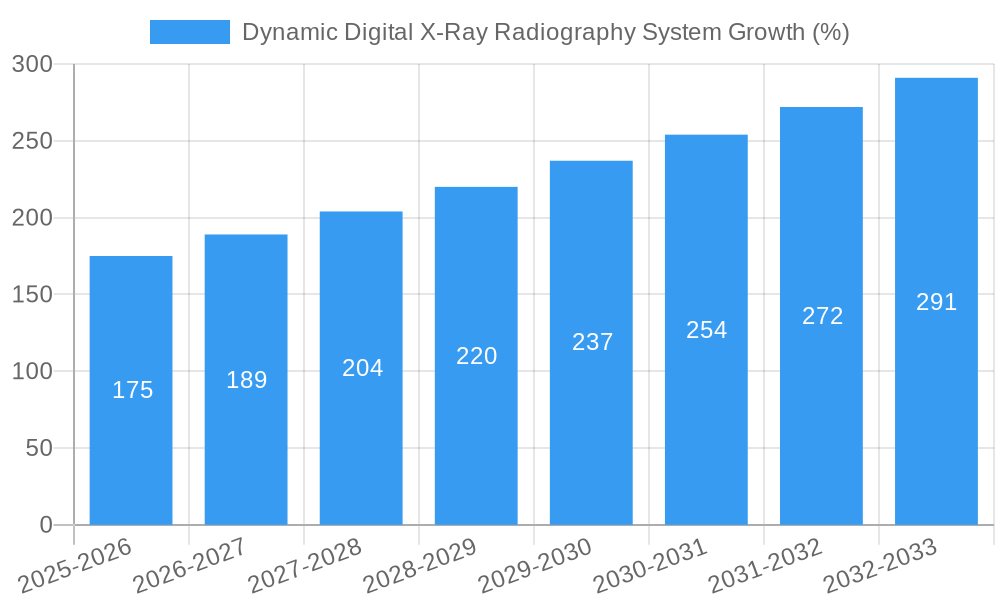
The global dynamic digital X-ray radiography system market is experiencing robust growth, driven by the increasing prevalence of chronic diseases requiring frequent imaging, technological advancements leading to improved image quality and reduced radiation exposure, and the rising adoption of digital healthcare solutions in hospitals and clinics worldwide. The market is estimated to be valued at $2.5 billion in 2025, exhibiting a Compound Annual Growth Rate (CAGR) of 7% from 2025 to 2033. This growth is fueled by factors such as the development of portable and mobile systems enhancing accessibility in remote areas and underserved communities, and the integration of artificial intelligence (AI) for faster and more accurate image analysis. Major players like GE Healthcare, Siemens Healthineers, and Philips Healthcare are driving innovation through continuous product development and strategic partnerships, fostering market competition and pushing technological boundaries.
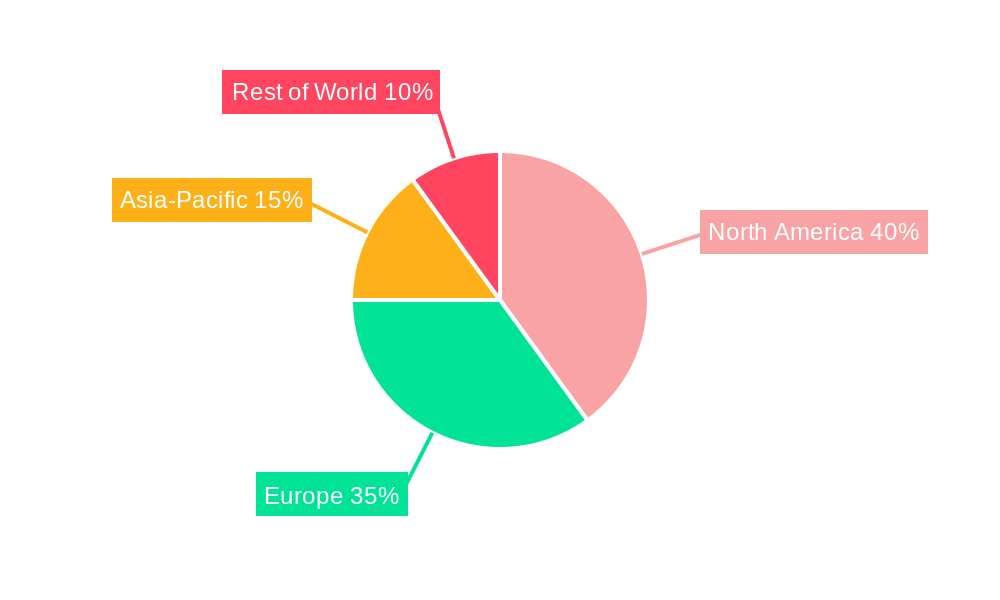
However, high initial investment costs associated with the acquisition and maintenance of these systems, along with the need for skilled professionals for operation and interpretation, pose significant challenges. Furthermore, regulatory hurdles and stringent safety standards in various regions can act as potential restraints. Nevertheless, the long-term benefits of improved diagnostics, reduced healthcare costs through efficient workflows, and the increasing demand for advanced imaging technologies across both developed and developing nations are poised to propel the market forward. Segmentation by system type (portable, mobile, fixed), application (orthopedics, cardiology, oncology), and end-user (hospitals, clinics, diagnostic centers) reveals specific growth pockets that offer strategic opportunities for market players. The North American and European markets currently dominate, but the Asia-Pacific region is projected to witness significant growth in the coming years due to rising healthcare infrastructure and expanding medical tourism.
Dynamic Digital X-Ray Radiography System Market Report: 2019-2033
This comprehensive report provides an in-depth analysis of the dynamic digital X-ray radiography system market, encompassing market size, growth trends, competitive landscape, and future outlook. The report covers the period 2019-2033, with a base year of 2025 and a forecast period of 2025-2033. The parent market is the medical imaging equipment market, and the child market is digital X-ray systems. This report is crucial for industry professionals, investors, and strategic decision-makers seeking to understand and capitalize on the growth opportunities within this evolving sector. The market size in 2025 is estimated at xx million USD and is projected to reach xx million USD by 2033.
Dynamic Digital X-Ray Radiography System Market Dynamics & Structure
The global dynamic digital X-ray radiography system market is characterized by moderate concentration, with key players like GE Healthcare, Siemens Healthineers, and Philips Healthcare holding significant market share. Technological innovation, driven by advancements in digital detectors, image processing software, and artificial intelligence (AI), is a key driver. Stringent regulatory frameworks governing medical device safety and efficacy shape market dynamics, while the availability of alternative imaging modalities (e.g., ultrasound, MRI) presents competitive pressure. The market demonstrates a significant presence in developed economies, with increasing adoption rates in emerging markets. M&A activity has been moderate in recent years, with a total of xx deals recorded between 2019 and 2024, valued at approximately xx million USD.
- Market Concentration: Moderately concentrated, with top 3 players holding approximately xx% market share in 2025.
- Technological Innovation: Focus on improved image quality, reduced radiation dose, and AI-powered image analysis.
- Regulatory Framework: Stringent regulatory compliance requirements (e.g., FDA, CE marking) impact market entry and product development.
- Competitive Substitutes: Ultrasound, MRI, CT scans offer alternative imaging solutions.
- End-User Demographics: Hospitals, clinics, diagnostic imaging centers are primary end users.
- M&A Trends: Moderate M&A activity, primarily focused on expanding product portfolios and geographical reach.
Dynamic Digital X-Ray Radiography System Growth Trends & Insights
The dynamic digital X-ray radiography system market experienced steady growth during the historical period (2019-2024), with a CAGR of approximately xx%. This growth is attributed to factors such as the increasing prevalence of chronic diseases, rising demand for advanced diagnostic imaging techniques, and technological advancements enhancing image quality and efficiency. The market is expected to maintain a healthy growth trajectory during the forecast period (2025-2033), driven by factors such as growing healthcare expenditure, an aging global population, and the increasing adoption of digital X-ray systems in developing countries. Market penetration is expected to increase from xx% in 2025 to xx% by 2033. Technological disruptions, such as the integration of AI and cloud computing, are further accelerating market growth. Shifting consumer behavior towards minimally invasive procedures and improved healthcare access is also driving demand.
Dominant Regions, Countries, or Segments in Dynamic Digital X-Ray Radiography System
North America currently holds the largest market share, driven by high healthcare expenditure, technological advancements, and strong regulatory support. However, the Asia-Pacific region is anticipated to witness significant growth during the forecast period, fueled by rising healthcare infrastructure development, increasing disposable incomes, and a growing aging population. Europe holds a significant share due to advanced healthcare infrastructure, while other regions are expected to see moderate growth.
- North America: High healthcare expenditure, advanced technology adoption, strong regulatory support.
- Asia-Pacific: Rapid infrastructure development, increasing healthcare expenditure, large population base.
- Europe: Well-established healthcare infrastructure, high adoption of advanced technologies.
Dynamic Digital X-Ray Radiography System Product Landscape
Dynamic digital X-ray radiography systems offer superior image quality, reduced radiation exposure, and improved workflow efficiency compared to conventional X-ray systems. Recent product innovations include wireless detectors, advanced image processing algorithms, and AI-powered diagnostic support tools. These advancements enhance diagnostic accuracy and reduce examination time, leading to improved patient care and reduced healthcare costs. Unique selling propositions often include features such as ease of use, portability, and integration with existing hospital information systems.
Key Drivers, Barriers & Challenges in Dynamic Digital X-Ray Radiography System
Key Drivers:
- Increasing prevalence of chronic diseases requiring advanced diagnostic imaging.
- Technological advancements improving image quality, reducing radiation exposure, and enhancing workflow efficiency.
- Rising healthcare expenditure and investments in healthcare infrastructure.
- Growing adoption of digital imaging in developing countries.
Challenges & Restraints:
- High initial investment costs associated with purchasing and implementing advanced systems.
- Stringent regulatory compliance requirements and certification processes.
- Intense competition from established players and the emergence of new entrants.
- Potential supply chain disruptions impacting the availability of crucial components. The impact of these disruptions is estimated to be xx million USD annually.
Emerging Opportunities in Dynamic Digital X-Ray Radiography System
- Untapped markets: Expansion into rural and underserved areas with limited access to diagnostic imaging.
- Innovative applications: Development of specialized systems for specific clinical applications (e.g., dental, veterinary).
- Evolving consumer preferences: Customization of systems to meet individual patient needs and preferences.
- Integration with AI and IoT: Development of AI-powered diagnostic tools and integration with IoT devices for remote monitoring and data analysis.
Growth Accelerators in the Dynamic Digital X-Ray Radiography System Industry
Technological breakthroughs, such as the development of more efficient detectors and advanced image processing algorithms, are significantly accelerating market growth. Strategic partnerships between medical device manufacturers and healthcare providers are also fostering innovation and market expansion. Increased investments in research and development are driving the introduction of new and improved systems, further contributing to market expansion.
Key Players Shaping the Dynamic Digital X-Ray Radiography System Market
- GE Healthcare
- Siemens Healthcare
- Philips Healthcare
- Fujifilm
- Konica Minolta
- Shimadzu Corporation
- Mednova Medical
- Angell Technology
- Perlove Medical Equipment
- Xingaoyi Medical Equipment
Notable Milestones in Dynamic Digital X-Ray Radiography System Sector
- 2021: GE Healthcare launches a new AI-powered digital X-ray system.
- 2022: Siemens Healthineers announces a strategic partnership to expand its global reach.
- 2023: Philips Healthcare introduces a new wireless detector technology.
- 2024: Fujifilm acquires a smaller digital X-ray company, expanding its portfolio.
In-Depth Dynamic Digital X-Ray Radiography System Market Outlook
The future of the dynamic digital X-ray radiography system market is promising. Continued technological advancements, coupled with increasing healthcare expenditure and a growing aging population, will drive market growth. Strategic partnerships, acquisitions, and investments in research and development will further accelerate market expansion. Emerging markets present significant opportunities for growth, while advancements in AI and machine learning will reshape diagnostic capabilities. The market is poised for significant expansion, with substantial growth potential across diverse geographical regions and clinical applications.
Dynamic Digital X-Ray Radiography System Segmentation
-
1. Application
- 1.1. Hospital
- 1.2. Clinic
- 1.3. Physical Examination Center
- 1.4. Rehabilitation Center
- 1.5. Others
-
2. Types
- 2.1. <20frame/s
- 2.2. 20-25frame/s
- 2.3. >25frame/s
Dynamic Digital X-Ray Radiography System Segmentation By Geography
-
1. North America
- 1.1. United States
- 1.2. Canada
- 1.3. Mexico
-
2. South America
- 2.1. Brazil
- 2.2. Argentina
- 2.3. Rest of South America
-
3. Europe
- 3.1. United Kingdom
- 3.2. Germany
- 3.3. France
- 3.4. Italy
- 3.5. Spain
- 3.6. Russia
- 3.7. Benelux
- 3.8. Nordics
- 3.9. Rest of Europe
-
4. Middle East & Africa
- 4.1. Turkey
- 4.2. Israel
- 4.3. GCC
- 4.4. North Africa
- 4.5. South Africa
- 4.6. Rest of Middle East & Africa
-
5. Asia Pacific
- 5.1. China
- 5.2. India
- 5.3. Japan
- 5.4. South Korea
- 5.5. ASEAN
- 5.6. Oceania
- 5.7. Rest of Asia Pacific
Dynamic Digital X-Ray Radiography System REPORT HIGHLIGHTS
| Aspects | Details |
|---|---|
| Study Period | 2019-2033 |
| Base Year | 2024 |
| Estimated Year | 2025 |
| Forecast Period | 2025-2033 |
| Historical Period | 2019-2024 |
| Growth Rate | CAGR of XX% from 2019-2033 |
| Segmentation |
|
Table of Contents
- 1. Introduction
- 1.1. Research Scope
- 1.2. Market Segmentation
- 1.3. Research Methodology
- 1.4. Definitions and Assumptions
- 2. Executive Summary
- 2.1. Introduction
- 3. Market Dynamics
- 3.1. Introduction
- 3.2. Market Drivers
- 3.3. Market Restrains
- 3.4. Market Trends
- 4. Market Factor Analysis
- 4.1. Porters Five Forces
- 4.2. Supply/Value Chain
- 4.3. PESTEL analysis
- 4.4. Market Entropy
- 4.5. Patent/Trademark Analysis
- 5. Global Dynamic Digital X-Ray Radiography System Analysis, Insights and Forecast, 2019-2031
- 5.1. Market Analysis, Insights and Forecast - by Application
- 5.1.1. Hospital
- 5.1.2. Clinic
- 5.1.3. Physical Examination Center
- 5.1.4. Rehabilitation Center
- 5.1.5. Others
- 5.2. Market Analysis, Insights and Forecast - by Types
- 5.2.1. <20frame/s
- 5.2.2. 20-25frame/s
- 5.2.3. >25frame/s
- 5.3. Market Analysis, Insights and Forecast - by Region
- 5.3.1. North America
- 5.3.2. South America
- 5.3.3. Europe
- 5.3.4. Middle East & Africa
- 5.3.5. Asia Pacific
- 5.1. Market Analysis, Insights and Forecast - by Application
- 6. North America Dynamic Digital X-Ray Radiography System Analysis, Insights and Forecast, 2019-2031
- 6.1. Market Analysis, Insights and Forecast - by Application
- 6.1.1. Hospital
- 6.1.2. Clinic
- 6.1.3. Physical Examination Center
- 6.1.4. Rehabilitation Center
- 6.1.5. Others
- 6.2. Market Analysis, Insights and Forecast - by Types
- 6.2.1. <20frame/s
- 6.2.2. 20-25frame/s
- 6.2.3. >25frame/s
- 6.1. Market Analysis, Insights and Forecast - by Application
- 7. South America Dynamic Digital X-Ray Radiography System Analysis, Insights and Forecast, 2019-2031
- 7.1. Market Analysis, Insights and Forecast - by Application
- 7.1.1. Hospital
- 7.1.2. Clinic
- 7.1.3. Physical Examination Center
- 7.1.4. Rehabilitation Center
- 7.1.5. Others
- 7.2. Market Analysis, Insights and Forecast - by Types
- 7.2.1. <20frame/s
- 7.2.2. 20-25frame/s
- 7.2.3. >25frame/s
- 7.1. Market Analysis, Insights and Forecast - by Application
- 8. Europe Dynamic Digital X-Ray Radiography System Analysis, Insights and Forecast, 2019-2031
- 8.1. Market Analysis, Insights and Forecast - by Application
- 8.1.1. Hospital
- 8.1.2. Clinic
- 8.1.3. Physical Examination Center
- 8.1.4. Rehabilitation Center
- 8.1.5. Others
- 8.2. Market Analysis, Insights and Forecast - by Types
- 8.2.1. <20frame/s
- 8.2.2. 20-25frame/s
- 8.2.3. >25frame/s
- 8.1. Market Analysis, Insights and Forecast - by Application
- 9. Middle East & Africa Dynamic Digital X-Ray Radiography System Analysis, Insights and Forecast, 2019-2031
- 9.1. Market Analysis, Insights and Forecast - by Application
- 9.1.1. Hospital
- 9.1.2. Clinic
- 9.1.3. Physical Examination Center
- 9.1.4. Rehabilitation Center
- 9.1.5. Others
- 9.2. Market Analysis, Insights and Forecast - by Types
- 9.2.1. <20frame/s
- 9.2.2. 20-25frame/s
- 9.2.3. >25frame/s
- 9.1. Market Analysis, Insights and Forecast - by Application
- 10. Asia Pacific Dynamic Digital X-Ray Radiography System Analysis, Insights and Forecast, 2019-2031
- 10.1. Market Analysis, Insights and Forecast - by Application
- 10.1.1. Hospital
- 10.1.2. Clinic
- 10.1.3. Physical Examination Center
- 10.1.4. Rehabilitation Center
- 10.1.5. Others
- 10.2. Market Analysis, Insights and Forecast - by Types
- 10.2.1. <20frame/s
- 10.2.2. 20-25frame/s
- 10.2.3. >25frame/s
- 10.1. Market Analysis, Insights and Forecast - by Application
- 11. Competitive Analysis
- 11.1. Global Market Share Analysis 2024
- 11.2. Company Profiles
- 11.2.1 GE Healthcare
- 11.2.1.1. Overview
- 11.2.1.2. Products
- 11.2.1.3. SWOT Analysis
- 11.2.1.4. Recent Developments
- 11.2.1.5. Financials (Based on Availability)
- 11.2.2 Siemens Healthcare
- 11.2.2.1. Overview
- 11.2.2.2. Products
- 11.2.2.3. SWOT Analysis
- 11.2.2.4. Recent Developments
- 11.2.2.5. Financials (Based on Availability)
- 11.2.3 Philips Healthcare
- 11.2.3.1. Overview
- 11.2.3.2. Products
- 11.2.3.3. SWOT Analysis
- 11.2.3.4. Recent Developments
- 11.2.3.5. Financials (Based on Availability)
- 11.2.4 Fujifilm
- 11.2.4.1. Overview
- 11.2.4.2. Products
- 11.2.4.3. SWOT Analysis
- 11.2.4.4. Recent Developments
- 11.2.4.5. Financials (Based on Availability)
- 11.2.5 Konica Minolta
- 11.2.5.1. Overview
- 11.2.5.2. Products
- 11.2.5.3. SWOT Analysis
- 11.2.5.4. Recent Developments
- 11.2.5.5. Financials (Based on Availability)
- 11.2.6 Shimadzu Corporation
- 11.2.6.1. Overview
- 11.2.6.2. Products
- 11.2.6.3. SWOT Analysis
- 11.2.6.4. Recent Developments
- 11.2.6.5. Financials (Based on Availability)
- 11.2.7 Mednova Medical
- 11.2.7.1. Overview
- 11.2.7.2. Products
- 11.2.7.3. SWOT Analysis
- 11.2.7.4. Recent Developments
- 11.2.7.5. Financials (Based on Availability)
- 11.2.8 Angell Technology
- 11.2.8.1. Overview
- 11.2.8.2. Products
- 11.2.8.3. SWOT Analysis
- 11.2.8.4. Recent Developments
- 11.2.8.5. Financials (Based on Availability)
- 11.2.9 Perlove Medical Equipment
- 11.2.9.1. Overview
- 11.2.9.2. Products
- 11.2.9.3. SWOT Analysis
- 11.2.9.4. Recent Developments
- 11.2.9.5. Financials (Based on Availability)
- 11.2.10 Xingaoyi Medical Equipment
- 11.2.10.1. Overview
- 11.2.10.2. Products
- 11.2.10.3. SWOT Analysis
- 11.2.10.4. Recent Developments
- 11.2.10.5. Financials (Based on Availability)
- 11.2.1 GE Healthcare
List of Figures
- Figure 1: Global Dynamic Digital X-Ray Radiography System Revenue Breakdown (million, %) by Region 2024 & 2032
- Figure 2: Global Dynamic Digital X-Ray Radiography System Volume Breakdown (K, %) by Region 2024 & 2032
- Figure 3: North America Dynamic Digital X-Ray Radiography System Revenue (million), by Application 2024 & 2032
- Figure 4: North America Dynamic Digital X-Ray Radiography System Volume (K), by Application 2024 & 2032
- Figure 5: North America Dynamic Digital X-Ray Radiography System Revenue Share (%), by Application 2024 & 2032
- Figure 6: North America Dynamic Digital X-Ray Radiography System Volume Share (%), by Application 2024 & 2032
- Figure 7: North America Dynamic Digital X-Ray Radiography System Revenue (million), by Types 2024 & 2032
- Figure 8: North America Dynamic Digital X-Ray Radiography System Volume (K), by Types 2024 & 2032
- Figure 9: North America Dynamic Digital X-Ray Radiography System Revenue Share (%), by Types 2024 & 2032
- Figure 10: North America Dynamic Digital X-Ray Radiography System Volume Share (%), by Types 2024 & 2032
- Figure 11: North America Dynamic Digital X-Ray Radiography System Revenue (million), by Country 2024 & 2032
- Figure 12: North America Dynamic Digital X-Ray Radiography System Volume (K), by Country 2024 & 2032
- Figure 13: North America Dynamic Digital X-Ray Radiography System Revenue Share (%), by Country 2024 & 2032
- Figure 14: North America Dynamic Digital X-Ray Radiography System Volume Share (%), by Country 2024 & 2032
- Figure 15: South America Dynamic Digital X-Ray Radiography System Revenue (million), by Application 2024 & 2032
- Figure 16: South America Dynamic Digital X-Ray Radiography System Volume (K), by Application 2024 & 2032
- Figure 17: South America Dynamic Digital X-Ray Radiography System Revenue Share (%), by Application 2024 & 2032
- Figure 18: South America Dynamic Digital X-Ray Radiography System Volume Share (%), by Application 2024 & 2032
- Figure 19: South America Dynamic Digital X-Ray Radiography System Revenue (million), by Types 2024 & 2032
- Figure 20: South America Dynamic Digital X-Ray Radiography System Volume (K), by Types 2024 & 2032
- Figure 21: South America Dynamic Digital X-Ray Radiography System Revenue Share (%), by Types 2024 & 2032
- Figure 22: South America Dynamic Digital X-Ray Radiography System Volume Share (%), by Types 2024 & 2032
- Figure 23: South America Dynamic Digital X-Ray Radiography System Revenue (million), by Country 2024 & 2032
- Figure 24: South America Dynamic Digital X-Ray Radiography System Volume (K), by Country 2024 & 2032
- Figure 25: South America Dynamic Digital X-Ray Radiography System Revenue Share (%), by Country 2024 & 2032
- Figure 26: South America Dynamic Digital X-Ray Radiography System Volume Share (%), by Country 2024 & 2032
- Figure 27: Europe Dynamic Digital X-Ray Radiography System Revenue (million), by Application 2024 & 2032
- Figure 28: Europe Dynamic Digital X-Ray Radiography System Volume (K), by Application 2024 & 2032
- Figure 29: Europe Dynamic Digital X-Ray Radiography System Revenue Share (%), by Application 2024 & 2032
- Figure 30: Europe Dynamic Digital X-Ray Radiography System Volume Share (%), by Application 2024 & 2032
- Figure 31: Europe Dynamic Digital X-Ray Radiography System Revenue (million), by Types 2024 & 2032
- Figure 32: Europe Dynamic Digital X-Ray Radiography System Volume (K), by Types 2024 & 2032
- Figure 33: Europe Dynamic Digital X-Ray Radiography System Revenue Share (%), by Types 2024 & 2032
- Figure 34: Europe Dynamic Digital X-Ray Radiography System Volume Share (%), by Types 2024 & 2032
- Figure 35: Europe Dynamic Digital X-Ray Radiography System Revenue (million), by Country 2024 & 2032
- Figure 36: Europe Dynamic Digital X-Ray Radiography System Volume (K), by Country 2024 & 2032
- Figure 37: Europe Dynamic Digital X-Ray Radiography System Revenue Share (%), by Country 2024 & 2032
- Figure 38: Europe Dynamic Digital X-Ray Radiography System Volume Share (%), by Country 2024 & 2032
- Figure 39: Middle East & Africa Dynamic Digital X-Ray Radiography System Revenue (million), by Application 2024 & 2032
- Figure 40: Middle East & Africa Dynamic Digital X-Ray Radiography System Volume (K), by Application 2024 & 2032
- Figure 41: Middle East & Africa Dynamic Digital X-Ray Radiography System Revenue Share (%), by Application 2024 & 2032
- Figure 42: Middle East & Africa Dynamic Digital X-Ray Radiography System Volume Share (%), by Application 2024 & 2032
- Figure 43: Middle East & Africa Dynamic Digital X-Ray Radiography System Revenue (million), by Types 2024 & 2032
- Figure 44: Middle East & Africa Dynamic Digital X-Ray Radiography System Volume (K), by Types 2024 & 2032
- Figure 45: Middle East & Africa Dynamic Digital X-Ray Radiography System Revenue Share (%), by Types 2024 & 2032
- Figure 46: Middle East & Africa Dynamic Digital X-Ray Radiography System Volume Share (%), by Types 2024 & 2032
- Figure 47: Middle East & Africa Dynamic Digital X-Ray Radiography System Revenue (million), by Country 2024 & 2032
- Figure 48: Middle East & Africa Dynamic Digital X-Ray Radiography System Volume (K), by Country 2024 & 2032
- Figure 49: Middle East & Africa Dynamic Digital X-Ray Radiography System Revenue Share (%), by Country 2024 & 2032
- Figure 50: Middle East & Africa Dynamic Digital X-Ray Radiography System Volume Share (%), by Country 2024 & 2032
- Figure 51: Asia Pacific Dynamic Digital X-Ray Radiography System Revenue (million), by Application 2024 & 2032
- Figure 52: Asia Pacific Dynamic Digital X-Ray Radiography System Volume (K), by Application 2024 & 2032
- Figure 53: Asia Pacific Dynamic Digital X-Ray Radiography System Revenue Share (%), by Application 2024 & 2032
- Figure 54: Asia Pacific Dynamic Digital X-Ray Radiography System Volume Share (%), by Application 2024 & 2032
- Figure 55: Asia Pacific Dynamic Digital X-Ray Radiography System Revenue (million), by Types 2024 & 2032
- Figure 56: Asia Pacific Dynamic Digital X-Ray Radiography System Volume (K), by Types 2024 & 2032
- Figure 57: Asia Pacific Dynamic Digital X-Ray Radiography System Revenue Share (%), by Types 2024 & 2032
- Figure 58: Asia Pacific Dynamic Digital X-Ray Radiography System Volume Share (%), by Types 2024 & 2032
- Figure 59: Asia Pacific Dynamic Digital X-Ray Radiography System Revenue (million), by Country 2024 & 2032
- Figure 60: Asia Pacific Dynamic Digital X-Ray Radiography System Volume (K), by Country 2024 & 2032
- Figure 61: Asia Pacific Dynamic Digital X-Ray Radiography System Revenue Share (%), by Country 2024 & 2032
- Figure 62: Asia Pacific Dynamic Digital X-Ray Radiography System Volume Share (%), by Country 2024 & 2032
List of Tables
- Table 1: Global Dynamic Digital X-Ray Radiography System Revenue million Forecast, by Region 2019 & 2032
- Table 2: Global Dynamic Digital X-Ray Radiography System Volume K Forecast, by Region 2019 & 2032
- Table 3: Global Dynamic Digital X-Ray Radiography System Revenue million Forecast, by Application 2019 & 2032
- Table 4: Global Dynamic Digital X-Ray Radiography System Volume K Forecast, by Application 2019 & 2032
- Table 5: Global Dynamic Digital X-Ray Radiography System Revenue million Forecast, by Types 2019 & 2032
- Table 6: Global Dynamic Digital X-Ray Radiography System Volume K Forecast, by Types 2019 & 2032
- Table 7: Global Dynamic Digital X-Ray Radiography System Revenue million Forecast, by Region 2019 & 2032
- Table 8: Global Dynamic Digital X-Ray Radiography System Volume K Forecast, by Region 2019 & 2032
- Table 9: Global Dynamic Digital X-Ray Radiography System Revenue million Forecast, by Application 2019 & 2032
- Table 10: Global Dynamic Digital X-Ray Radiography System Volume K Forecast, by Application 2019 & 2032
- Table 11: Global Dynamic Digital X-Ray Radiography System Revenue million Forecast, by Types 2019 & 2032
- Table 12: Global Dynamic Digital X-Ray Radiography System Volume K Forecast, by Types 2019 & 2032
- Table 13: Global Dynamic Digital X-Ray Radiography System Revenue million Forecast, by Country 2019 & 2032
- Table 14: Global Dynamic Digital X-Ray Radiography System Volume K Forecast, by Country 2019 & 2032
- Table 15: United States Dynamic Digital X-Ray Radiography System Revenue (million) Forecast, by Application 2019 & 2032
- Table 16: United States Dynamic Digital X-Ray Radiography System Volume (K) Forecast, by Application 2019 & 2032
- Table 17: Canada Dynamic Digital X-Ray Radiography System Revenue (million) Forecast, by Application 2019 & 2032
- Table 18: Canada Dynamic Digital X-Ray Radiography System Volume (K) Forecast, by Application 2019 & 2032
- Table 19: Mexico Dynamic Digital X-Ray Radiography System Revenue (million) Forecast, by Application 2019 & 2032
- Table 20: Mexico Dynamic Digital X-Ray Radiography System Volume (K) Forecast, by Application 2019 & 2032
- Table 21: Global Dynamic Digital X-Ray Radiography System Revenue million Forecast, by Application 2019 & 2032
- Table 22: Global Dynamic Digital X-Ray Radiography System Volume K Forecast, by Application 2019 & 2032
- Table 23: Global Dynamic Digital X-Ray Radiography System Revenue million Forecast, by Types 2019 & 2032
- Table 24: Global Dynamic Digital X-Ray Radiography System Volume K Forecast, by Types 2019 & 2032
- Table 25: Global Dynamic Digital X-Ray Radiography System Revenue million Forecast, by Country 2019 & 2032
- Table 26: Global Dynamic Digital X-Ray Radiography System Volume K Forecast, by Country 2019 & 2032
- Table 27: Brazil Dynamic Digital X-Ray Radiography System Revenue (million) Forecast, by Application 2019 & 2032
- Table 28: Brazil Dynamic Digital X-Ray Radiography System Volume (K) Forecast, by Application 2019 & 2032
- Table 29: Argentina Dynamic Digital X-Ray Radiography System Revenue (million) Forecast, by Application 2019 & 2032
- Table 30: Argentina Dynamic Digital X-Ray Radiography System Volume (K) Forecast, by Application 2019 & 2032
- Table 31: Rest of South America Dynamic Digital X-Ray Radiography System Revenue (million) Forecast, by Application 2019 & 2032
- Table 32: Rest of South America Dynamic Digital X-Ray Radiography System Volume (K) Forecast, by Application 2019 & 2032
- Table 33: Global Dynamic Digital X-Ray Radiography System Revenue million Forecast, by Application 2019 & 2032
- Table 34: Global Dynamic Digital X-Ray Radiography System Volume K Forecast, by Application 2019 & 2032
- Table 35: Global Dynamic Digital X-Ray Radiography System Revenue million Forecast, by Types 2019 & 2032
- Table 36: Global Dynamic Digital X-Ray Radiography System Volume K Forecast, by Types 2019 & 2032
- Table 37: Global Dynamic Digital X-Ray Radiography System Revenue million Forecast, by Country 2019 & 2032
- Table 38: Global Dynamic Digital X-Ray Radiography System Volume K Forecast, by Country 2019 & 2032
- Table 39: United Kingdom Dynamic Digital X-Ray Radiography System Revenue (million) Forecast, by Application 2019 & 2032
- Table 40: United Kingdom Dynamic Digital X-Ray Radiography System Volume (K) Forecast, by Application 2019 & 2032
- Table 41: Germany Dynamic Digital X-Ray Radiography System Revenue (million) Forecast, by Application 2019 & 2032
- Table 42: Germany Dynamic Digital X-Ray Radiography System Volume (K) Forecast, by Application 2019 & 2032
- Table 43: France Dynamic Digital X-Ray Radiography System Revenue (million) Forecast, by Application 2019 & 2032
- Table 44: France Dynamic Digital X-Ray Radiography System Volume (K) Forecast, by Application 2019 & 2032
- Table 45: Italy Dynamic Digital X-Ray Radiography System Revenue (million) Forecast, by Application 2019 & 2032
- Table 46: Italy Dynamic Digital X-Ray Radiography System Volume (K) Forecast, by Application 2019 & 2032
- Table 47: Spain Dynamic Digital X-Ray Radiography System Revenue (million) Forecast, by Application 2019 & 2032
- Table 48: Spain Dynamic Digital X-Ray Radiography System Volume (K) Forecast, by Application 2019 & 2032
- Table 49: Russia Dynamic Digital X-Ray Radiography System Revenue (million) Forecast, by Application 2019 & 2032
- Table 50: Russia Dynamic Digital X-Ray Radiography System Volume (K) Forecast, by Application 2019 & 2032
- Table 51: Benelux Dynamic Digital X-Ray Radiography System Revenue (million) Forecast, by Application 2019 & 2032
- Table 52: Benelux Dynamic Digital X-Ray Radiography System Volume (K) Forecast, by Application 2019 & 2032
- Table 53: Nordics Dynamic Digital X-Ray Radiography System Revenue (million) Forecast, by Application 2019 & 2032
- Table 54: Nordics Dynamic Digital X-Ray Radiography System Volume (K) Forecast, by Application 2019 & 2032
- Table 55: Rest of Europe Dynamic Digital X-Ray Radiography System Revenue (million) Forecast, by Application 2019 & 2032
- Table 56: Rest of Europe Dynamic Digital X-Ray Radiography System Volume (K) Forecast, by Application 2019 & 2032
- Table 57: Global Dynamic Digital X-Ray Radiography System Revenue million Forecast, by Application 2019 & 2032
- Table 58: Global Dynamic Digital X-Ray Radiography System Volume K Forecast, by Application 2019 & 2032
- Table 59: Global Dynamic Digital X-Ray Radiography System Revenue million Forecast, by Types 2019 & 2032
- Table 60: Global Dynamic Digital X-Ray Radiography System Volume K Forecast, by Types 2019 & 2032
- Table 61: Global Dynamic Digital X-Ray Radiography System Revenue million Forecast, by Country 2019 & 2032
- Table 62: Global Dynamic Digital X-Ray Radiography System Volume K Forecast, by Country 2019 & 2032
- Table 63: Turkey Dynamic Digital X-Ray Radiography System Revenue (million) Forecast, by Application 2019 & 2032
- Table 64: Turkey Dynamic Digital X-Ray Radiography System Volume (K) Forecast, by Application 2019 & 2032
- Table 65: Israel Dynamic Digital X-Ray Radiography System Revenue (million) Forecast, by Application 2019 & 2032
- Table 66: Israel Dynamic Digital X-Ray Radiography System Volume (K) Forecast, by Application 2019 & 2032
- Table 67: GCC Dynamic Digital X-Ray Radiography System Revenue (million) Forecast, by Application 2019 & 2032
- Table 68: GCC Dynamic Digital X-Ray Radiography System Volume (K) Forecast, by Application 2019 & 2032
- Table 69: North Africa Dynamic Digital X-Ray Radiography System Revenue (million) Forecast, by Application 2019 & 2032
- Table 70: North Africa Dynamic Digital X-Ray Radiography System Volume (K) Forecast, by Application 2019 & 2032
- Table 71: South Africa Dynamic Digital X-Ray Radiography System Revenue (million) Forecast, by Application 2019 & 2032
- Table 72: South Africa Dynamic Digital X-Ray Radiography System Volume (K) Forecast, by Application 2019 & 2032
- Table 73: Rest of Middle East & Africa Dynamic Digital X-Ray Radiography System Revenue (million) Forecast, by Application 2019 & 2032
- Table 74: Rest of Middle East & Africa Dynamic Digital X-Ray Radiography System Volume (K) Forecast, by Application 2019 & 2032
- Table 75: Global Dynamic Digital X-Ray Radiography System Revenue million Forecast, by Application 2019 & 2032
- Table 76: Global Dynamic Digital X-Ray Radiography System Volume K Forecast, by Application 2019 & 2032
- Table 77: Global Dynamic Digital X-Ray Radiography System Revenue million Forecast, by Types 2019 & 2032
- Table 78: Global Dynamic Digital X-Ray Radiography System Volume K Forecast, by Types 2019 & 2032
- Table 79: Global Dynamic Digital X-Ray Radiography System Revenue million Forecast, by Country 2019 & 2032
- Table 80: Global Dynamic Digital X-Ray Radiography System Volume K Forecast, by Country 2019 & 2032
- Table 81: China Dynamic Digital X-Ray Radiography System Revenue (million) Forecast, by Application 2019 & 2032
- Table 82: China Dynamic Digital X-Ray Radiography System Volume (K) Forecast, by Application 2019 & 2032
- Table 83: India Dynamic Digital X-Ray Radiography System Revenue (million) Forecast, by Application 2019 & 2032
- Table 84: India Dynamic Digital X-Ray Radiography System Volume (K) Forecast, by Application 2019 & 2032
- Table 85: Japan Dynamic Digital X-Ray Radiography System Revenue (million) Forecast, by Application 2019 & 2032
- Table 86: Japan Dynamic Digital X-Ray Radiography System Volume (K) Forecast, by Application 2019 & 2032
- Table 87: South Korea Dynamic Digital X-Ray Radiography System Revenue (million) Forecast, by Application 2019 & 2032
- Table 88: South Korea Dynamic Digital X-Ray Radiography System Volume (K) Forecast, by Application 2019 & 2032
- Table 89: ASEAN Dynamic Digital X-Ray Radiography System Revenue (million) Forecast, by Application 2019 & 2032
- Table 90: ASEAN Dynamic Digital X-Ray Radiography System Volume (K) Forecast, by Application 2019 & 2032
- Table 91: Oceania Dynamic Digital X-Ray Radiography System Revenue (million) Forecast, by Application 2019 & 2032
- Table 92: Oceania Dynamic Digital X-Ray Radiography System Volume (K) Forecast, by Application 2019 & 2032
- Table 93: Rest of Asia Pacific Dynamic Digital X-Ray Radiography System Revenue (million) Forecast, by Application 2019 & 2032
- Table 94: Rest of Asia Pacific Dynamic Digital X-Ray Radiography System Volume (K) Forecast, by Application 2019 & 2032
Frequently Asked Questions
1. What is the projected Compound Annual Growth Rate (CAGR) of the Dynamic Digital X-Ray Radiography System?
The projected CAGR is approximately XX%.
2. Which companies are prominent players in the Dynamic Digital X-Ray Radiography System?
Key companies in the market include GE Healthcare, Siemens Healthcare, Philips Healthcare, Fujifilm, Konica Minolta, Shimadzu Corporation, Mednova Medical, Angell Technology, Perlove Medical Equipment, Xingaoyi Medical Equipment.
3. What are the main segments of the Dynamic Digital X-Ray Radiography System?
The market segments include Application, Types.
4. Can you provide details about the market size?
The market size is estimated to be USD XXX million as of 2022.
5. What are some drivers contributing to market growth?
N/A
6. What are the notable trends driving market growth?
N/A
7. Are there any restraints impacting market growth?
N/A
8. Can you provide examples of recent developments in the market?
N/A
9. What pricing options are available for accessing the report?
Pricing options include single-user, multi-user, and enterprise licenses priced at USD 4350.00, USD 6525.00, and USD 8700.00 respectively.
10. Is the market size provided in terms of value or volume?
The market size is provided in terms of value, measured in million and volume, measured in K.
11. Are there any specific market keywords associated with the report?
Yes, the market keyword associated with the report is "Dynamic Digital X-Ray Radiography System," which aids in identifying and referencing the specific market segment covered.
12. How do I determine which pricing option suits my needs best?
The pricing options vary based on user requirements and access needs. Individual users may opt for single-user licenses, while businesses requiring broader access may choose multi-user or enterprise licenses for cost-effective access to the report.
13. Are there any additional resources or data provided in the Dynamic Digital X-Ray Radiography System report?
While the report offers comprehensive insights, it's advisable to review the specific contents or supplementary materials provided to ascertain if additional resources or data are available.
14. How can I stay updated on further developments or reports in the Dynamic Digital X-Ray Radiography System?
To stay informed about further developments, trends, and reports in the Dynamic Digital X-Ray Radiography System, consider subscribing to industry newsletters, following relevant companies and organizations, or regularly checking reputable industry news sources and publications.
Methodology
Step 1 - Identification of Relevant Samples Size from Population Database


Step 2 - Approaches for Defining Global Market Size (Value, Volume* & Price*)

Note*: In applicable scenarios
Step 3 - Data Sources
Primary Research
- Web Analytics
- Survey Reports
- Research Institute
- Latest Research Reports
- Opinion Leaders
Secondary Research
- Annual Reports
- White Paper
- Latest Press Release
- Industry Association
- Paid Database
- Investor Presentations

Step 4 - Data Triangulation
Involves using different sources of information in order to increase the validity of a study
These sources are likely to be stakeholders in a program - participants, other researchers, program staff, other community members, and so on.
Then we put all data in single framework & apply various statistical tools to find out the dynamic on the market.
During the analysis stage, feedback from the stakeholder groups would be compared to determine areas of agreement as well as areas of divergence
