

Key Insights
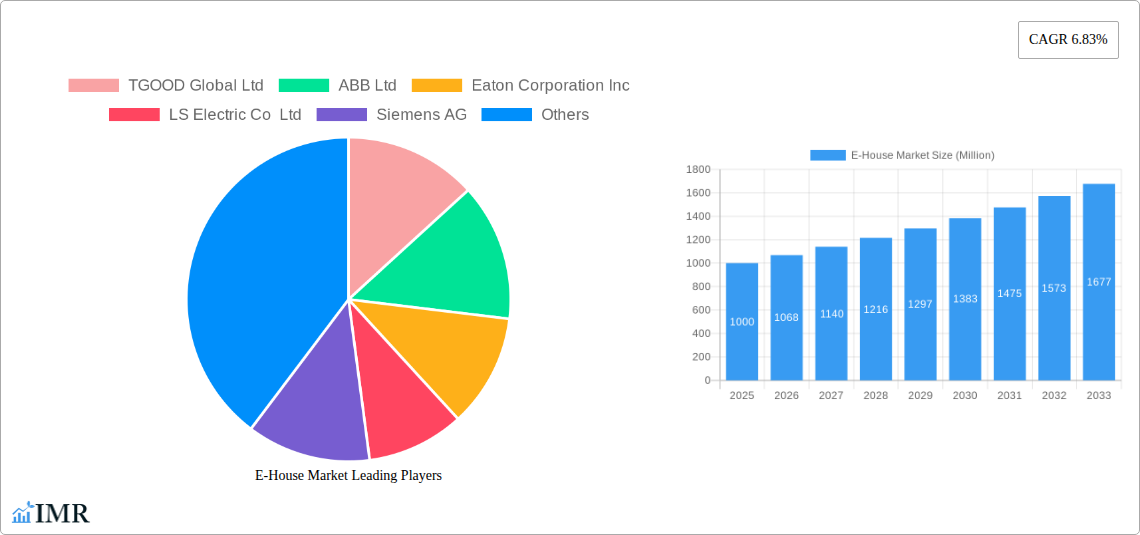
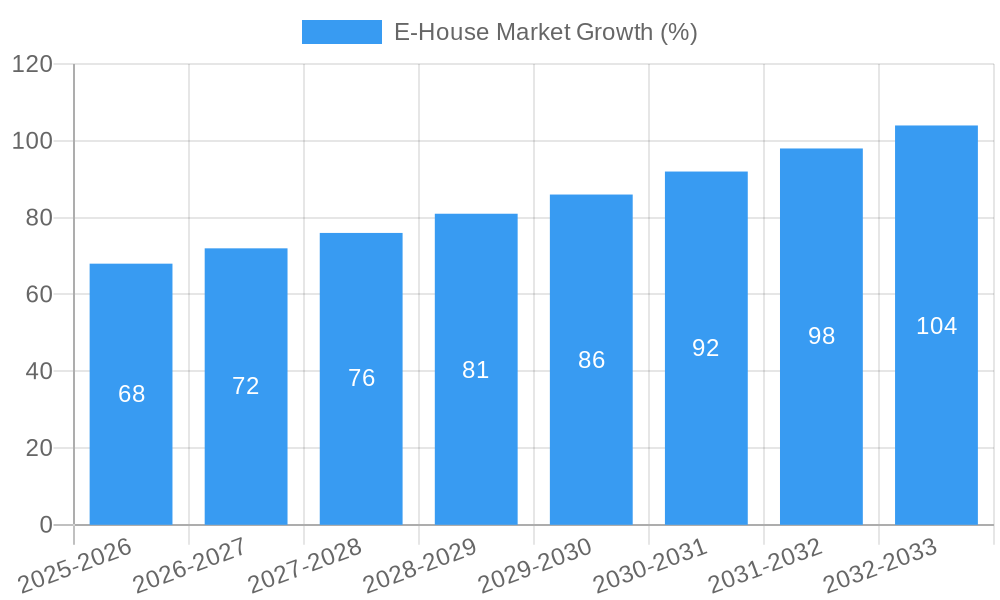
The global E-House market, valued at approximately $XX million in 2025, is projected to experience robust growth, exhibiting a Compound Annual Growth Rate (CAGR) of 6.83% from 2025 to 2033. This expansion is driven by several key factors. The increasing demand for reliable and efficient power distribution in rapidly developing industrial and utility sectors is a significant catalyst. Furthermore, the rising adoption of renewable energy sources, necessitating efficient power management solutions, is fueling market growth. The shift towards smart grids and the integration of advanced technologies like IoT and AI within E-Houses further enhances their appeal. Growth is also observed across various segments, including Fixed E-Houses, preferred for their permanent infrastructure, and Mobile Substations, providing flexibility for temporary or emergency power needs. The utilities sector represents a substantial market segment, driven by the need to modernize aging infrastructure and improve power distribution efficiency. Similarly, the industrial sector is a major consumer, requiring robust and customized E-House solutions for varied applications, from manufacturing to data centers.
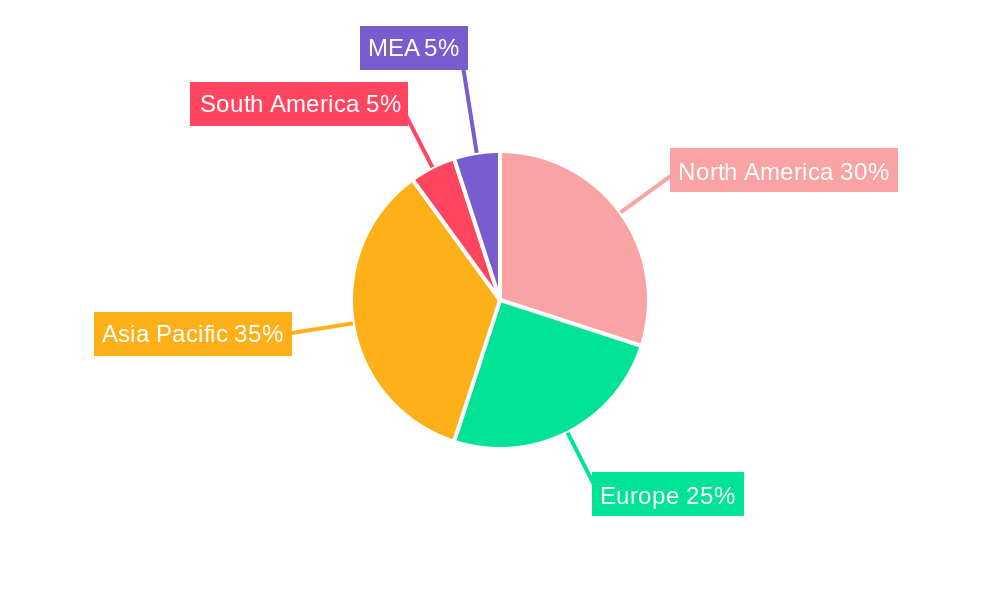
Geographical growth is uneven, with North America and Europe expected to maintain significant market shares due to established infrastructure and technological advancements. However, the Asia-Pacific region is poised for substantial growth, driven by rapid industrialization and urbanization. This growth will be influenced by government initiatives promoting infrastructure development and renewable energy adoption. While challenges such as high initial investment costs and the need for specialized expertise exist, the long-term benefits of enhanced power reliability and efficiency outweigh these constraints, fostering market expansion. Competitive dynamics are strong, with key players like TGOOD Global Ltd, ABB Ltd, Eaton Corporation Inc, and Siemens AG continuously innovating to meet evolving market demands. The market's trajectory suggests a promising future, marked by technological advancements and increased adoption across diverse industries and geographic regions.
E-House Market: A Comprehensive Report (2019-2033)
This in-depth report provides a comprehensive analysis of the E-House market, encompassing market dynamics, growth trends, regional performance, key players, and future outlook. With a study period spanning 2019-2033, a base year of 2025, and a forecast period of 2025-2033, this report offers invaluable insights for industry professionals, investors, and strategic decision-makers. The report meticulously analyzes the parent market of electrical power distribution equipment and the child market of prefabricated electrical substations, providing a granular understanding of market segmentation by Application (Utilities, Industrial) and Type (Fixed E-House, Mobile Substation). Market size is presented in Million units.
E-House Market Dynamics & Structure
The E-House market is characterized by moderate concentration, with key players such as TGOOD Global Ltd, ABB Ltd, Eaton Corporation Inc, LS Electric Co Ltd, Siemens AG, Schneider Electric SE, Powell Industries Inc, Aktif Group, Electroinnova S L, and Unit Electrical Engineering Ltd competing for market share. Market concentration is estimated at xx% in 2025.
- Technological Innovation: Significant advancements in power electronics, automation, and digitalization are driving market growth. The integration of smart grid technologies and IoT solutions is a key driver.
- Regulatory Landscape: Stringent environmental regulations and safety standards influence product design and manufacturing processes. Government initiatives promoting renewable energy adoption also play a significant role.
- Competitive Substitutes: Traditional substation designs pose a competitive threat, but the advantages of E-Houses in terms of cost-effectiveness, modularity, and ease of deployment are mitigating this challenge.
- End-User Demographics: The utilities sector remains the largest end-user segment, followed by industrial applications. Growth in renewable energy projects and industrial automation is boosting demand.
- M&A Activity: The past five years have witnessed xx M&A deals in the E-House market, primarily focused on consolidating market share and accessing new technologies. This activity is expected to continue, driven by a desire for greater scale and technological capabilities.
E-House Market Growth Trends & Insights
The global E-House market experienced a CAGR of xx% during the historical period (2019-2024) and is projected to maintain a CAGR of xx% during the forecast period (2025-2033). Market size reached xx Million units in 2024 and is estimated at xx Million units in 2025. This growth is fueled by several factors, including:
The increasing adoption of renewable energy sources is a key driver, particularly in developing economies experiencing rapid industrialization. The shift towards decentralized power generation and microgrids is boosting demand for modular and easily deployable solutions like E-Houses. Furthermore, the growing need for reliable and efficient power distribution in urban areas is supporting market growth. Technological advancements, such as the integration of smart grid technologies and IoT solutions, are enhancing the functionality and appeal of E-Houses, furthering market expansion. Consumer preference for eco-friendly solutions also contributes to the market's growth.
Dominant Regions, Countries, or Segments in E-House Market
North America currently holds the largest market share, driven by robust infrastructure development and a strong focus on renewable energy integration. Within this region, the US is the leading market, owing to its extensive power grid and significant investments in infrastructure modernization.
- Key Drivers in North America: Strong governmental support for renewable energy initiatives, coupled with the need for reliable power distribution infrastructure, is propelling growth.
- Europe: The European market is also exhibiting significant growth, driven by stringent environmental regulations and policies promoting sustainable energy solutions.
- Asia-Pacific: The Asia-Pacific region is experiencing rapid growth due to ongoing industrialization, urbanization, and increasing electricity demand. China and India are key markets in this region.
- Industrial Applications: The industrial segment is projected to exhibit robust growth, driven by the increasing demand for reliable power supply in industrial facilities and manufacturing plants. The rise of automation and Industry 4.0 initiatives contributes significantly to this trend.
- Fixed E-House Segment: The fixed E-House segment holds the largest market share, owing to its wider applications across utilities and industrial sectors, compared to mobile substations.
E-House Market Product Landscape
E-House products are characterized by varying levels of automation, power capacity, and customization options. Key innovations focus on improving energy efficiency, enhancing safety features, and integrating advanced monitoring and control systems. Manufacturers are increasingly incorporating smart grid technologies and IoT solutions to optimize energy distribution and improve operational efficiency. Unique selling propositions often revolve around modularity, ease of installation, and reduced commissioning time. Technological advancements in power electronics and automation are driving the development of more compact, efficient, and intelligent E-Houses.
Key Drivers, Barriers & Challenges in E-House Market
Key Drivers: The increasing demand for reliable and efficient power distribution, coupled with the growing adoption of renewable energy sources and smart grid technologies, are the primary drivers of E-House market growth. Government initiatives promoting sustainable energy solutions and infrastructure development also play a significant role.
Key Challenges: Supply chain disruptions, particularly concerning the availability of key components, pose a significant challenge. Stringent regulatory requirements and safety standards can increase manufacturing costs and lead times. Intense competition among established players and new entrants adds pressure on pricing and profitability. Fluctuations in raw material prices also impact market dynamics.
Emerging Opportunities in E-House Market
Emerging opportunities lie in expanding into untapped markets, particularly in developing economies with growing electricity demand. The integration of advanced technologies, such as AI and machine learning, offers opportunities for improving E-House efficiency and smart grid integration. Further innovations in modular design and customization options will cater to the diverse needs of end-users. The development of specialized E-Houses for specific applications, such as data centers or renewable energy installations, represents significant growth potential.
Growth Accelerators in the E-House Market Industry
Technological breakthroughs in power electronics and energy storage are key growth accelerators. Strategic partnerships between E-House manufacturers and renewable energy companies are driving market expansion. Government incentives and subsidies for sustainable energy projects are boosting demand. Market expansion into new geographical regions, particularly developing economies, is expected to drive significant growth in the coming years.
Key Players Shaping the E-House Market Market
- TGOOD Global Ltd
- ABB Ltd
- Eaton Corporation Inc
- LS Electric Co Ltd
- Siemens AG
- Schneider Electric SE
- Powell Industries Inc
- Aktif Group
- Electroinnova S L
- Unit Electrical Engineering Ltd
Notable Milestones in E-House Market Sector
- 2022-Q4: Launch of a new generation of smart E-Houses by Siemens AG, integrating advanced monitoring and control systems.
- 2023-Q1: ABB Ltd announces a strategic partnership with a major renewable energy developer, focusing on E-House deployment for solar farms.
- 2023-Q2: Eaton Corporation Inc acquires a smaller E-House manufacturer, expanding its product portfolio and market reach. (Further milestones to be added as available)
In-Depth E-House Market Market Outlook
The E-House market is poised for substantial growth over the forecast period, driven by increasing demand for reliable power distribution, the rise of renewable energy, and the continued adoption of smart grid technologies. Strategic investments in research and development, coupled with innovative product development and expansion into new markets, will be crucial for companies to capture significant market share. The focus on sustainability and environmental compliance will also continue to shape market dynamics, driving the demand for energy-efficient and environmentally friendly E-House solutions.
E-House Market Segmentation
-
1. Type
- 1.1. Fixed E-House
- 1.2. Mobile Substation
-
2. Application
- 2.1. Utilities
-
2.2. Industrial
- 2.2.1. Oil & Gas
- 2.2.2. Mining & Minerals
- 2.2.3. Chemicals
- 2.2.4. Other Industrial Applications
E-House Market Segmentation By Geography
-
1. North America
- 1.1. United States
- 1.2. Canada
-
2. Europe
- 2.1. Germany
- 2.2. United Kingdom
- 2.3. France
- 2.4. Italy
- 2.5. Rest of Europe
-
3. Asia Pacific
- 3.1. India
- 3.2. China
- 3.3. Japan
- 3.4. Rest of Asia Pacific
-
4. Rest of the World
- 4.1. Latin America
- 4.2. Middle East and Africa
E-House Market REPORT HIGHLIGHTS
| Aspects | Details |
|---|---|
| Study Period | 2019-2033 |
| Base Year | 2024 |
| Estimated Year | 2025 |
| Forecast Period | 2025-2033 |
| Historical Period | 2019-2024 |
| Growth Rate | CAGR of 6.83% from 2019-2033 |
| Segmentation |
|
Table of Contents
- 1. Introduction
- 1.1. Research Scope
- 1.2. Market Segmentation
- 1.3. Research Methodology
- 1.4. Definitions and Assumptions
- 2. Executive Summary
- 2.1. Introduction
- 3. Market Dynamics
- 3.1. Introduction
- 3.2. Market Drivers
- 3.2.1. ; Adoption in the Replacement of SF6 to Lower Environmental Impact; Digitalization of E-House
- 3.3. Market Restrains
- 3.3.1. ; Concerns Regarding the Impact of Covid-19 Due to Industry Shutdown
- 3.4. Market Trends
- 3.4.1. Upstream Sector in Oil and Gas to Witness Significant Share
- 4. Market Factor Analysis
- 4.1. Porters Five Forces
- 4.2. Supply/Value Chain
- 4.3. PESTEL analysis
- 4.4. Market Entropy
- 4.5. Patent/Trademark Analysis
- 5. Global E-House Market Analysis, Insights and Forecast, 2019-2031
- 5.1. Market Analysis, Insights and Forecast - by Type
- 5.1.1. Fixed E-House
- 5.1.2. Mobile Substation
- 5.2. Market Analysis, Insights and Forecast - by Application
- 5.2.1. Utilities
- 5.2.2. Industrial
- 5.2.2.1. Oil & Gas
- 5.2.2.2. Mining & Minerals
- 5.2.2.3. Chemicals
- 5.2.2.4. Other Industrial Applications
- 5.3. Market Analysis, Insights and Forecast - by Region
- 5.3.1. North America
- 5.3.2. Europe
- 5.3.3. Asia Pacific
- 5.3.4. Rest of the World
- 5.1. Market Analysis, Insights and Forecast - by Type
- 6. North America E-House Market Analysis, Insights and Forecast, 2019-2031
- 6.1. Market Analysis, Insights and Forecast - by Type
- 6.1.1. Fixed E-House
- 6.1.2. Mobile Substation
- 6.2. Market Analysis, Insights and Forecast - by Application
- 6.2.1. Utilities
- 6.2.2. Industrial
- 6.2.2.1. Oil & Gas
- 6.2.2.2. Mining & Minerals
- 6.2.2.3. Chemicals
- 6.2.2.4. Other Industrial Applications
- 6.1. Market Analysis, Insights and Forecast - by Type
- 7. Europe E-House Market Analysis, Insights and Forecast, 2019-2031
- 7.1. Market Analysis, Insights and Forecast - by Type
- 7.1.1. Fixed E-House
- 7.1.2. Mobile Substation
- 7.2. Market Analysis, Insights and Forecast - by Application
- 7.2.1. Utilities
- 7.2.2. Industrial
- 7.2.2.1. Oil & Gas
- 7.2.2.2. Mining & Minerals
- 7.2.2.3. Chemicals
- 7.2.2.4. Other Industrial Applications
- 7.1. Market Analysis, Insights and Forecast - by Type
- 8. Asia Pacific E-House Market Analysis, Insights and Forecast, 2019-2031
- 8.1. Market Analysis, Insights and Forecast - by Type
- 8.1.1. Fixed E-House
- 8.1.2. Mobile Substation
- 8.2. Market Analysis, Insights and Forecast - by Application
- 8.2.1. Utilities
- 8.2.2. Industrial
- 8.2.2.1. Oil & Gas
- 8.2.2.2. Mining & Minerals
- 8.2.2.3. Chemicals
- 8.2.2.4. Other Industrial Applications
- 8.1. Market Analysis, Insights and Forecast - by Type
- 9. Rest of the World E-House Market Analysis, Insights and Forecast, 2019-2031
- 9.1. Market Analysis, Insights and Forecast - by Type
- 9.1.1. Fixed E-House
- 9.1.2. Mobile Substation
- 9.2. Market Analysis, Insights and Forecast - by Application
- 9.2.1. Utilities
- 9.2.2. Industrial
- 9.2.2.1. Oil & Gas
- 9.2.2.2. Mining & Minerals
- 9.2.2.3. Chemicals
- 9.2.2.4. Other Industrial Applications
- 9.1. Market Analysis, Insights and Forecast - by Type
- 10. North America E-House Market Analysis, Insights and Forecast, 2019-2031
- 10.1. Market Analysis, Insights and Forecast - By Country/Sub-region
- 10.1.1. undefined
- 11. Europe E-House Market Analysis, Insights and Forecast, 2019-2031
- 11.1. Market Analysis, Insights and Forecast - By Country/Sub-region
- 11.1.1. undefined
- 12. Asia Pacific E-House Market Analysis, Insights and Forecast, 2019-2031
- 12.1. Market Analysis, Insights and Forecast - By Country/Sub-region
- 12.1.1. undefined
- 13. South America E-House Market Analysis, Insights and Forecast, 2019-2031
- 13.1. Market Analysis, Insights and Forecast - By Country/Sub-region
- 13.1.1. undefined
- 14. North America E-House Market Analysis, Insights and Forecast, 2019-2031
- 14.1. Market Analysis, Insights and Forecast - By Country/Sub-region
- 14.1.1. undefined
- 15. MEA E-House Market Analysis, Insights and Forecast, 2019-2031
- 15.1. Market Analysis, Insights and Forecast - By Country/Sub-region
- 15.1.1. undefined
- 16. Competitive Analysis
- 16.1. Global Market Share Analysis 2024
- 16.2. Company Profiles
- 16.2.1 TGOOD Global Ltd
- 16.2.1.1. Overview
- 16.2.1.2. Products
- 16.2.1.3. SWOT Analysis
- 16.2.1.4. Recent Developments
- 16.2.1.5. Financials (Based on Availability)
- 16.2.2 ABB Ltd
- 16.2.2.1. Overview
- 16.2.2.2. Products
- 16.2.2.3. SWOT Analysis
- 16.2.2.4. Recent Developments
- 16.2.2.5. Financials (Based on Availability)
- 16.2.3 Eaton Corporation Inc
- 16.2.3.1. Overview
- 16.2.3.2. Products
- 16.2.3.3. SWOT Analysis
- 16.2.3.4. Recent Developments
- 16.2.3.5. Financials (Based on Availability)
- 16.2.4 LS Electric Co Ltd
- 16.2.4.1. Overview
- 16.2.4.2. Products
- 16.2.4.3. SWOT Analysis
- 16.2.4.4. Recent Developments
- 16.2.4.5. Financials (Based on Availability)
- 16.2.5 Siemens AG
- 16.2.5.1. Overview
- 16.2.5.2. Products
- 16.2.5.3. SWOT Analysis
- 16.2.5.4. Recent Developments
- 16.2.5.5. Financials (Based on Availability)
- 16.2.6 Schneider Electric SE
- 16.2.6.1. Overview
- 16.2.6.2. Products
- 16.2.6.3. SWOT Analysis
- 16.2.6.4. Recent Developments
- 16.2.6.5. Financials (Based on Availability)
- 16.2.7 Powell Industries Inc
- 16.2.7.1. Overview
- 16.2.7.2. Products
- 16.2.7.3. SWOT Analysis
- 16.2.7.4. Recent Developments
- 16.2.7.5. Financials (Based on Availability)
- 16.2.8 Aktif Group
- 16.2.8.1. Overview
- 16.2.8.2. Products
- 16.2.8.3. SWOT Analysis
- 16.2.8.4. Recent Developments
- 16.2.8.5. Financials (Based on Availability)
- 16.2.9 Electroinnova S L
- 16.2.9.1. Overview
- 16.2.9.2. Products
- 16.2.9.3. SWOT Analysis
- 16.2.9.4. Recent Developments
- 16.2.9.5. Financials (Based on Availability)
- 16.2.10 Unit Electrical Engineering Ltd
- 16.2.10.1. Overview
- 16.2.10.2. Products
- 16.2.10.3. SWOT Analysis
- 16.2.10.4. Recent Developments
- 16.2.10.5. Financials (Based on Availability)
- 16.2.1 TGOOD Global Ltd
List of Figures
- Figure 1: Global E-House Market Revenue Breakdown (Million, %) by Region 2024 & 2032
- Figure 2: Global E-House Market Volume Breakdown (K Unit, %) by Region 2024 & 2032
- Figure 3: North America E-House Market Revenue (Million), by Country 2024 & 2032
- Figure 4: North America E-House Market Volume (K Unit), by Country 2024 & 2032
- Figure 5: North America E-House Market Revenue Share (%), by Country 2024 & 2032
- Figure 6: North America E-House Market Volume Share (%), by Country 2024 & 2032
- Figure 7: Europe E-House Market Revenue (Million), by Country 2024 & 2032
- Figure 8: Europe E-House Market Volume (K Unit), by Country 2024 & 2032
- Figure 9: Europe E-House Market Revenue Share (%), by Country 2024 & 2032
- Figure 10: Europe E-House Market Volume Share (%), by Country 2024 & 2032
- Figure 11: Asia Pacific E-House Market Revenue (Million), by Country 2024 & 2032
- Figure 12: Asia Pacific E-House Market Volume (K Unit), by Country 2024 & 2032
- Figure 13: Asia Pacific E-House Market Revenue Share (%), by Country 2024 & 2032
- Figure 14: Asia Pacific E-House Market Volume Share (%), by Country 2024 & 2032
- Figure 15: South America E-House Market Revenue (Million), by Country 2024 & 2032
- Figure 16: South America E-House Market Volume (K Unit), by Country 2024 & 2032
- Figure 17: South America E-House Market Revenue Share (%), by Country 2024 & 2032
- Figure 18: South America E-House Market Volume Share (%), by Country 2024 & 2032
- Figure 19: North America E-House Market Revenue (Million), by Country 2024 & 2032
- Figure 20: North America E-House Market Volume (K Unit), by Country 2024 & 2032
- Figure 21: North America E-House Market Revenue Share (%), by Country 2024 & 2032
- Figure 22: North America E-House Market Volume Share (%), by Country 2024 & 2032
- Figure 23: MEA E-House Market Revenue (Million), by Country 2024 & 2032
- Figure 24: MEA E-House Market Volume (K Unit), by Country 2024 & 2032
- Figure 25: MEA E-House Market Revenue Share (%), by Country 2024 & 2032
- Figure 26: MEA E-House Market Volume Share (%), by Country 2024 & 2032
- Figure 27: North America E-House Market Revenue (Million), by Type 2024 & 2032
- Figure 28: North America E-House Market Volume (K Unit), by Type 2024 & 2032
- Figure 29: North America E-House Market Revenue Share (%), by Type 2024 & 2032
- Figure 30: North America E-House Market Volume Share (%), by Type 2024 & 2032
- Figure 31: North America E-House Market Revenue (Million), by Application 2024 & 2032
- Figure 32: North America E-House Market Volume (K Unit), by Application 2024 & 2032
- Figure 33: North America E-House Market Revenue Share (%), by Application 2024 & 2032
- Figure 34: North America E-House Market Volume Share (%), by Application 2024 & 2032
- Figure 35: North America E-House Market Revenue (Million), by Country 2024 & 2032
- Figure 36: North America E-House Market Volume (K Unit), by Country 2024 & 2032
- Figure 37: North America E-House Market Revenue Share (%), by Country 2024 & 2032
- Figure 38: North America E-House Market Volume Share (%), by Country 2024 & 2032
- Figure 39: Europe E-House Market Revenue (Million), by Type 2024 & 2032
- Figure 40: Europe E-House Market Volume (K Unit), by Type 2024 & 2032
- Figure 41: Europe E-House Market Revenue Share (%), by Type 2024 & 2032
- Figure 42: Europe E-House Market Volume Share (%), by Type 2024 & 2032
- Figure 43: Europe E-House Market Revenue (Million), by Application 2024 & 2032
- Figure 44: Europe E-House Market Volume (K Unit), by Application 2024 & 2032
- Figure 45: Europe E-House Market Revenue Share (%), by Application 2024 & 2032
- Figure 46: Europe E-House Market Volume Share (%), by Application 2024 & 2032
- Figure 47: Europe E-House Market Revenue (Million), by Country 2024 & 2032
- Figure 48: Europe E-House Market Volume (K Unit), by Country 2024 & 2032
- Figure 49: Europe E-House Market Revenue Share (%), by Country 2024 & 2032
- Figure 50: Europe E-House Market Volume Share (%), by Country 2024 & 2032
- Figure 51: Asia Pacific E-House Market Revenue (Million), by Type 2024 & 2032
- Figure 52: Asia Pacific E-House Market Volume (K Unit), by Type 2024 & 2032
- Figure 53: Asia Pacific E-House Market Revenue Share (%), by Type 2024 & 2032
- Figure 54: Asia Pacific E-House Market Volume Share (%), by Type 2024 & 2032
- Figure 55: Asia Pacific E-House Market Revenue (Million), by Application 2024 & 2032
- Figure 56: Asia Pacific E-House Market Volume (K Unit), by Application 2024 & 2032
- Figure 57: Asia Pacific E-House Market Revenue Share (%), by Application 2024 & 2032
- Figure 58: Asia Pacific E-House Market Volume Share (%), by Application 2024 & 2032
- Figure 59: Asia Pacific E-House Market Revenue (Million), by Country 2024 & 2032
- Figure 60: Asia Pacific E-House Market Volume (K Unit), by Country 2024 & 2032
- Figure 61: Asia Pacific E-House Market Revenue Share (%), by Country 2024 & 2032
- Figure 62: Asia Pacific E-House Market Volume Share (%), by Country 2024 & 2032
- Figure 63: Rest of the World E-House Market Revenue (Million), by Type 2024 & 2032
- Figure 64: Rest of the World E-House Market Volume (K Unit), by Type 2024 & 2032
- Figure 65: Rest of the World E-House Market Revenue Share (%), by Type 2024 & 2032
- Figure 66: Rest of the World E-House Market Volume Share (%), by Type 2024 & 2032
- Figure 67: Rest of the World E-House Market Revenue (Million), by Application 2024 & 2032
- Figure 68: Rest of the World E-House Market Volume (K Unit), by Application 2024 & 2032
- Figure 69: Rest of the World E-House Market Revenue Share (%), by Application 2024 & 2032
- Figure 70: Rest of the World E-House Market Volume Share (%), by Application 2024 & 2032
- Figure 71: Rest of the World E-House Market Revenue (Million), by Country 2024 & 2032
- Figure 72: Rest of the World E-House Market Volume (K Unit), by Country 2024 & 2032
- Figure 73: Rest of the World E-House Market Revenue Share (%), by Country 2024 & 2032
- Figure 74: Rest of the World E-House Market Volume Share (%), by Country 2024 & 2032
List of Tables
- Table 1: Global E-House Market Revenue Million Forecast, by Region 2019 & 2032
- Table 2: Global E-House Market Volume K Unit Forecast, by Region 2019 & 2032
- Table 3: Global E-House Market Revenue Million Forecast, by Type 2019 & 2032
- Table 4: Global E-House Market Volume K Unit Forecast, by Type 2019 & 2032
- Table 5: Global E-House Market Revenue Million Forecast, by Application 2019 & 2032
- Table 6: Global E-House Market Volume K Unit Forecast, by Application 2019 & 2032
- Table 7: Global E-House Market Revenue Million Forecast, by Region 2019 & 2032
- Table 8: Global E-House Market Volume K Unit Forecast, by Region 2019 & 2032
- Table 9: Global E-House Market Revenue Million Forecast, by Country 2019 & 2032
- Table 10: Global E-House Market Volume K Unit Forecast, by Country 2019 & 2032
- Table 11: Global E-House Market Revenue Million Forecast, by Country 2019 & 2032
- Table 12: Global E-House Market Volume K Unit Forecast, by Country 2019 & 2032
- Table 13: Global E-House Market Revenue Million Forecast, by Country 2019 & 2032
- Table 14: Global E-House Market Volume K Unit Forecast, by Country 2019 & 2032
- Table 15: Global E-House Market Revenue Million Forecast, by Country 2019 & 2032
- Table 16: Global E-House Market Volume K Unit Forecast, by Country 2019 & 2032
- Table 17: Global E-House Market Revenue Million Forecast, by Country 2019 & 2032
- Table 18: Global E-House Market Volume K Unit Forecast, by Country 2019 & 2032
- Table 19: Global E-House Market Revenue Million Forecast, by Country 2019 & 2032
- Table 20: Global E-House Market Volume K Unit Forecast, by Country 2019 & 2032
- Table 21: Global E-House Market Revenue Million Forecast, by Type 2019 & 2032
- Table 22: Global E-House Market Volume K Unit Forecast, by Type 2019 & 2032
- Table 23: Global E-House Market Revenue Million Forecast, by Application 2019 & 2032
- Table 24: Global E-House Market Volume K Unit Forecast, by Application 2019 & 2032
- Table 25: Global E-House Market Revenue Million Forecast, by Country 2019 & 2032
- Table 26: Global E-House Market Volume K Unit Forecast, by Country 2019 & 2032
- Table 27: United States E-House Market Revenue (Million) Forecast, by Application 2019 & 2032
- Table 28: United States E-House Market Volume (K Unit) Forecast, by Application 2019 & 2032
- Table 29: Canada E-House Market Revenue (Million) Forecast, by Application 2019 & 2032
- Table 30: Canada E-House Market Volume (K Unit) Forecast, by Application 2019 & 2032
- Table 31: Global E-House Market Revenue Million Forecast, by Type 2019 & 2032
- Table 32: Global E-House Market Volume K Unit Forecast, by Type 2019 & 2032
- Table 33: Global E-House Market Revenue Million Forecast, by Application 2019 & 2032
- Table 34: Global E-House Market Volume K Unit Forecast, by Application 2019 & 2032
- Table 35: Global E-House Market Revenue Million Forecast, by Country 2019 & 2032
- Table 36: Global E-House Market Volume K Unit Forecast, by Country 2019 & 2032
- Table 37: Germany E-House Market Revenue (Million) Forecast, by Application 2019 & 2032
- Table 38: Germany E-House Market Volume (K Unit) Forecast, by Application 2019 & 2032
- Table 39: United Kingdom E-House Market Revenue (Million) Forecast, by Application 2019 & 2032
- Table 40: United Kingdom E-House Market Volume (K Unit) Forecast, by Application 2019 & 2032
- Table 41: France E-House Market Revenue (Million) Forecast, by Application 2019 & 2032
- Table 42: France E-House Market Volume (K Unit) Forecast, by Application 2019 & 2032
- Table 43: Italy E-House Market Revenue (Million) Forecast, by Application 2019 & 2032
- Table 44: Italy E-House Market Volume (K Unit) Forecast, by Application 2019 & 2032
- Table 45: Rest of Europe E-House Market Revenue (Million) Forecast, by Application 2019 & 2032
- Table 46: Rest of Europe E-House Market Volume (K Unit) Forecast, by Application 2019 & 2032
- Table 47: Global E-House Market Revenue Million Forecast, by Type 2019 & 2032
- Table 48: Global E-House Market Volume K Unit Forecast, by Type 2019 & 2032
- Table 49: Global E-House Market Revenue Million Forecast, by Application 2019 & 2032
- Table 50: Global E-House Market Volume K Unit Forecast, by Application 2019 & 2032
- Table 51: Global E-House Market Revenue Million Forecast, by Country 2019 & 2032
- Table 52: Global E-House Market Volume K Unit Forecast, by Country 2019 & 2032
- Table 53: India E-House Market Revenue (Million) Forecast, by Application 2019 & 2032
- Table 54: India E-House Market Volume (K Unit) Forecast, by Application 2019 & 2032
- Table 55: China E-House Market Revenue (Million) Forecast, by Application 2019 & 2032
- Table 56: China E-House Market Volume (K Unit) Forecast, by Application 2019 & 2032
- Table 57: Japan E-House Market Revenue (Million) Forecast, by Application 2019 & 2032
- Table 58: Japan E-House Market Volume (K Unit) Forecast, by Application 2019 & 2032
- Table 59: Rest of Asia Pacific E-House Market Revenue (Million) Forecast, by Application 2019 & 2032
- Table 60: Rest of Asia Pacific E-House Market Volume (K Unit) Forecast, by Application 2019 & 2032
- Table 61: Global E-House Market Revenue Million Forecast, by Type 2019 & 2032
- Table 62: Global E-House Market Volume K Unit Forecast, by Type 2019 & 2032
- Table 63: Global E-House Market Revenue Million Forecast, by Application 2019 & 2032
- Table 64: Global E-House Market Volume K Unit Forecast, by Application 2019 & 2032
- Table 65: Global E-House Market Revenue Million Forecast, by Country 2019 & 2032
- Table 66: Global E-House Market Volume K Unit Forecast, by Country 2019 & 2032
- Table 67: Latin America E-House Market Revenue (Million) Forecast, by Application 2019 & 2032
- Table 68: Latin America E-House Market Volume (K Unit) Forecast, by Application 2019 & 2032
- Table 69: Middle East and Africa E-House Market Revenue (Million) Forecast, by Application 2019 & 2032
- Table 70: Middle East and Africa E-House Market Volume (K Unit) Forecast, by Application 2019 & 2032
Frequently Asked Questions
1. What is the projected Compound Annual Growth Rate (CAGR) of the E-House Market?
The projected CAGR is approximately 6.83%.
2. Which companies are prominent players in the E-House Market?
Key companies in the market include TGOOD Global Ltd, ABB Ltd, Eaton Corporation Inc, LS Electric Co Ltd, Siemens AG, Schneider Electric SE, Powell Industries Inc, Aktif Group, Electroinnova S L, Unit Electrical Engineering Ltd.
3. What are the main segments of the E-House Market?
The market segments include Type, Application.
4. Can you provide details about the market size?
The market size is estimated to be USD XX Million as of 2022.
5. What are some drivers contributing to market growth?
; Adoption in the Replacement of SF6 to Lower Environmental Impact; Digitalization of E-House.
6. What are the notable trends driving market growth?
Upstream Sector in Oil and Gas to Witness Significant Share.
7. Are there any restraints impacting market growth?
; Concerns Regarding the Impact of Covid-19 Due to Industry Shutdown.
8. Can you provide examples of recent developments in the market?
N/A
9. What pricing options are available for accessing the report?
Pricing options include single-user, multi-user, and enterprise licenses priced at USD 4750, USD 5250, and USD 8750 respectively.
10. Is the market size provided in terms of value or volume?
The market size is provided in terms of value, measured in Million and volume, measured in K Unit.
11. Are there any specific market keywords associated with the report?
Yes, the market keyword associated with the report is "E-House Market," which aids in identifying and referencing the specific market segment covered.
12. How do I determine which pricing option suits my needs best?
The pricing options vary based on user requirements and access needs. Individual users may opt for single-user licenses, while businesses requiring broader access may choose multi-user or enterprise licenses for cost-effective access to the report.
13. Are there any additional resources or data provided in the E-House Market report?
While the report offers comprehensive insights, it's advisable to review the specific contents or supplementary materials provided to ascertain if additional resources or data are available.
14. How can I stay updated on further developments or reports in the E-House Market?
To stay informed about further developments, trends, and reports in the E-House Market, consider subscribing to industry newsletters, following relevant companies and organizations, or regularly checking reputable industry news sources and publications.
Methodology
Step 1 - Identification of Relevant Samples Size from Population Database


Step 2 - Approaches for Defining Global Market Size (Value, Volume* & Price*)

Note*: In applicable scenarios
Step 3 - Data Sources
Primary Research
- Web Analytics
- Survey Reports
- Research Institute
- Latest Research Reports
- Opinion Leaders
Secondary Research
- Annual Reports
- White Paper
- Latest Press Release
- Industry Association
- Paid Database
- Investor Presentations

Step 4 - Data Triangulation
Involves using different sources of information in order to increase the validity of a study
These sources are likely to be stakeholders in a program - participants, other researchers, program staff, other community members, and so on.
Then we put all data in single framework & apply various statistical tools to find out the dynamic on the market.
During the analysis stage, feedback from the stakeholder groups would be compared to determine areas of agreement as well as areas of divergence
