

Key Insights
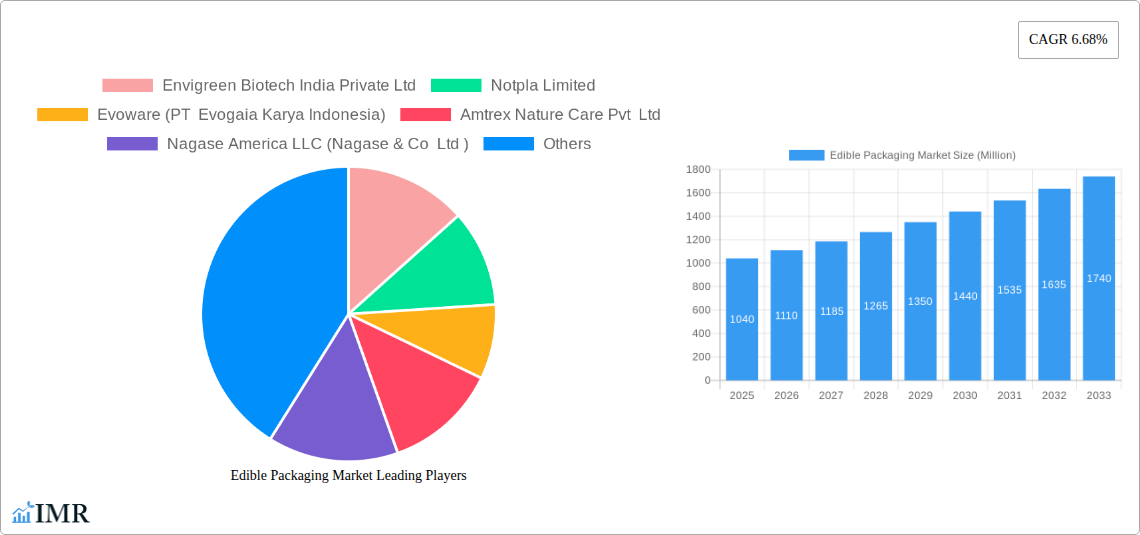
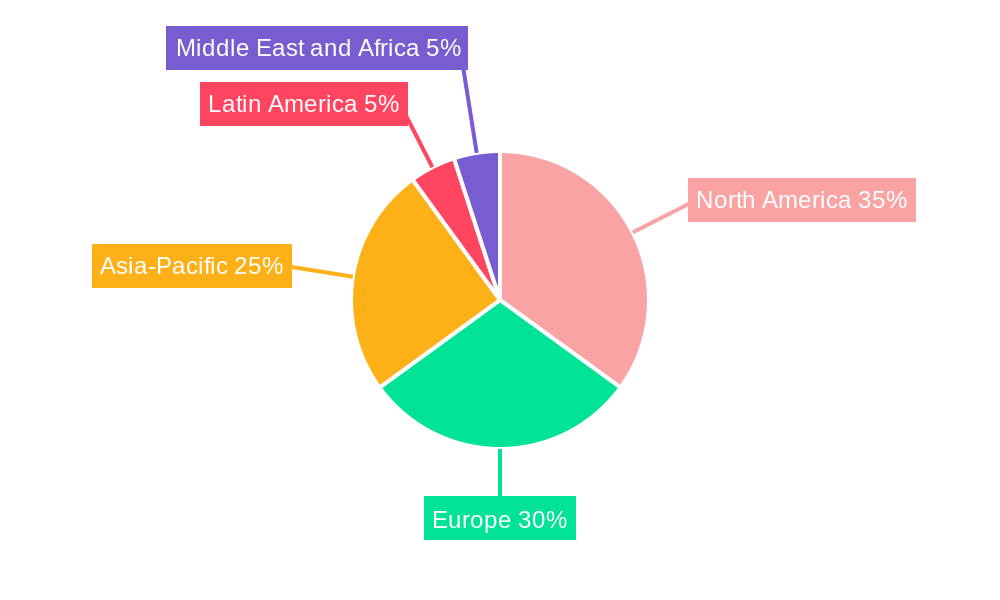
The global edible packaging market, valued at $1.04 billion in 2025, is poised for robust growth, exhibiting a Compound Annual Growth Rate (CAGR) of 6.68% from 2025 to 2033. This expansion is driven by several key factors. The increasing consumer demand for sustainable and eco-friendly packaging solutions is a primary catalyst. Concerns about plastic pollution and its environmental impact are fueling the adoption of biodegradable and compostable edible films and coatings. Furthermore, the growing food and beverage industry, particularly the demand for convenient and innovative food products, is creating a significant market opportunity. The rising popularity of ready-to-eat meals and single-serving portions further contributes to the market's growth trajectory. Different segments within the market are experiencing varying growth rates, with the food and beverage sector currently dominating, followed by pharmaceuticals, which is witnessing increasing adoption of edible coatings for improved product shelf life and protection. Regional variations in growth are expected, with North America and Europe leading the market due to high consumer awareness and stringent environmental regulations. However, Asia-Pacific is anticipated to show significant growth potential in the coming years, driven by rising disposable incomes and increasing adoption of innovative packaging solutions.
The market segmentation offers diverse avenues for growth. Plant-based sources are gaining traction over animal-based ones due to consumer preferences for vegan and vegetarian products and growing awareness of animal welfare. Raw materials such as proteins, polysaccharides, and lipids offer unique functional properties in edible films and coatings, influencing their application across various industries. The competitive landscape is characterized by a mix of established players and emerging startups, all striving to innovate and capture market share through product diversification and strategic partnerships. Significant investment in research and development is being undertaken to explore new materials and improve the performance characteristics of edible packaging, including enhanced barrier properties and improved shelf-life extension capabilities. Challenges remain, however, including cost-competitiveness with conventional packaging and ensuring the scalability of production to meet growing demand.
Edible Packaging Market: A Comprehensive Report (2019-2033)
This comprehensive report provides an in-depth analysis of the Edible Packaging Market, encompassing market dynamics, growth trends, regional segmentation, product landscape, key players, and future outlook. The study period covers 2019-2033, with 2025 as the base and estimated year. The report segments the market by end-user industry (food, beverage, pharmaceutical), region (North America, Europe, Asia-Pacific, Latin America, Middle East & Africa), source (plant, animal), and raw material (protein, polysaccharides, lipids, other). This detailed analysis will equip stakeholders with actionable insights to navigate this rapidly evolving market. Market values are presented in million units.
Edible Packaging Market Market Dynamics & Structure
The edible packaging market is characterized by moderate concentration, with several key players vying for market share. Technological innovation, driven by increasing consumer demand for sustainable and eco-friendly solutions, is a primary growth driver. Stringent regulatory frameworks governing food safety and material composition pose both challenges and opportunities. Competitive substitutes, such as traditional packaging materials, continue to exert pressure, necessitating continuous innovation. The market is witnessing a shift towards plant-based sources and a rise in M&A activity as companies seek to expand their product portfolios and market reach. For example, the number of M&A deals in the sector between 2020 and 2024 reached approximately xx deals, resulting in a xx% increase in market concentration.
- Market Concentration: Moderately concentrated, with top 5 players holding approximately xx% market share in 2024.
- Technological Innovation: Focus on biodegradability, compostability, and functional properties (e.g., flavor, texture enhancement).
- Regulatory Landscape: Stringent regulations regarding food safety and material approvals are driving innovation.
- Competitive Landscape: Traditional packaging materials (plastics, paper) remain significant competitors.
- End-User Demographics: Growing awareness of environmental issues and rising demand for convenient and sustainable packaging are key drivers.
- M&A Activity: Increased M&A activity observed in recent years, indicating market consolidation and expansion efforts. xx% of companies involved in M&A are focusing on improving their sustainability portfolio.
Edible Packaging Market Growth Trends & Insights
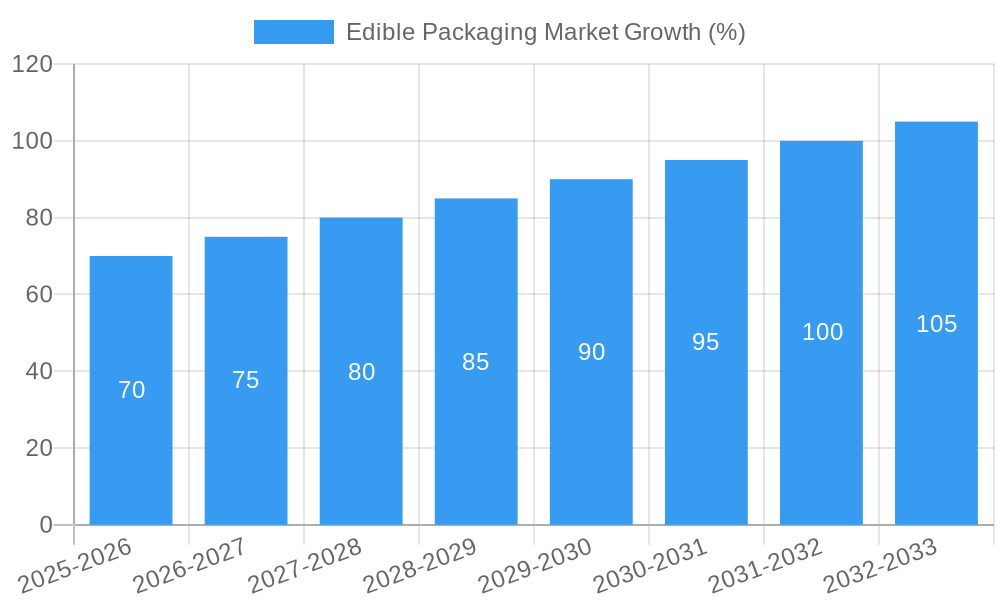
The edible packaging market has witnessed significant growth, with a CAGR of xx% during the historical period (2019-2024). The market size reached xx million units in 2024 and is projected to reach xx million units by 2033, exhibiting a CAGR of xx% during the forecast period (2025-2033). This growth is fueled by several factors, including increasing consumer preference for sustainable packaging options, rising environmental awareness, and advancements in material science leading to improved product functionality and shelf life. Technological disruptions, such as the development of new bio-based materials and innovative processing techniques, are further accelerating market expansion. Consumer behavior is shifting towards eco-conscious choices, increasing the adoption rate of edible packaging, particularly in the food and beverage sectors.
Dominant Regions, Countries, or Segments in Edible Packaging Market
North America currently holds the largest market share, driven by high consumer awareness of environmental issues and stringent regulations promoting sustainable packaging. Within North America, Canada specifically is showing notable growth in edible packaging due to supportive government initiatives, contributing approximately xx million units to the market in 2024. Europe, particularly Italy, is also a significant market, exhibiting strong growth potential due to increasing demand for innovative food packaging solutions, contributing approximately xx million units in 2024. The Asia-Pacific region, notably Australia and New Zealand, is experiencing rapid growth, fueled by rising disposable incomes and increasing awareness of environmental concerns. Plant-based sources dominate the market, accounting for xx% of the total market share in 2024, with polysaccharides as the leading raw material.
- North America: High consumer awareness of sustainability and stringent regulations contribute to its dominance.
- Europe (Italy): Strong demand for innovative food packaging solutions.
- Asia-Pacific (Australia & New Zealand): Rising disposable incomes and growing environmental awareness fuel growth.
- Plant-Based Sources: Dominate the market due to their biodegradability and renewability.
- Polysaccharides: Leading raw material due to their abundance, biodegradability, and versatility.
Edible Packaging Market Product Landscape
The edible packaging market is characterized by a diverse range of products, including films, coatings, capsules, and sachets, each designed for specific applications. Innovations focus on enhancing functionality, such as improved barrier properties, extended shelf life, and enhanced flavor profiles. Products are tailored to diverse end-user needs, from preserving freshness to improving the sensory experience. Unique selling propositions often center on sustainability, biodegradability, and the incorporation of functional components that can enhance product quality.
Key Drivers, Barriers & Challenges in Edible Packaging Market
Key Drivers:
- Growing consumer demand for sustainable and eco-friendly packaging.
- Increasing regulatory pressure to reduce plastic waste.
- Advancements in biomaterial science and processing technologies.
- Expanding applications across various end-user industries.
Challenges & Restraints:
- High production costs compared to traditional packaging materials.
- Limited shelf life and barrier properties compared to conventional materials.
- Potential regulatory hurdles concerning food safety and material approvals.
- Supply chain issues and raw material availability can impact scalability. Estimated xx% of companies faced supply chain challenges in 2024.
Emerging Opportunities in Edible Packaging Market
- Untapped markets in developing economies with growing consumer awareness.
- Innovative applications in personalized nutrition and functional foods.
- Integration of smart packaging technologies for enhanced traceability and shelf-life monitoring.
- Customization options based on flavor, texture, and nutritional value.
Growth Accelerators in the Edible Packaging Market Industry
Technological breakthroughs in biomaterial science and processing technologies are key growth accelerators. Strategic partnerships between packaging companies and food producers drive market expansion. Market expansion strategies focusing on emerging economies and new applications further accelerate market growth.
Key Players Shaping the Edible Packaging Market Market
- Envigreen Biotech India Private Ltd
- Notpla Limited
- Evoware (PT Evogaia Karya Indonesia)
- Amtrex Nature Care Pvt Ltd
- Nagase America LLC (Nagase & Co Ltd)
- TSUKIOKA FILM PHARMA CO LTD
- ECOTELOC LIMITED
- Devro PLC (Saria Nederland BV)
- Tipa Corp Ltd
- JRF Technology LLC
- Glanbia Plc
Notable Milestones in Edible Packaging Market Sector
- 2021: Tipa Corp launched a new range of compostable films for food packaging.
- 2022: Notpla secured significant funding to expand its production capacity.
- 2023: Several key players announced partnerships to develop innovative bio-based edible packaging materials.
- 2024: New regulations on single-use plastics further boosted the market demand for sustainable alternatives.
In-Depth Edible Packaging Market Market Outlook
The edible packaging market is poised for sustained growth, driven by technological advancements, expanding applications, and rising consumer demand for sustainable solutions. Strategic partnerships and market expansion into emerging economies will play crucial roles in shaping the future market landscape. The potential for product differentiation and innovation will remain significant in ensuring long-term growth and market competitiveness.
Edible Packaging Market Segmentation
-
1. Source
- 1.1. Plant
- 1.2. Animal
-
2. Raw Material
- 2.1. Protein
- 2.2. Polysaccharides
- 2.3. Lipids
- 2.4. Other Raw Materials
-
3. End-User Industry
- 3.1. Food
- 3.2. Bevergae
- 3.3. Pharmaceutical
Edible Packaging Market Segmentation By Geography
-
1. North America
- 1.1. United States
- 1.2. Canada
- 1.3. Mexico
-
2. South America
- 2.1. Brazil
- 2.2. Argentina
- 2.3. Rest of South America
-
3. Europe
- 3.1. United Kingdom
- 3.2. Germany
- 3.3. France
- 3.4. Italy
- 3.5. Spain
- 3.6. Russia
- 3.7. Benelux
- 3.8. Nordics
- 3.9. Rest of Europe
-
4. Middle East & Africa
- 4.1. Turkey
- 4.2. Israel
- 4.3. GCC
- 4.4. North Africa
- 4.5. South Africa
- 4.6. Rest of Middle East & Africa
-
5. Asia Pacific
- 5.1. China
- 5.2. India
- 5.3. Japan
- 5.4. South Korea
- 5.5. ASEAN
- 5.6. Oceania
- 5.7. Rest of Asia Pacific
Edible Packaging Market REPORT HIGHLIGHTS
| Aspects | Details |
|---|---|
| Study Period | 2019-2033 |
| Base Year | 2024 |
| Estimated Year | 2025 |
| Forecast Period | 2025-2033 |
| Historical Period | 2019-2024 |
| Growth Rate | CAGR of 6.68% from 2019-2033 |
| Segmentation |
|
Table of Contents
- 1. Introduction
- 1.1. Research Scope
- 1.2. Market Segmentation
- 1.3. Research Methodology
- 1.4. Definitions and Assumptions
- 2. Executive Summary
- 2.1. Introduction
- 3. Market Dynamics
- 3.1. Introduction
- 3.2. Market Drivers
- 3.2.1. Need to Eliminate Type Waste Cycle and Increase Shelf-Life of the Product; Ban on Single-Use-Plastic and Growing Sustainability Concern
- 3.3. Market Restrains
- 3.3.1. High Cost of Production
- 3.4. Market Trends
- 3.4.1. The Increasing Demand for Sustainable Solutions and the Need for Extended Product Shelf-Life are helping drive market growth
- 4. Market Factor Analysis
- 4.1. Porters Five Forces
- 4.2. Supply/Value Chain
- 4.3. PESTEL analysis
- 4.4. Market Entropy
- 4.5. Patent/Trademark Analysis
- 5. Global Edible Packaging Market Analysis, Insights and Forecast, 2019-2031
- 5.1. Market Analysis, Insights and Forecast - by Source
- 5.1.1. Plant
- 5.1.2. Animal
- 5.2. Market Analysis, Insights and Forecast - by Raw Material
- 5.2.1. Protein
- 5.2.2. Polysaccharides
- 5.2.3. Lipids
- 5.2.4. Other Raw Materials
- 5.3. Market Analysis, Insights and Forecast - by End-User Industry
- 5.3.1. Food
- 5.3.2. Bevergae
- 5.3.3. Pharmaceutical
- 5.4. Market Analysis, Insights and Forecast - by Region
- 5.4.1. North America
- 5.4.2. South America
- 5.4.3. Europe
- 5.4.4. Middle East & Africa
- 5.4.5. Asia Pacific
- 5.1. Market Analysis, Insights and Forecast - by Source
- 6. North America Edible Packaging Market Analysis, Insights and Forecast, 2019-2031
- 6.1. Market Analysis, Insights and Forecast - by Source
- 6.1.1. Plant
- 6.1.2. Animal
- 6.2. Market Analysis, Insights and Forecast - by Raw Material
- 6.2.1. Protein
- 6.2.2. Polysaccharides
- 6.2.3. Lipids
- 6.2.4. Other Raw Materials
- 6.3. Market Analysis, Insights and Forecast - by End-User Industry
- 6.3.1. Food
- 6.3.2. Bevergae
- 6.3.3. Pharmaceutical
- 6.1. Market Analysis, Insights and Forecast - by Source
- 7. South America Edible Packaging Market Analysis, Insights and Forecast, 2019-2031
- 7.1. Market Analysis, Insights and Forecast - by Source
- 7.1.1. Plant
- 7.1.2. Animal
- 7.2. Market Analysis, Insights and Forecast - by Raw Material
- 7.2.1. Protein
- 7.2.2. Polysaccharides
- 7.2.3. Lipids
- 7.2.4. Other Raw Materials
- 7.3. Market Analysis, Insights and Forecast - by End-User Industry
- 7.3.1. Food
- 7.3.2. Bevergae
- 7.3.3. Pharmaceutical
- 7.1. Market Analysis, Insights and Forecast - by Source
- 8. Europe Edible Packaging Market Analysis, Insights and Forecast, 2019-2031
- 8.1. Market Analysis, Insights and Forecast - by Source
- 8.1.1. Plant
- 8.1.2. Animal
- 8.2. Market Analysis, Insights and Forecast - by Raw Material
- 8.2.1. Protein
- 8.2.2. Polysaccharides
- 8.2.3. Lipids
- 8.2.4. Other Raw Materials
- 8.3. Market Analysis, Insights and Forecast - by End-User Industry
- 8.3.1. Food
- 8.3.2. Bevergae
- 8.3.3. Pharmaceutical
- 8.1. Market Analysis, Insights and Forecast - by Source
- 9. Middle East & Africa Edible Packaging Market Analysis, Insights and Forecast, 2019-2031
- 9.1. Market Analysis, Insights and Forecast - by Source
- 9.1.1. Plant
- 9.1.2. Animal
- 9.2. Market Analysis, Insights and Forecast - by Raw Material
- 9.2.1. Protein
- 9.2.2. Polysaccharides
- 9.2.3. Lipids
- 9.2.4. Other Raw Materials
- 9.3. Market Analysis, Insights and Forecast - by End-User Industry
- 9.3.1. Food
- 9.3.2. Bevergae
- 9.3.3. Pharmaceutical
- 9.1. Market Analysis, Insights and Forecast - by Source
- 10. Asia Pacific Edible Packaging Market Analysis, Insights and Forecast, 2019-2031
- 10.1. Market Analysis, Insights and Forecast - by Source
- 10.1.1. Plant
- 10.1.2. Animal
- 10.2. Market Analysis, Insights and Forecast - by Raw Material
- 10.2.1. Protein
- 10.2.2. Polysaccharides
- 10.2.3. Lipids
- 10.2.4. Other Raw Materials
- 10.3. Market Analysis, Insights and Forecast - by End-User Industry
- 10.3.1. Food
- 10.3.2. Bevergae
- 10.3.3. Pharmaceutical
- 10.1. Market Analysis, Insights and Forecast - by Source
- 11. Competitive Analysis
- 11.1. Global Market Share Analysis 2024
- 11.2. Company Profiles
- 11.2.1 Envigreen Biotech India Private Ltd
- 11.2.1.1. Overview
- 11.2.1.2. Products
- 11.2.1.3. SWOT Analysis
- 11.2.1.4. Recent Developments
- 11.2.1.5. Financials (Based on Availability)
- 11.2.2 Notpla Limited
- 11.2.2.1. Overview
- 11.2.2.2. Products
- 11.2.2.3. SWOT Analysis
- 11.2.2.4. Recent Developments
- 11.2.2.5. Financials (Based on Availability)
- 11.2.3 Evoware (PT Evogaia Karya Indonesia)
- 11.2.3.1. Overview
- 11.2.3.2. Products
- 11.2.3.3. SWOT Analysis
- 11.2.3.4. Recent Developments
- 11.2.3.5. Financials (Based on Availability)
- 11.2.4 Amtrex Nature Care Pvt Ltd
- 11.2.4.1. Overview
- 11.2.4.2. Products
- 11.2.4.3. SWOT Analysis
- 11.2.4.4. Recent Developments
- 11.2.4.5. Financials (Based on Availability)
- 11.2.5 Nagase America LLC (Nagase & Co Ltd )
- 11.2.5.1. Overview
- 11.2.5.2. Products
- 11.2.5.3. SWOT Analysis
- 11.2.5.4. Recent Developments
- 11.2.5.5. Financials (Based on Availability)
- 11.2.6 TSUKIOKA FILM PHARMA CO LTD
- 11.2.6.1. Overview
- 11.2.6.2. Products
- 11.2.6.3. SWOT Analysis
- 11.2.6.4. Recent Developments
- 11.2.6.5. Financials (Based on Availability)
- 11.2.7 ECOLOTEC LIMITED
- 11.2.7.1. Overview
- 11.2.7.2. Products
- 11.2.7.3. SWOT Analysis
- 11.2.7.4. Recent Developments
- 11.2.7.5. Financials (Based on Availability)
- 11.2.8 Devro PLC (Saria Nederland BV)
- 11.2.8.1. Overview
- 11.2.8.2. Products
- 11.2.8.3. SWOT Analysis
- 11.2.8.4. Recent Developments
- 11.2.8.5. Financials (Based on Availability)
- 11.2.9 Tipa Corp Ltd
- 11.2.9.1. Overview
- 11.2.9.2. Products
- 11.2.9.3. SWOT Analysis
- 11.2.9.4. Recent Developments
- 11.2.9.5. Financials (Based on Availability)
- 11.2.10 JRF Technology LLC
- 11.2.10.1. Overview
- 11.2.10.2. Products
- 11.2.10.3. SWOT Analysis
- 11.2.10.4. Recent Developments
- 11.2.10.5. Financials (Based on Availability)
- 11.2.11 Glanbia Plc
- 11.2.11.1. Overview
- 11.2.11.2. Products
- 11.2.11.3. SWOT Analysis
- 11.2.11.4. Recent Developments
- 11.2.11.5. Financials (Based on Availability)
- 11.2.1 Envigreen Biotech India Private Ltd
List of Figures
- Figure 1: Global Edible Packaging Market Revenue Breakdown (Million, %) by Region 2024 & 2032
- Figure 2: Global Edible Packaging Market Volume Breakdown (K Tons, %) by Region 2024 & 2032
- Figure 3: North America Edible Packaging Market Revenue (Million), by Source 2024 & 2032
- Figure 4: North America Edible Packaging Market Volume (K Tons), by Source 2024 & 2032
- Figure 5: North America Edible Packaging Market Revenue Share (%), by Source 2024 & 2032
- Figure 6: North America Edible Packaging Market Volume Share (%), by Source 2024 & 2032
- Figure 7: North America Edible Packaging Market Revenue (Million), by Raw Material 2024 & 2032
- Figure 8: North America Edible Packaging Market Volume (K Tons), by Raw Material 2024 & 2032
- Figure 9: North America Edible Packaging Market Revenue Share (%), by Raw Material 2024 & 2032
- Figure 10: North America Edible Packaging Market Volume Share (%), by Raw Material 2024 & 2032
- Figure 11: North America Edible Packaging Market Revenue (Million), by End-User Industry 2024 & 2032
- Figure 12: North America Edible Packaging Market Volume (K Tons), by End-User Industry 2024 & 2032
- Figure 13: North America Edible Packaging Market Revenue Share (%), by End-User Industry 2024 & 2032
- Figure 14: North America Edible Packaging Market Volume Share (%), by End-User Industry 2024 & 2032
- Figure 15: North America Edible Packaging Market Revenue (Million), by Country 2024 & 2032
- Figure 16: North America Edible Packaging Market Volume (K Tons), by Country 2024 & 2032
- Figure 17: North America Edible Packaging Market Revenue Share (%), by Country 2024 & 2032
- Figure 18: North America Edible Packaging Market Volume Share (%), by Country 2024 & 2032
- Figure 19: South America Edible Packaging Market Revenue (Million), by Source 2024 & 2032
- Figure 20: South America Edible Packaging Market Volume (K Tons), by Source 2024 & 2032
- Figure 21: South America Edible Packaging Market Revenue Share (%), by Source 2024 & 2032
- Figure 22: South America Edible Packaging Market Volume Share (%), by Source 2024 & 2032
- Figure 23: South America Edible Packaging Market Revenue (Million), by Raw Material 2024 & 2032
- Figure 24: South America Edible Packaging Market Volume (K Tons), by Raw Material 2024 & 2032
- Figure 25: South America Edible Packaging Market Revenue Share (%), by Raw Material 2024 & 2032
- Figure 26: South America Edible Packaging Market Volume Share (%), by Raw Material 2024 & 2032
- Figure 27: South America Edible Packaging Market Revenue (Million), by End-User Industry 2024 & 2032
- Figure 28: South America Edible Packaging Market Volume (K Tons), by End-User Industry 2024 & 2032
- Figure 29: South America Edible Packaging Market Revenue Share (%), by End-User Industry 2024 & 2032
- Figure 30: South America Edible Packaging Market Volume Share (%), by End-User Industry 2024 & 2032
- Figure 31: South America Edible Packaging Market Revenue (Million), by Country 2024 & 2032
- Figure 32: South America Edible Packaging Market Volume (K Tons), by Country 2024 & 2032
- Figure 33: South America Edible Packaging Market Revenue Share (%), by Country 2024 & 2032
- Figure 34: South America Edible Packaging Market Volume Share (%), by Country 2024 & 2032
- Figure 35: Europe Edible Packaging Market Revenue (Million), by Source 2024 & 2032
- Figure 36: Europe Edible Packaging Market Volume (K Tons), by Source 2024 & 2032
- Figure 37: Europe Edible Packaging Market Revenue Share (%), by Source 2024 & 2032
- Figure 38: Europe Edible Packaging Market Volume Share (%), by Source 2024 & 2032
- Figure 39: Europe Edible Packaging Market Revenue (Million), by Raw Material 2024 & 2032
- Figure 40: Europe Edible Packaging Market Volume (K Tons), by Raw Material 2024 & 2032
- Figure 41: Europe Edible Packaging Market Revenue Share (%), by Raw Material 2024 & 2032
- Figure 42: Europe Edible Packaging Market Volume Share (%), by Raw Material 2024 & 2032
- Figure 43: Europe Edible Packaging Market Revenue (Million), by End-User Industry 2024 & 2032
- Figure 44: Europe Edible Packaging Market Volume (K Tons), by End-User Industry 2024 & 2032
- Figure 45: Europe Edible Packaging Market Revenue Share (%), by End-User Industry 2024 & 2032
- Figure 46: Europe Edible Packaging Market Volume Share (%), by End-User Industry 2024 & 2032
- Figure 47: Europe Edible Packaging Market Revenue (Million), by Country 2024 & 2032
- Figure 48: Europe Edible Packaging Market Volume (K Tons), by Country 2024 & 2032
- Figure 49: Europe Edible Packaging Market Revenue Share (%), by Country 2024 & 2032
- Figure 50: Europe Edible Packaging Market Volume Share (%), by Country 2024 & 2032
- Figure 51: Middle East & Africa Edible Packaging Market Revenue (Million), by Source 2024 & 2032
- Figure 52: Middle East & Africa Edible Packaging Market Volume (K Tons), by Source 2024 & 2032
- Figure 53: Middle East & Africa Edible Packaging Market Revenue Share (%), by Source 2024 & 2032
- Figure 54: Middle East & Africa Edible Packaging Market Volume Share (%), by Source 2024 & 2032
- Figure 55: Middle East & Africa Edible Packaging Market Revenue (Million), by Raw Material 2024 & 2032
- Figure 56: Middle East & Africa Edible Packaging Market Volume (K Tons), by Raw Material 2024 & 2032
- Figure 57: Middle East & Africa Edible Packaging Market Revenue Share (%), by Raw Material 2024 & 2032
- Figure 58: Middle East & Africa Edible Packaging Market Volume Share (%), by Raw Material 2024 & 2032
- Figure 59: Middle East & Africa Edible Packaging Market Revenue (Million), by End-User Industry 2024 & 2032
- Figure 60: Middle East & Africa Edible Packaging Market Volume (K Tons), by End-User Industry 2024 & 2032
- Figure 61: Middle East & Africa Edible Packaging Market Revenue Share (%), by End-User Industry 2024 & 2032
- Figure 62: Middle East & Africa Edible Packaging Market Volume Share (%), by End-User Industry 2024 & 2032
- Figure 63: Middle East & Africa Edible Packaging Market Revenue (Million), by Country 2024 & 2032
- Figure 64: Middle East & Africa Edible Packaging Market Volume (K Tons), by Country 2024 & 2032
- Figure 65: Middle East & Africa Edible Packaging Market Revenue Share (%), by Country 2024 & 2032
- Figure 66: Middle East & Africa Edible Packaging Market Volume Share (%), by Country 2024 & 2032
- Figure 67: Asia Pacific Edible Packaging Market Revenue (Million), by Source 2024 & 2032
- Figure 68: Asia Pacific Edible Packaging Market Volume (K Tons), by Source 2024 & 2032
- Figure 69: Asia Pacific Edible Packaging Market Revenue Share (%), by Source 2024 & 2032
- Figure 70: Asia Pacific Edible Packaging Market Volume Share (%), by Source 2024 & 2032
- Figure 71: Asia Pacific Edible Packaging Market Revenue (Million), by Raw Material 2024 & 2032
- Figure 72: Asia Pacific Edible Packaging Market Volume (K Tons), by Raw Material 2024 & 2032
- Figure 73: Asia Pacific Edible Packaging Market Revenue Share (%), by Raw Material 2024 & 2032
- Figure 74: Asia Pacific Edible Packaging Market Volume Share (%), by Raw Material 2024 & 2032
- Figure 75: Asia Pacific Edible Packaging Market Revenue (Million), by End-User Industry 2024 & 2032
- Figure 76: Asia Pacific Edible Packaging Market Volume (K Tons), by End-User Industry 2024 & 2032
- Figure 77: Asia Pacific Edible Packaging Market Revenue Share (%), by End-User Industry 2024 & 2032
- Figure 78: Asia Pacific Edible Packaging Market Volume Share (%), by End-User Industry 2024 & 2032
- Figure 79: Asia Pacific Edible Packaging Market Revenue (Million), by Country 2024 & 2032
- Figure 80: Asia Pacific Edible Packaging Market Volume (K Tons), by Country 2024 & 2032
- Figure 81: Asia Pacific Edible Packaging Market Revenue Share (%), by Country 2024 & 2032
- Figure 82: Asia Pacific Edible Packaging Market Volume Share (%), by Country 2024 & 2032
List of Tables
- Table 1: Global Edible Packaging Market Revenue Million Forecast, by Region 2019 & 2032
- Table 2: Global Edible Packaging Market Volume K Tons Forecast, by Region 2019 & 2032
- Table 3: Global Edible Packaging Market Revenue Million Forecast, by Source 2019 & 2032
- Table 4: Global Edible Packaging Market Volume K Tons Forecast, by Source 2019 & 2032
- Table 5: Global Edible Packaging Market Revenue Million Forecast, by Raw Material 2019 & 2032
- Table 6: Global Edible Packaging Market Volume K Tons Forecast, by Raw Material 2019 & 2032
- Table 7: Global Edible Packaging Market Revenue Million Forecast, by End-User Industry 2019 & 2032
- Table 8: Global Edible Packaging Market Volume K Tons Forecast, by End-User Industry 2019 & 2032
- Table 9: Global Edible Packaging Market Revenue Million Forecast, by Region 2019 & 2032
- Table 10: Global Edible Packaging Market Volume K Tons Forecast, by Region 2019 & 2032
- Table 11: Global Edible Packaging Market Revenue Million Forecast, by Source 2019 & 2032
- Table 12: Global Edible Packaging Market Volume K Tons Forecast, by Source 2019 & 2032
- Table 13: Global Edible Packaging Market Revenue Million Forecast, by Raw Material 2019 & 2032
- Table 14: Global Edible Packaging Market Volume K Tons Forecast, by Raw Material 2019 & 2032
- Table 15: Global Edible Packaging Market Revenue Million Forecast, by End-User Industry 2019 & 2032
- Table 16: Global Edible Packaging Market Volume K Tons Forecast, by End-User Industry 2019 & 2032
- Table 17: Global Edible Packaging Market Revenue Million Forecast, by Country 2019 & 2032
- Table 18: Global Edible Packaging Market Volume K Tons Forecast, by Country 2019 & 2032
- Table 19: United States Edible Packaging Market Revenue (Million) Forecast, by Application 2019 & 2032
- Table 20: United States Edible Packaging Market Volume (K Tons) Forecast, by Application 2019 & 2032
- Table 21: Canada Edible Packaging Market Revenue (Million) Forecast, by Application 2019 & 2032
- Table 22: Canada Edible Packaging Market Volume (K Tons) Forecast, by Application 2019 & 2032
- Table 23: Mexico Edible Packaging Market Revenue (Million) Forecast, by Application 2019 & 2032
- Table 24: Mexico Edible Packaging Market Volume (K Tons) Forecast, by Application 2019 & 2032
- Table 25: Global Edible Packaging Market Revenue Million Forecast, by Source 2019 & 2032
- Table 26: Global Edible Packaging Market Volume K Tons Forecast, by Source 2019 & 2032
- Table 27: Global Edible Packaging Market Revenue Million Forecast, by Raw Material 2019 & 2032
- Table 28: Global Edible Packaging Market Volume K Tons Forecast, by Raw Material 2019 & 2032
- Table 29: Global Edible Packaging Market Revenue Million Forecast, by End-User Industry 2019 & 2032
- Table 30: Global Edible Packaging Market Volume K Tons Forecast, by End-User Industry 2019 & 2032
- Table 31: Global Edible Packaging Market Revenue Million Forecast, by Country 2019 & 2032
- Table 32: Global Edible Packaging Market Volume K Tons Forecast, by Country 2019 & 2032
- Table 33: Brazil Edible Packaging Market Revenue (Million) Forecast, by Application 2019 & 2032
- Table 34: Brazil Edible Packaging Market Volume (K Tons) Forecast, by Application 2019 & 2032
- Table 35: Argentina Edible Packaging Market Revenue (Million) Forecast, by Application 2019 & 2032
- Table 36: Argentina Edible Packaging Market Volume (K Tons) Forecast, by Application 2019 & 2032
- Table 37: Rest of South America Edible Packaging Market Revenue (Million) Forecast, by Application 2019 & 2032
- Table 38: Rest of South America Edible Packaging Market Volume (K Tons) Forecast, by Application 2019 & 2032
- Table 39: Global Edible Packaging Market Revenue Million Forecast, by Source 2019 & 2032
- Table 40: Global Edible Packaging Market Volume K Tons Forecast, by Source 2019 & 2032
- Table 41: Global Edible Packaging Market Revenue Million Forecast, by Raw Material 2019 & 2032
- Table 42: Global Edible Packaging Market Volume K Tons Forecast, by Raw Material 2019 & 2032
- Table 43: Global Edible Packaging Market Revenue Million Forecast, by End-User Industry 2019 & 2032
- Table 44: Global Edible Packaging Market Volume K Tons Forecast, by End-User Industry 2019 & 2032
- Table 45: Global Edible Packaging Market Revenue Million Forecast, by Country 2019 & 2032
- Table 46: Global Edible Packaging Market Volume K Tons Forecast, by Country 2019 & 2032
- Table 47: United Kingdom Edible Packaging Market Revenue (Million) Forecast, by Application 2019 & 2032
- Table 48: United Kingdom Edible Packaging Market Volume (K Tons) Forecast, by Application 2019 & 2032
- Table 49: Germany Edible Packaging Market Revenue (Million) Forecast, by Application 2019 & 2032
- Table 50: Germany Edible Packaging Market Volume (K Tons) Forecast, by Application 2019 & 2032
- Table 51: France Edible Packaging Market Revenue (Million) Forecast, by Application 2019 & 2032
- Table 52: France Edible Packaging Market Volume (K Tons) Forecast, by Application 2019 & 2032
- Table 53: Italy Edible Packaging Market Revenue (Million) Forecast, by Application 2019 & 2032
- Table 54: Italy Edible Packaging Market Volume (K Tons) Forecast, by Application 2019 & 2032
- Table 55: Spain Edible Packaging Market Revenue (Million) Forecast, by Application 2019 & 2032
- Table 56: Spain Edible Packaging Market Volume (K Tons) Forecast, by Application 2019 & 2032
- Table 57: Russia Edible Packaging Market Revenue (Million) Forecast, by Application 2019 & 2032
- Table 58: Russia Edible Packaging Market Volume (K Tons) Forecast, by Application 2019 & 2032
- Table 59: Benelux Edible Packaging Market Revenue (Million) Forecast, by Application 2019 & 2032
- Table 60: Benelux Edible Packaging Market Volume (K Tons) Forecast, by Application 2019 & 2032
- Table 61: Nordics Edible Packaging Market Revenue (Million) Forecast, by Application 2019 & 2032
- Table 62: Nordics Edible Packaging Market Volume (K Tons) Forecast, by Application 2019 & 2032
- Table 63: Rest of Europe Edible Packaging Market Revenue (Million) Forecast, by Application 2019 & 2032
- Table 64: Rest of Europe Edible Packaging Market Volume (K Tons) Forecast, by Application 2019 & 2032
- Table 65: Global Edible Packaging Market Revenue Million Forecast, by Source 2019 & 2032
- Table 66: Global Edible Packaging Market Volume K Tons Forecast, by Source 2019 & 2032
- Table 67: Global Edible Packaging Market Revenue Million Forecast, by Raw Material 2019 & 2032
- Table 68: Global Edible Packaging Market Volume K Tons Forecast, by Raw Material 2019 & 2032
- Table 69: Global Edible Packaging Market Revenue Million Forecast, by End-User Industry 2019 & 2032
- Table 70: Global Edible Packaging Market Volume K Tons Forecast, by End-User Industry 2019 & 2032
- Table 71: Global Edible Packaging Market Revenue Million Forecast, by Country 2019 & 2032
- Table 72: Global Edible Packaging Market Volume K Tons Forecast, by Country 2019 & 2032
- Table 73: Turkey Edible Packaging Market Revenue (Million) Forecast, by Application 2019 & 2032
- Table 74: Turkey Edible Packaging Market Volume (K Tons) Forecast, by Application 2019 & 2032
- Table 75: Israel Edible Packaging Market Revenue (Million) Forecast, by Application 2019 & 2032
- Table 76: Israel Edible Packaging Market Volume (K Tons) Forecast, by Application 2019 & 2032
- Table 77: GCC Edible Packaging Market Revenue (Million) Forecast, by Application 2019 & 2032
- Table 78: GCC Edible Packaging Market Volume (K Tons) Forecast, by Application 2019 & 2032
- Table 79: North Africa Edible Packaging Market Revenue (Million) Forecast, by Application 2019 & 2032
- Table 80: North Africa Edible Packaging Market Volume (K Tons) Forecast, by Application 2019 & 2032
- Table 81: South Africa Edible Packaging Market Revenue (Million) Forecast, by Application 2019 & 2032
- Table 82: South Africa Edible Packaging Market Volume (K Tons) Forecast, by Application 2019 & 2032
- Table 83: Rest of Middle East & Africa Edible Packaging Market Revenue (Million) Forecast, by Application 2019 & 2032
- Table 84: Rest of Middle East & Africa Edible Packaging Market Volume (K Tons) Forecast, by Application 2019 & 2032
- Table 85: Global Edible Packaging Market Revenue Million Forecast, by Source 2019 & 2032
- Table 86: Global Edible Packaging Market Volume K Tons Forecast, by Source 2019 & 2032
- Table 87: Global Edible Packaging Market Revenue Million Forecast, by Raw Material 2019 & 2032
- Table 88: Global Edible Packaging Market Volume K Tons Forecast, by Raw Material 2019 & 2032
- Table 89: Global Edible Packaging Market Revenue Million Forecast, by End-User Industry 2019 & 2032
- Table 90: Global Edible Packaging Market Volume K Tons Forecast, by End-User Industry 2019 & 2032
- Table 91: Global Edible Packaging Market Revenue Million Forecast, by Country 2019 & 2032
- Table 92: Global Edible Packaging Market Volume K Tons Forecast, by Country 2019 & 2032
- Table 93: China Edible Packaging Market Revenue (Million) Forecast, by Application 2019 & 2032
- Table 94: China Edible Packaging Market Volume (K Tons) Forecast, by Application 2019 & 2032
- Table 95: India Edible Packaging Market Revenue (Million) Forecast, by Application 2019 & 2032
- Table 96: India Edible Packaging Market Volume (K Tons) Forecast, by Application 2019 & 2032
- Table 97: Japan Edible Packaging Market Revenue (Million) Forecast, by Application 2019 & 2032
- Table 98: Japan Edible Packaging Market Volume (K Tons) Forecast, by Application 2019 & 2032
- Table 99: South Korea Edible Packaging Market Revenue (Million) Forecast, by Application 2019 & 2032
- Table 100: South Korea Edible Packaging Market Volume (K Tons) Forecast, by Application 2019 & 2032
- Table 101: ASEAN Edible Packaging Market Revenue (Million) Forecast, by Application 2019 & 2032
- Table 102: ASEAN Edible Packaging Market Volume (K Tons) Forecast, by Application 2019 & 2032
- Table 103: Oceania Edible Packaging Market Revenue (Million) Forecast, by Application 2019 & 2032
- Table 104: Oceania Edible Packaging Market Volume (K Tons) Forecast, by Application 2019 & 2032
- Table 105: Rest of Asia Pacific Edible Packaging Market Revenue (Million) Forecast, by Application 2019 & 2032
- Table 106: Rest of Asia Pacific Edible Packaging Market Volume (K Tons) Forecast, by Application 2019 & 2032
Frequently Asked Questions
1. What is the projected Compound Annual Growth Rate (CAGR) of the Edible Packaging Market?
The projected CAGR is approximately 6.68%.
2. Which companies are prominent players in the Edible Packaging Market?
Key companies in the market include Envigreen Biotech India Private Ltd, Notpla Limited, Evoware (PT Evogaia Karya Indonesia), Amtrex Nature Care Pvt Ltd, Nagase America LLC (Nagase & Co Ltd ), TSUKIOKA FILM PHARMA CO LTD, ECOLOTEC LIMITED, Devro PLC (Saria Nederland BV), Tipa Corp Ltd, JRF Technology LLC, Glanbia Plc.
3. What are the main segments of the Edible Packaging Market?
The market segments include Source, Raw Material, End-User Industry.
4. Can you provide details about the market size?
The market size is estimated to be USD 1.04 Million as of 2022.
5. What are some drivers contributing to market growth?
Need to Eliminate Type Waste Cycle and Increase Shelf-Life of the Product; Ban on Single-Use-Plastic and Growing Sustainability Concern.
6. What are the notable trends driving market growth?
The Increasing Demand for Sustainable Solutions and the Need for Extended Product Shelf-Life are helping drive market growth.
7. Are there any restraints impacting market growth?
High Cost of Production.
8. Can you provide examples of recent developments in the market?
N/A
9. What pricing options are available for accessing the report?
Pricing options include single-user, multi-user, and enterprise licenses priced at USD 4750, USD 5250, and USD 8750 respectively.
10. Is the market size provided in terms of value or volume?
The market size is provided in terms of value, measured in Million and volume, measured in K Tons.
11. Are there any specific market keywords associated with the report?
Yes, the market keyword associated with the report is "Edible Packaging Market," which aids in identifying and referencing the specific market segment covered.
12. How do I determine which pricing option suits my needs best?
The pricing options vary based on user requirements and access needs. Individual users may opt for single-user licenses, while businesses requiring broader access may choose multi-user or enterprise licenses for cost-effective access to the report.
13. Are there any additional resources or data provided in the Edible Packaging Market report?
While the report offers comprehensive insights, it's advisable to review the specific contents or supplementary materials provided to ascertain if additional resources or data are available.
14. How can I stay updated on further developments or reports in the Edible Packaging Market?
To stay informed about further developments, trends, and reports in the Edible Packaging Market, consider subscribing to industry newsletters, following relevant companies and organizations, or regularly checking reputable industry news sources and publications.
Methodology
Step 1 - Identification of Relevant Samples Size from Population Database


Step 2 - Approaches for Defining Global Market Size (Value, Volume* & Price*)

Note*: In applicable scenarios
Step 3 - Data Sources
Primary Research
- Web Analytics
- Survey Reports
- Research Institute
- Latest Research Reports
- Opinion Leaders
Secondary Research
- Annual Reports
- White Paper
- Latest Press Release
- Industry Association
- Paid Database
- Investor Presentations

Step 4 - Data Triangulation
Involves using different sources of information in order to increase the validity of a study
These sources are likely to be stakeholders in a program - participants, other researchers, program staff, other community members, and so on.
Then we put all data in single framework & apply various statistical tools to find out the dynamic on the market.
During the analysis stage, feedback from the stakeholder groups would be compared to determine areas of agreement as well as areas of divergence
