

Key Insights
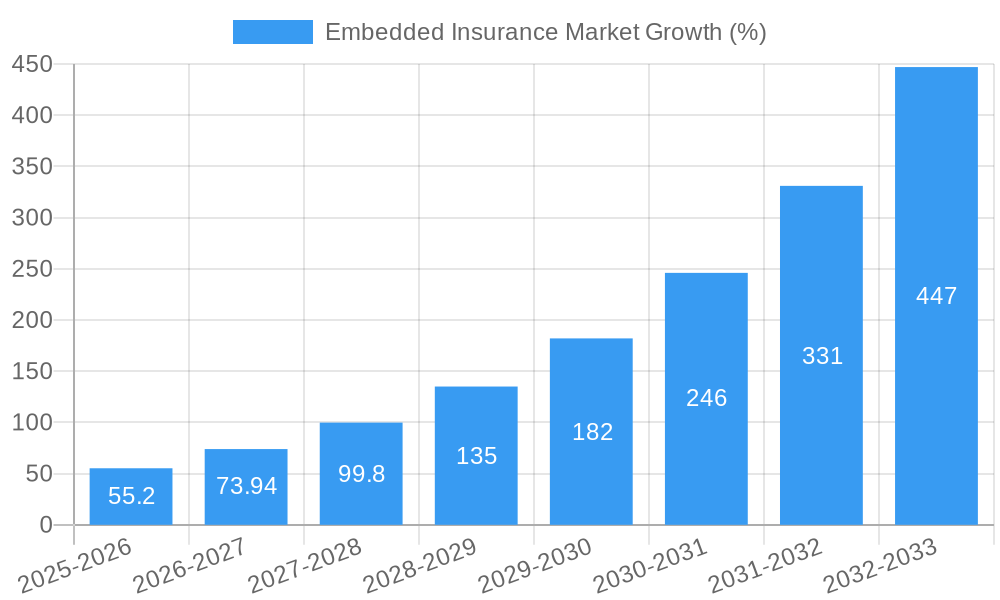
The embedded insurance market is experiencing explosive growth, projected to reach \$156.06 million in 2025 and exhibiting a remarkable Compound Annual Growth Rate (CAGR) of 35.14% from 2025 to 2033. This surge is driven by several key factors. The increasing integration of insurance products into various digital platforms and online services provides seamless and convenient access for consumers, fostering higher adoption rates. Furthermore, the rise of Insurtech companies, like those listed (Cover Genius, Penn Io, Lemonade, etc.), is revolutionizing the industry with innovative product offerings, streamlined processes, and data-driven personalization. This increased competition is further pushing down prices and enhancing customer experience, making embedded insurance a compelling alternative to traditional insurance models. The market's growth is also fueled by a growing demand for customized and on-demand insurance solutions, tailored to specific needs and often integrated directly into the purchase of goods or services.
Looking ahead, the embedded insurance market will likely witness continued expansion driven by the increasing adoption of digital technologies across various sectors, fostering broader integration opportunities. The expansion into new geographical regions and the development of more sophisticated risk assessment models will further contribute to market growth. However, challenges remain, including the need for robust regulatory frameworks to ensure consumer protection and the ongoing need to educate both consumers and businesses about the benefits of embedded insurance. The market will continue to evolve, with a greater focus on personalization, AI-powered risk assessment, and the development of new insurance products to meet the changing needs of an increasingly interconnected world.

Embedded Insurance Market: A Comprehensive Report (2019-2033)
This comprehensive report provides a detailed analysis of the Embedded Insurance Market, encompassing market dynamics, growth trends, regional dominance, product landscape, key players, and future outlook. The study period covers 2019-2033, with 2025 as the base and estimated year. The forecast period spans 2025-2033, and the historical period encompasses 2019-2024. This report is invaluable for industry professionals, investors, and anyone seeking to understand the rapidly evolving landscape of embedded insurance.
Embedded Insurance Market Dynamics & Structure
The embedded insurance market is experiencing significant growth, driven by technological advancements, changing consumer preferences, and strategic partnerships. Market concentration is moderate, with several key players vying for market share. Technological innovations, particularly in API integrations and data analytics, are crucial drivers. Regulatory frameworks vary across regions, impacting market entry and operations. Competitive substitutes include traditional insurance models, but embedded insurance offers superior convenience and integration. The end-user demographics are expanding, encompassing diverse industries and consumer segments. M&A activity is prevalent, reflecting industry consolidation and expansion.
- Market Concentration: Moderately concentrated, with top 5 players holding approximately xx% market share in 2025 (estimated).
- Technological Innovation Drivers: API integrations, AI-powered risk assessment, data analytics.
- Regulatory Frameworks: Vary significantly by region, posing both opportunities and challenges.
- Competitive Product Substitutes: Traditional insurance models, posing a competitive threat.
- End-User Demographics: Expanding across various industries and consumer segments.
- M&A Trends: Significant activity, with xx major deals closed in the past 3 years (2022-2024).
Embedded Insurance Market Growth Trends & Insights
The global embedded insurance market is experiencing robust growth, with a projected CAGR of xx% from 2025 to 2033, reaching a market size of xx million by 2033. Market penetration is increasing steadily, driven by rising consumer adoption and the increasing integration of insurance products within various platforms. Technological disruptions, including the rise of Insurtech companies and the adoption of digital distribution channels, are fueling this growth. Consumer behavior is shifting towards greater convenience and personalized insurance solutions, creating favorable conditions for embedded insurance. The market size witnessed a growth of xx million from 2019 to 2024, indicating strong historical growth.
Dominant Regions, Countries, or Segments in Embedded Insurance Market
North America currently dominates the embedded insurance market, driven by strong technological infrastructure, a high level of digital adoption, and a favorable regulatory environment. However, Asia-Pacific is expected to demonstrate the fastest growth rate over the forecast period due to increasing smartphone penetration and rising disposable incomes. The e-commerce segment currently leads in terms of embedded insurance adoption, followed by fintech and travel.
- North America: High digital adoption, strong regulatory support, and established Insurtech ecosystem drive market dominance.
- Asia-Pacific: Rapid growth driven by rising smartphone penetration and increasing disposable incomes.
- Europe: Steady growth driven by increasing regulatory awareness and demand for digital insurance products.
- Key Growth Drivers: Technological advancements, increasing demand for convenient insurance solutions, favorable government policies.
Embedded Insurance Market Product Landscape
Embedded insurance products are increasingly diverse, ranging from simple add-on insurance to complex, customized solutions integrated seamlessly into various platforms. Innovative features like AI-powered risk assessment, personalized pricing, and real-time claims processing are driving adoption. The focus is on providing ease of access and a seamless customer experience. Companies are employing unique selling propositions focusing on convenience, affordability, and tailored coverage.
Key Drivers, Barriers & Challenges in Embedded Insurance Market
Key Drivers:
- Increasing digitalization and the rise of e-commerce platforms.
- Growing demand for convenient and personalized insurance solutions.
- Strategic partnerships between insurers and technology providers.
Challenges:
- Regulatory complexities and varying insurance regulations across different regions.
- Integration challenges with existing systems and platforms.
- Cybersecurity concerns and data privacy issues.
- Competition from established insurance providers.
Emerging Opportunities in Embedded Insurance Market
Untapped markets, like emerging economies with rising smartphone usage, offer significant growth potential. Innovative applications in areas such as IoT-connected devices and the gig economy are creating new opportunities. Evolving consumer preferences for personalized and on-demand services are driving demand for tailored embedded insurance offerings. The integration of embedded insurance within various SaaS platforms presents a significant, untapped market.
Growth Accelerators in the Embedded Insurance Market Industry
Technological advancements, such as AI and machine learning, are accelerating growth by enabling better risk assessment and fraud detection. Strategic partnerships between Insurtech companies, technology providers, and traditional insurance providers are fostering innovation and market expansion. Government support for digital insurance and initiatives to enhance financial inclusion are creating a favorable environment for growth.
Key Players Shaping the Embedded Insurance Market Market
- Cover Genius
- Penn Io
- Lemonade
- FetchaQuote
- Fletch
- Bubble
- Companjon
- Rein
- Mulberri
- Qover
- Bolttech
- Igloo
- Assurant
- Bsurance
- Extend
- List Not Exhaustive
Notable Milestones in Embedded Insurance Market Sector
- November 2023: NJJ, a telecommunications conglomerate, collaborated with Bolttech, an Insurtech company, to offer mobile device insurance for mobile operators. This partnership expanded the reach of embedded insurance into a new sector.
- October 2023: Modives collaborated with Bindable to introduce embedded insurance into their property segment. This collaboration demonstrates the growing interest in embedding insurance within diverse industries.
In-Depth Embedded Insurance Market Market Outlook
The future of the embedded insurance market is bright, driven by continuous technological advancements, expanding partnerships, and increasing consumer demand for seamless insurance solutions. Strategic investments in innovative technologies, expansion into new markets, and the development of customized insurance products will be crucial for long-term success. The market is poised for significant growth, with opportunities for both established players and emerging Insurtech companies.
Embedded Insurance Market Segmentation
-
1. Insurance Line
- 1.1. Electronics
- 1.2. Furniture
- 1.3. Sports Equipment
- 1.4. Travel Insurance
- 1.5. Others
-
2. Channel
- 2.1. Online
- 2.2. Offline
Embedded Insurance Market Segmentation By Geography
-
1. North America
- 1.1. United States
- 1.2. Canada
-
2. Europe
- 2.1. United Kingdom
- 2.2. France
- 2.3. Italy
- 2.4. Spain
- 2.5. Rest of Europe
-
3. Asia Pacific
- 3.1. China
- 3.2. India
- 3.3. Japan
- 3.4. Rest of Asia Pacific
-
4. Latin America
- 4.1. Mexico
- 4.2. Brazil
- 4.3. Rest of Latin America
- 5. Middle East
-
6. United Arab Emirates
- 6.1. Saudi Arabia
- 6.2. South Africa
- 6.3. Rest of Middle East

Embedded Insurance Market REPORT HIGHLIGHTS
| Aspects | Details |
|---|---|
| Study Period | 2019-2033 |
| Base Year | 2024 |
| Estimated Year | 2025 |
| Forecast Period | 2025-2033 |
| Historical Period | 2019-2024 |
| Growth Rate | CAGR of 35.14% from 2019-2033 |
| Segmentation |
|
Table of Contents
- 1. Introduction
- 1.1. Research Scope
- 1.2. Market Segmentation
- 1.3. Research Methodology
- 1.4. Definitions and Assumptions
- 2. Executive Summary
- 2.1. Introduction
- 3. Market Dynamics
- 3.1. Introduction
- 3.2. Market Drivers
- 3.3. Market Restrains
- 3.4. Market Trends
- 3.4.1. Increasing Life Insurance Premiums is Fuelling the Market
- 4. Market Factor Analysis
- 4.1. Porters Five Forces
- 4.2. Supply/Value Chain
- 4.3. PESTEL analysis
- 4.4. Market Entropy
- 4.5. Patent/Trademark Analysis
- 5. Global Embedded Insurance Market Analysis, Insights and Forecast, 2019-2031
- 5.1. Market Analysis, Insights and Forecast - by Insurance Line
- 5.1.1. Electronics
- 5.1.2. Furniture
- 5.1.3. Sports Equipment
- 5.1.4. Travel Insurance
- 5.1.5. Others
- 5.2. Market Analysis, Insights and Forecast - by Channel
- 5.2.1. Online
- 5.2.2. Offline
- 5.3. Market Analysis, Insights and Forecast - by Region
- 5.3.1. North America
- 5.3.2. Europe
- 5.3.3. Asia Pacific
- 5.3.4. Latin America
- 5.3.5. Middle East
- 5.3.6. United Arab Emirates
- 5.1. Market Analysis, Insights and Forecast - by Insurance Line
- 6. North America Embedded Insurance Market Analysis, Insights and Forecast, 2019-2031
- 6.1. Market Analysis, Insights and Forecast - by Insurance Line
- 6.1.1. Electronics
- 6.1.2. Furniture
- 6.1.3. Sports Equipment
- 6.1.4. Travel Insurance
- 6.1.5. Others
- 6.2. Market Analysis, Insights and Forecast - by Channel
- 6.2.1. Online
- 6.2.2. Offline
- 6.1. Market Analysis, Insights and Forecast - by Insurance Line
- 7. Europe Embedded Insurance Market Analysis, Insights and Forecast, 2019-2031
- 7.1. Market Analysis, Insights and Forecast - by Insurance Line
- 7.1.1. Electronics
- 7.1.2. Furniture
- 7.1.3. Sports Equipment
- 7.1.4. Travel Insurance
- 7.1.5. Others
- 7.2. Market Analysis, Insights and Forecast - by Channel
- 7.2.1. Online
- 7.2.2. Offline
- 7.1. Market Analysis, Insights and Forecast - by Insurance Line
- 8. Asia Pacific Embedded Insurance Market Analysis, Insights and Forecast, 2019-2031
- 8.1. Market Analysis, Insights and Forecast - by Insurance Line
- 8.1.1. Electronics
- 8.1.2. Furniture
- 8.1.3. Sports Equipment
- 8.1.4. Travel Insurance
- 8.1.5. Others
- 8.2. Market Analysis, Insights and Forecast - by Channel
- 8.2.1. Online
- 8.2.2. Offline
- 8.1. Market Analysis, Insights and Forecast - by Insurance Line
- 9. Latin America Embedded Insurance Market Analysis, Insights and Forecast, 2019-2031
- 9.1. Market Analysis, Insights and Forecast - by Insurance Line
- 9.1.1. Electronics
- 9.1.2. Furniture
- 9.1.3. Sports Equipment
- 9.1.4. Travel Insurance
- 9.1.5. Others
- 9.2. Market Analysis, Insights and Forecast - by Channel
- 9.2.1. Online
- 9.2.2. Offline
- 9.1. Market Analysis, Insights and Forecast - by Insurance Line
- 10. Middle East Embedded Insurance Market Analysis, Insights and Forecast, 2019-2031
- 10.1. Market Analysis, Insights and Forecast - by Insurance Line
- 10.1.1. Electronics
- 10.1.2. Furniture
- 10.1.3. Sports Equipment
- 10.1.4. Travel Insurance
- 10.1.5. Others
- 10.2. Market Analysis, Insights and Forecast - by Channel
- 10.2.1. Online
- 10.2.2. Offline
- 10.1. Market Analysis, Insights and Forecast - by Insurance Line
- 11. United Arab Emirates Embedded Insurance Market Analysis, Insights and Forecast, 2019-2031
- 11.1. Market Analysis, Insights and Forecast - by Insurance Line
- 11.1.1. Electronics
- 11.1.2. Furniture
- 11.1.3. Sports Equipment
- 11.1.4. Travel Insurance
- 11.1.5. Others
- 11.2. Market Analysis, Insights and Forecast - by Channel
- 11.2.1. Online
- 11.2.2. Offline
- 11.1. Market Analysis, Insights and Forecast - by Insurance Line
- 12. Competitive Analysis
- 12.1. Global Market Share Analysis 2024
- 12.2. Company Profiles
- 12.2.1 Cover Genius
- 12.2.1.1. Overview
- 12.2.1.2. Products
- 12.2.1.3. SWOT Analysis
- 12.2.1.4. Recent Developments
- 12.2.1.5. Financials (Based on Availability)
- 12.2.2 Penn Io
- 12.2.2.1. Overview
- 12.2.2.2. Products
- 12.2.2.3. SWOT Analysis
- 12.2.2.4. Recent Developments
- 12.2.2.5. Financials (Based on Availability)
- 12.2.3 Lemonade
- 12.2.3.1. Overview
- 12.2.3.2. Products
- 12.2.3.3. SWOT Analysis
- 12.2.3.4. Recent Developments
- 12.2.3.5. Financials (Based on Availability)
- 12.2.4 FetchaQuote
- 12.2.4.1. Overview
- 12.2.4.2. Products
- 12.2.4.3. SWOT Analysis
- 12.2.4.4. Recent Developments
- 12.2.4.5. Financials (Based on Availability)
- 12.2.5 Fletch
- 12.2.5.1. Overview
- 12.2.5.2. Products
- 12.2.5.3. SWOT Analysis
- 12.2.5.4. Recent Developments
- 12.2.5.5. Financials (Based on Availability)
- 12.2.6 Bubble
- 12.2.6.1. Overview
- 12.2.6.2. Products
- 12.2.6.3. SWOT Analysis
- 12.2.6.4. Recent Developments
- 12.2.6.5. Financials (Based on Availability)
- 12.2.7 Companjon
- 12.2.7.1. Overview
- 12.2.7.2. Products
- 12.2.7.3. SWOT Analysis
- 12.2.7.4. Recent Developments
- 12.2.7.5. Financials (Based on Availability)
- 12.2.8 Rein
- 12.2.8.1. Overview
- 12.2.8.2. Products
- 12.2.8.3. SWOT Analysis
- 12.2.8.4. Recent Developments
- 12.2.8.5. Financials (Based on Availability)
- 12.2.9 Mulberri
- 12.2.9.1. Overview
- 12.2.9.2. Products
- 12.2.9.3. SWOT Analysis
- 12.2.9.4. Recent Developments
- 12.2.9.5. Financials (Based on Availability)
- 12.2.10 Qover
- 12.2.10.1. Overview
- 12.2.10.2. Products
- 12.2.10.3. SWOT Analysis
- 12.2.10.4. Recent Developments
- 12.2.10.5. Financials (Based on Availability)
- 12.2.11 Bolttech
- 12.2.11.1. Overview
- 12.2.11.2. Products
- 12.2.11.3. SWOT Analysis
- 12.2.11.4. Recent Developments
- 12.2.11.5. Financials (Based on Availability)
- 12.2.12 Igloo
- 12.2.12.1. Overview
- 12.2.12.2. Products
- 12.2.12.3. SWOT Analysis
- 12.2.12.4. Recent Developments
- 12.2.12.5. Financials (Based on Availability)
- 12.2.13 Assurant
- 12.2.13.1. Overview
- 12.2.13.2. Products
- 12.2.13.3. SWOT Analysis
- 12.2.13.4. Recent Developments
- 12.2.13.5. Financials (Based on Availability)
- 12.2.14 Bsurance
- 12.2.14.1. Overview
- 12.2.14.2. Products
- 12.2.14.3. SWOT Analysis
- 12.2.14.4. Recent Developments
- 12.2.14.5. Financials (Based on Availability)
- 12.2.15 Extend**List Not Exhaustive
- 12.2.15.1. Overview
- 12.2.15.2. Products
- 12.2.15.3. SWOT Analysis
- 12.2.15.4. Recent Developments
- 12.2.15.5. Financials (Based on Availability)
- 12.2.1 Cover Genius
List of Figures
- Figure 1: Global Embedded Insurance Market Revenue Breakdown (Million, %) by Region 2024 & 2032
- Figure 2: Global Embedded Insurance Market Volume Breakdown (Billion, %) by Region 2024 & 2032
- Figure 3: North America Embedded Insurance Market Revenue (Million), by Insurance Line 2024 & 2032
- Figure 4: North America Embedded Insurance Market Volume (Billion), by Insurance Line 2024 & 2032
- Figure 5: North America Embedded Insurance Market Revenue Share (%), by Insurance Line 2024 & 2032
- Figure 6: North America Embedded Insurance Market Volume Share (%), by Insurance Line 2024 & 2032
- Figure 7: North America Embedded Insurance Market Revenue (Million), by Channel 2024 & 2032
- Figure 8: North America Embedded Insurance Market Volume (Billion), by Channel 2024 & 2032
- Figure 9: North America Embedded Insurance Market Revenue Share (%), by Channel 2024 & 2032
- Figure 10: North America Embedded Insurance Market Volume Share (%), by Channel 2024 & 2032
- Figure 11: North America Embedded Insurance Market Revenue (Million), by Country 2024 & 2032
- Figure 12: North America Embedded Insurance Market Volume (Billion), by Country 2024 & 2032
- Figure 13: North America Embedded Insurance Market Revenue Share (%), by Country 2024 & 2032
- Figure 14: North America Embedded Insurance Market Volume Share (%), by Country 2024 & 2032
- Figure 15: Europe Embedded Insurance Market Revenue (Million), by Insurance Line 2024 & 2032
- Figure 16: Europe Embedded Insurance Market Volume (Billion), by Insurance Line 2024 & 2032
- Figure 17: Europe Embedded Insurance Market Revenue Share (%), by Insurance Line 2024 & 2032
- Figure 18: Europe Embedded Insurance Market Volume Share (%), by Insurance Line 2024 & 2032
- Figure 19: Europe Embedded Insurance Market Revenue (Million), by Channel 2024 & 2032
- Figure 20: Europe Embedded Insurance Market Volume (Billion), by Channel 2024 & 2032
- Figure 21: Europe Embedded Insurance Market Revenue Share (%), by Channel 2024 & 2032
- Figure 22: Europe Embedded Insurance Market Volume Share (%), by Channel 2024 & 2032
- Figure 23: Europe Embedded Insurance Market Revenue (Million), by Country 2024 & 2032
- Figure 24: Europe Embedded Insurance Market Volume (Billion), by Country 2024 & 2032
- Figure 25: Europe Embedded Insurance Market Revenue Share (%), by Country 2024 & 2032
- Figure 26: Europe Embedded Insurance Market Volume Share (%), by Country 2024 & 2032
- Figure 27: Asia Pacific Embedded Insurance Market Revenue (Million), by Insurance Line 2024 & 2032
- Figure 28: Asia Pacific Embedded Insurance Market Volume (Billion), by Insurance Line 2024 & 2032
- Figure 29: Asia Pacific Embedded Insurance Market Revenue Share (%), by Insurance Line 2024 & 2032
- Figure 30: Asia Pacific Embedded Insurance Market Volume Share (%), by Insurance Line 2024 & 2032
- Figure 31: Asia Pacific Embedded Insurance Market Revenue (Million), by Channel 2024 & 2032
- Figure 32: Asia Pacific Embedded Insurance Market Volume (Billion), by Channel 2024 & 2032
- Figure 33: Asia Pacific Embedded Insurance Market Revenue Share (%), by Channel 2024 & 2032
- Figure 34: Asia Pacific Embedded Insurance Market Volume Share (%), by Channel 2024 & 2032
- Figure 35: Asia Pacific Embedded Insurance Market Revenue (Million), by Country 2024 & 2032
- Figure 36: Asia Pacific Embedded Insurance Market Volume (Billion), by Country 2024 & 2032
- Figure 37: Asia Pacific Embedded Insurance Market Revenue Share (%), by Country 2024 & 2032
- Figure 38: Asia Pacific Embedded Insurance Market Volume Share (%), by Country 2024 & 2032
- Figure 39: Latin America Embedded Insurance Market Revenue (Million), by Insurance Line 2024 & 2032
- Figure 40: Latin America Embedded Insurance Market Volume (Billion), by Insurance Line 2024 & 2032
- Figure 41: Latin America Embedded Insurance Market Revenue Share (%), by Insurance Line 2024 & 2032
- Figure 42: Latin America Embedded Insurance Market Volume Share (%), by Insurance Line 2024 & 2032
- Figure 43: Latin America Embedded Insurance Market Revenue (Million), by Channel 2024 & 2032
- Figure 44: Latin America Embedded Insurance Market Volume (Billion), by Channel 2024 & 2032
- Figure 45: Latin America Embedded Insurance Market Revenue Share (%), by Channel 2024 & 2032
- Figure 46: Latin America Embedded Insurance Market Volume Share (%), by Channel 2024 & 2032
- Figure 47: Latin America Embedded Insurance Market Revenue (Million), by Country 2024 & 2032
- Figure 48: Latin America Embedded Insurance Market Volume (Billion), by Country 2024 & 2032
- Figure 49: Latin America Embedded Insurance Market Revenue Share (%), by Country 2024 & 2032
- Figure 50: Latin America Embedded Insurance Market Volume Share (%), by Country 2024 & 2032
- Figure 51: Middle East Embedded Insurance Market Revenue (Million), by Insurance Line 2024 & 2032
- Figure 52: Middle East Embedded Insurance Market Volume (Billion), by Insurance Line 2024 & 2032
- Figure 53: Middle East Embedded Insurance Market Revenue Share (%), by Insurance Line 2024 & 2032
- Figure 54: Middle East Embedded Insurance Market Volume Share (%), by Insurance Line 2024 & 2032
- Figure 55: Middle East Embedded Insurance Market Revenue (Million), by Channel 2024 & 2032
- Figure 56: Middle East Embedded Insurance Market Volume (Billion), by Channel 2024 & 2032
- Figure 57: Middle East Embedded Insurance Market Revenue Share (%), by Channel 2024 & 2032
- Figure 58: Middle East Embedded Insurance Market Volume Share (%), by Channel 2024 & 2032
- Figure 59: Middle East Embedded Insurance Market Revenue (Million), by Country 2024 & 2032
- Figure 60: Middle East Embedded Insurance Market Volume (Billion), by Country 2024 & 2032
- Figure 61: Middle East Embedded Insurance Market Revenue Share (%), by Country 2024 & 2032
- Figure 62: Middle East Embedded Insurance Market Volume Share (%), by Country 2024 & 2032
- Figure 63: United Arab Emirates Embedded Insurance Market Revenue (Million), by Insurance Line 2024 & 2032
- Figure 64: United Arab Emirates Embedded Insurance Market Volume (Billion), by Insurance Line 2024 & 2032
- Figure 65: United Arab Emirates Embedded Insurance Market Revenue Share (%), by Insurance Line 2024 & 2032
- Figure 66: United Arab Emirates Embedded Insurance Market Volume Share (%), by Insurance Line 2024 & 2032
- Figure 67: United Arab Emirates Embedded Insurance Market Revenue (Million), by Channel 2024 & 2032
- Figure 68: United Arab Emirates Embedded Insurance Market Volume (Billion), by Channel 2024 & 2032
- Figure 69: United Arab Emirates Embedded Insurance Market Revenue Share (%), by Channel 2024 & 2032
- Figure 70: United Arab Emirates Embedded Insurance Market Volume Share (%), by Channel 2024 & 2032
- Figure 71: United Arab Emirates Embedded Insurance Market Revenue (Million), by Country 2024 & 2032
- Figure 72: United Arab Emirates Embedded Insurance Market Volume (Billion), by Country 2024 & 2032
- Figure 73: United Arab Emirates Embedded Insurance Market Revenue Share (%), by Country 2024 & 2032
- Figure 74: United Arab Emirates Embedded Insurance Market Volume Share (%), by Country 2024 & 2032
List of Tables
- Table 1: Global Embedded Insurance Market Revenue Million Forecast, by Region 2019 & 2032
- Table 2: Global Embedded Insurance Market Volume Billion Forecast, by Region 2019 & 2032
- Table 3: Global Embedded Insurance Market Revenue Million Forecast, by Insurance Line 2019 & 2032
- Table 4: Global Embedded Insurance Market Volume Billion Forecast, by Insurance Line 2019 & 2032
- Table 5: Global Embedded Insurance Market Revenue Million Forecast, by Channel 2019 & 2032
- Table 6: Global Embedded Insurance Market Volume Billion Forecast, by Channel 2019 & 2032
- Table 7: Global Embedded Insurance Market Revenue Million Forecast, by Region 2019 & 2032
- Table 8: Global Embedded Insurance Market Volume Billion Forecast, by Region 2019 & 2032
- Table 9: Global Embedded Insurance Market Revenue Million Forecast, by Insurance Line 2019 & 2032
- Table 10: Global Embedded Insurance Market Volume Billion Forecast, by Insurance Line 2019 & 2032
- Table 11: Global Embedded Insurance Market Revenue Million Forecast, by Channel 2019 & 2032
- Table 12: Global Embedded Insurance Market Volume Billion Forecast, by Channel 2019 & 2032
- Table 13: Global Embedded Insurance Market Revenue Million Forecast, by Country 2019 & 2032
- Table 14: Global Embedded Insurance Market Volume Billion Forecast, by Country 2019 & 2032
- Table 15: United States Embedded Insurance Market Revenue (Million) Forecast, by Application 2019 & 2032
- Table 16: United States Embedded Insurance Market Volume (Billion) Forecast, by Application 2019 & 2032
- Table 17: Canada Embedded Insurance Market Revenue (Million) Forecast, by Application 2019 & 2032
- Table 18: Canada Embedded Insurance Market Volume (Billion) Forecast, by Application 2019 & 2032
- Table 19: Global Embedded Insurance Market Revenue Million Forecast, by Insurance Line 2019 & 2032
- Table 20: Global Embedded Insurance Market Volume Billion Forecast, by Insurance Line 2019 & 2032
- Table 21: Global Embedded Insurance Market Revenue Million Forecast, by Channel 2019 & 2032
- Table 22: Global Embedded Insurance Market Volume Billion Forecast, by Channel 2019 & 2032
- Table 23: Global Embedded Insurance Market Revenue Million Forecast, by Country 2019 & 2032
- Table 24: Global Embedded Insurance Market Volume Billion Forecast, by Country 2019 & 2032
- Table 25: United Kingdom Embedded Insurance Market Revenue (Million) Forecast, by Application 2019 & 2032
- Table 26: United Kingdom Embedded Insurance Market Volume (Billion) Forecast, by Application 2019 & 2032
- Table 27: France Embedded Insurance Market Revenue (Million) Forecast, by Application 2019 & 2032
- Table 28: France Embedded Insurance Market Volume (Billion) Forecast, by Application 2019 & 2032
- Table 29: Italy Embedded Insurance Market Revenue (Million) Forecast, by Application 2019 & 2032
- Table 30: Italy Embedded Insurance Market Volume (Billion) Forecast, by Application 2019 & 2032
- Table 31: Spain Embedded Insurance Market Revenue (Million) Forecast, by Application 2019 & 2032
- Table 32: Spain Embedded Insurance Market Volume (Billion) Forecast, by Application 2019 & 2032
- Table 33: Rest of Europe Embedded Insurance Market Revenue (Million) Forecast, by Application 2019 & 2032
- Table 34: Rest of Europe Embedded Insurance Market Volume (Billion) Forecast, by Application 2019 & 2032
- Table 35: Global Embedded Insurance Market Revenue Million Forecast, by Insurance Line 2019 & 2032
- Table 36: Global Embedded Insurance Market Volume Billion Forecast, by Insurance Line 2019 & 2032
- Table 37: Global Embedded Insurance Market Revenue Million Forecast, by Channel 2019 & 2032
- Table 38: Global Embedded Insurance Market Volume Billion Forecast, by Channel 2019 & 2032
- Table 39: Global Embedded Insurance Market Revenue Million Forecast, by Country 2019 & 2032
- Table 40: Global Embedded Insurance Market Volume Billion Forecast, by Country 2019 & 2032
- Table 41: China Embedded Insurance Market Revenue (Million) Forecast, by Application 2019 & 2032
- Table 42: China Embedded Insurance Market Volume (Billion) Forecast, by Application 2019 & 2032
- Table 43: India Embedded Insurance Market Revenue (Million) Forecast, by Application 2019 & 2032
- Table 44: India Embedded Insurance Market Volume (Billion) Forecast, by Application 2019 & 2032
- Table 45: Japan Embedded Insurance Market Revenue (Million) Forecast, by Application 2019 & 2032
- Table 46: Japan Embedded Insurance Market Volume (Billion) Forecast, by Application 2019 & 2032
- Table 47: Rest of Asia Pacific Embedded Insurance Market Revenue (Million) Forecast, by Application 2019 & 2032
- Table 48: Rest of Asia Pacific Embedded Insurance Market Volume (Billion) Forecast, by Application 2019 & 2032
- Table 49: Global Embedded Insurance Market Revenue Million Forecast, by Insurance Line 2019 & 2032
- Table 50: Global Embedded Insurance Market Volume Billion Forecast, by Insurance Line 2019 & 2032
- Table 51: Global Embedded Insurance Market Revenue Million Forecast, by Channel 2019 & 2032
- Table 52: Global Embedded Insurance Market Volume Billion Forecast, by Channel 2019 & 2032
- Table 53: Global Embedded Insurance Market Revenue Million Forecast, by Country 2019 & 2032
- Table 54: Global Embedded Insurance Market Volume Billion Forecast, by Country 2019 & 2032
- Table 55: Mexico Embedded Insurance Market Revenue (Million) Forecast, by Application 2019 & 2032
- Table 56: Mexico Embedded Insurance Market Volume (Billion) Forecast, by Application 2019 & 2032
- Table 57: Brazil Embedded Insurance Market Revenue (Million) Forecast, by Application 2019 & 2032
- Table 58: Brazil Embedded Insurance Market Volume (Billion) Forecast, by Application 2019 & 2032
- Table 59: Rest of Latin America Embedded Insurance Market Revenue (Million) Forecast, by Application 2019 & 2032
- Table 60: Rest of Latin America Embedded Insurance Market Volume (Billion) Forecast, by Application 2019 & 2032
- Table 61: Global Embedded Insurance Market Revenue Million Forecast, by Insurance Line 2019 & 2032
- Table 62: Global Embedded Insurance Market Volume Billion Forecast, by Insurance Line 2019 & 2032
- Table 63: Global Embedded Insurance Market Revenue Million Forecast, by Channel 2019 & 2032
- Table 64: Global Embedded Insurance Market Volume Billion Forecast, by Channel 2019 & 2032
- Table 65: Global Embedded Insurance Market Revenue Million Forecast, by Country 2019 & 2032
- Table 66: Global Embedded Insurance Market Volume Billion Forecast, by Country 2019 & 2032
- Table 67: Global Embedded Insurance Market Revenue Million Forecast, by Insurance Line 2019 & 2032
- Table 68: Global Embedded Insurance Market Volume Billion Forecast, by Insurance Line 2019 & 2032
- Table 69: Global Embedded Insurance Market Revenue Million Forecast, by Channel 2019 & 2032
- Table 70: Global Embedded Insurance Market Volume Billion Forecast, by Channel 2019 & 2032
- Table 71: Global Embedded Insurance Market Revenue Million Forecast, by Country 2019 & 2032
- Table 72: Global Embedded Insurance Market Volume Billion Forecast, by Country 2019 & 2032
- Table 73: Saudi Arabia Embedded Insurance Market Revenue (Million) Forecast, by Application 2019 & 2032
- Table 74: Saudi Arabia Embedded Insurance Market Volume (Billion) Forecast, by Application 2019 & 2032
- Table 75: South Africa Embedded Insurance Market Revenue (Million) Forecast, by Application 2019 & 2032
- Table 76: South Africa Embedded Insurance Market Volume (Billion) Forecast, by Application 2019 & 2032
- Table 77: Rest of Middle East Embedded Insurance Market Revenue (Million) Forecast, by Application 2019 & 2032
- Table 78: Rest of Middle East Embedded Insurance Market Volume (Billion) Forecast, by Application 2019 & 2032
Frequently Asked Questions
1. What is the projected Compound Annual Growth Rate (CAGR) of the Embedded Insurance Market?
The projected CAGR is approximately 35.14%.
2. Which companies are prominent players in the Embedded Insurance Market?
Key companies in the market include Cover Genius, Penn Io, Lemonade, FetchaQuote, Fletch, Bubble, Companjon, Rein, Mulberri, Qover, Bolttech, Igloo, Assurant, Bsurance, Extend**List Not Exhaustive.
3. What are the main segments of the Embedded Insurance Market?
The market segments include Insurance Line, Channel.
4. Can you provide details about the market size?
The market size is estimated to be USD 156.06 Million as of 2022.
5. What are some drivers contributing to market growth?
N/A
6. What are the notable trends driving market growth?
Increasing Life Insurance Premiums is Fuelling the Market.
7. Are there any restraints impacting market growth?
N/A
8. Can you provide examples of recent developments in the market?
November 2023: NJJ, a telecommunications conglomerate, collaborated with Bolttech, an Insurtech company, to offer mobile device insurance for mobile operators.
9. What pricing options are available for accessing the report?
Pricing options include single-user, multi-user, and enterprise licenses priced at USD 4750, USD 5250, and USD 8750 respectively.
10. Is the market size provided in terms of value or volume?
The market size is provided in terms of value, measured in Million and volume, measured in Billion.
11. Are there any specific market keywords associated with the report?
Yes, the market keyword associated with the report is "Embedded Insurance Market," which aids in identifying and referencing the specific market segment covered.
12. How do I determine which pricing option suits my needs best?
The pricing options vary based on user requirements and access needs. Individual users may opt for single-user licenses, while businesses requiring broader access may choose multi-user or enterprise licenses for cost-effective access to the report.
13. Are there any additional resources or data provided in the Embedded Insurance Market report?
While the report offers comprehensive insights, it's advisable to review the specific contents or supplementary materials provided to ascertain if additional resources or data are available.
14. How can I stay updated on further developments or reports in the Embedded Insurance Market?
To stay informed about further developments, trends, and reports in the Embedded Insurance Market, consider subscribing to industry newsletters, following relevant companies and organizations, or regularly checking reputable industry news sources and publications.
Methodology
Step 1 - Identification of Relevant Samples Size from Population Database


Step 2 - Approaches for Defining Global Market Size (Value, Volume* & Price*)

Note*: In applicable scenarios
Step 3 - Data Sources
Primary Research
- Web Analytics
- Survey Reports
- Research Institute
- Latest Research Reports
- Opinion Leaders
Secondary Research
- Annual Reports
- White Paper
- Latest Press Release
- Industry Association
- Paid Database
- Investor Presentations

Step 4 - Data Triangulation
Involves using different sources of information in order to increase the validity of a study
These sources are likely to be stakeholders in a program - participants, other researchers, program staff, other community members, and so on.
Then we put all data in single framework & apply various statistical tools to find out the dynamic on the market.
During the analysis stage, feedback from the stakeholder groups would be compared to determine areas of agreement as well as areas of divergence
