

Key Insights
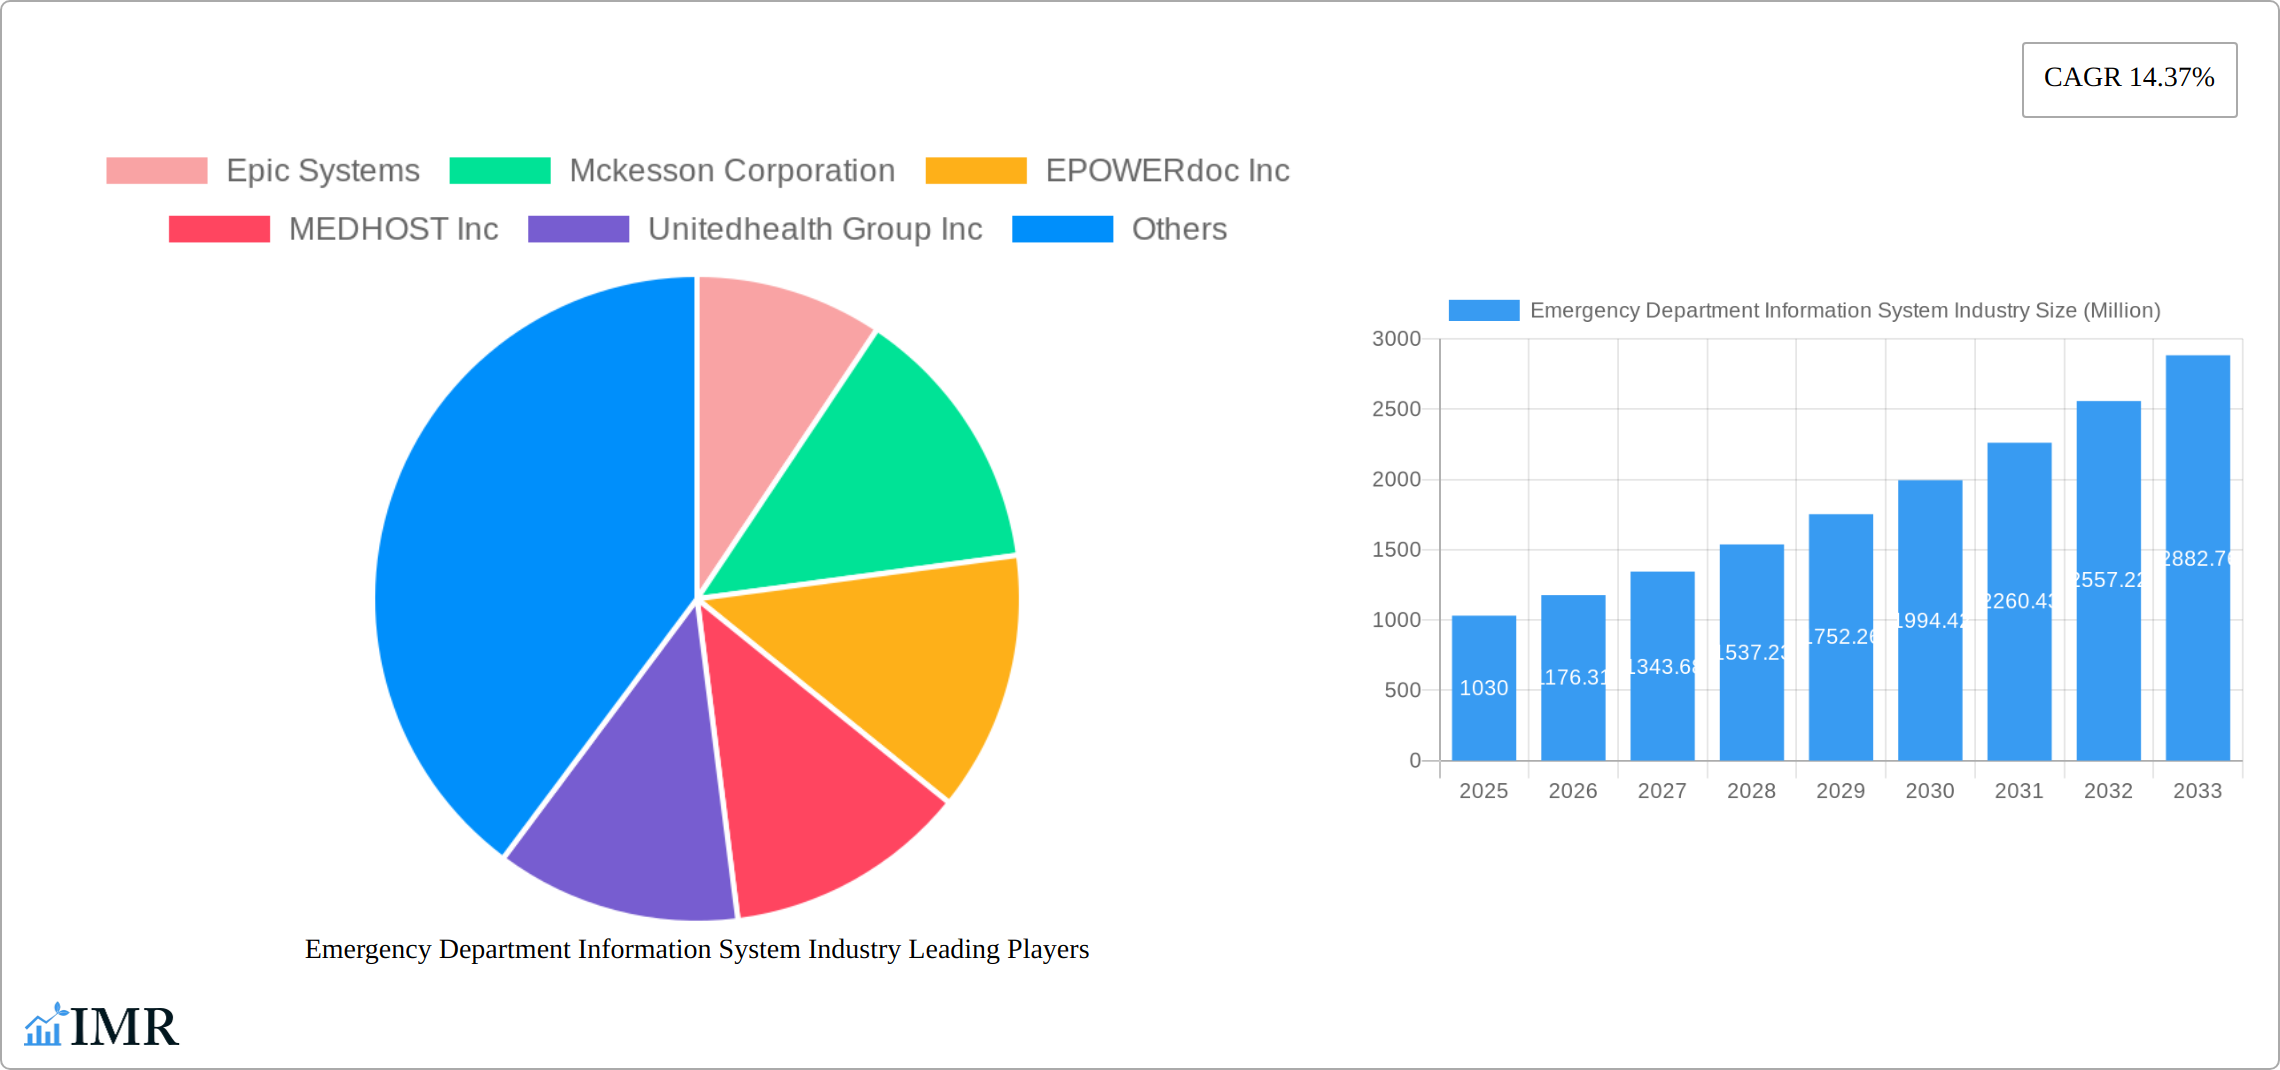
The Emergency Department Information System (EDIS) market is experiencing robust growth, projected to reach $1.03 billion in 2025 and maintain a Compound Annual Growth Rate (CAGR) of 14.37% from 2025 to 2033. This expansion is fueled by several key drivers. The increasing volume of patients in emergency departments necessitates efficient and streamlined workflows, making EDIS solutions crucial for improving patient care and operational efficiency. Furthermore, the rising adoption of electronic health records (EHRs) and the increasing emphasis on interoperability are driving the demand for integrated EDIS solutions. Government initiatives promoting the digitization of healthcare and improving data security also contribute significantly to market growth. The market is segmented by application (CPOE, clinical documentation, patient tracking, e-prescribing, others), deployment (on-premise, SaaS), software type (enterprise, best-of-breed), and end-user (small, medium, and large hospitals). The SaaS deployment model is expected to witness significant growth due to its scalability, cost-effectiveness, and accessibility. Competitive forces are strong, with established players like Epic Systems and Cerner Corporation alongside emerging innovative companies continuously striving to improve functionalities and offer specialized solutions. Geographical expansion is another key factor, with North America currently holding the largest market share, followed by Europe and the Asia-Pacific region. However, developing economies in Asia and Africa present significant untapped potential for future growth.
The restraints to market growth primarily revolve around high initial investment costs for implementing EDIS, the complexity of integrating with existing healthcare infrastructure, and concerns about data security and privacy. However, the long-term benefits in terms of improved patient outcomes, reduced operational costs, and enhanced healthcare quality are likely to outweigh these initial challenges. The increasing availability of affordable and user-friendly EDIS solutions, coupled with ongoing technological advancements like artificial intelligence and machine learning integration, are expected to further propel market expansion in the coming years. The continued focus on improving interoperability and streamlining data exchange across different healthcare systems will be crucial for realizing the full potential of EDIS in enhancing the efficiency and effectiveness of emergency departments globally.
Emergency Department Information System (EDIS) Industry Market Report: 2019-2033
This comprehensive report provides an in-depth analysis of the Emergency Department Information System (EDIS) industry, encompassing market dynamics, growth trends, competitive landscape, and future outlook. The study period covers 2019-2033, with a base year of 2025 and a forecast period of 2025-2033. The report segments the market by application, deployment, software type, and end-user, offering granular insights into key market drivers and challenges. The total market size is projected at XX Million in 2025 and is expected to reach XX Million by 2033.
Emergency Department Information System Industry Market Dynamics & Structure
The EDIS market is characterized by a moderately concentrated landscape with key players like Epic Systems, McKesson Corporation, and Cerner Corporation holding significant market share. Technological innovation, particularly in AI and machine learning, is a primary growth driver, enhancing diagnostic capabilities and streamlining workflows. Stringent regulatory frameworks, such as HIPAA compliance, influence market dynamics, while the increasing adoption of cloud-based solutions (SaaS) presents a significant shift in deployment models. The market faces competition from alternative solutions focusing on specific ED needs and from legacy systems in smaller facilities. M&A activity in the sector has been moderate, with xx deals recorded between 2019 and 2024.
- Market Concentration: Highly concentrated, with top 5 players holding approximately xx% market share in 2024.
- Technological Innovation: AI-powered diagnostics, improved interoperability, and cloud-based solutions are key drivers.
- Regulatory Landscape: HIPAA and other regulations significantly impact system design and implementation.
- Competitive Substitutes: Specialized applications and legacy systems pose competition, particularly in smaller hospitals.
- End-User Demographics: Growth driven by large hospitals, followed by medium-sized and small hospitals.
- M&A Trends: Moderate M&A activity, with xx deals completed in 2019-2024, indicating consolidation.
Emergency Department Information System Industry Growth Trends & Insights
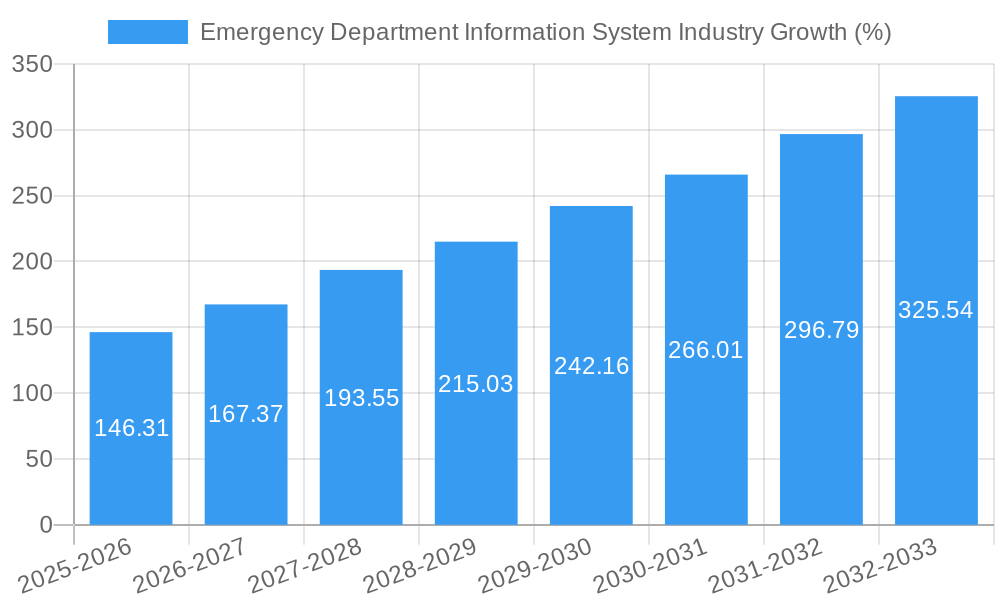
The EDIS market experienced significant growth between 2019 and 2024, driven by increased demand for improved patient care, reduced wait times, and enhanced operational efficiency. The market is expected to maintain a robust CAGR of xx% during the forecast period (2025-2033). Increased adoption of CPOE, clinical documentation systems, and patient tracking & triage solutions is pushing market growth. The shift towards cloud-based solutions (SaaS) is accelerating adoption among smaller hospitals. Technological disruptions, such as AI-powered diagnostics and predictive analytics, will further fuel market growth. Consumer behavior shifts favoring improved patient experience and access to digital health records are also significant drivers.
Dominant Regions, Countries, or Segments in Emergency Department Information System Industry
North America currently dominates the EDIS market, driven by high healthcare expenditure, technological advancements, and a strong presence of major vendors. Within the application segment, Computerized Physician Order Entry (CPOE) and Patient Tracking & Triage are witnessing the highest growth, owing to their direct impact on efficiency and patient safety. In terms of deployment, SaaS is gaining traction due to its scalability, cost-effectiveness, and accessibility. Large hospitals constitute the largest segment of end-users, benefiting from the comprehensive functionalities offered by enterprise-level solutions.
- Leading Region: North America
- Leading Application Segment: CPOE and Patient Tracking & Triage
- Leading Deployment Model: SaaS experiencing significant growth.
- Leading End-User: Large hospitals
- Key Growth Drivers: Increased healthcare spending, technological advancements, improved interoperability.
Emergency Department Information System Industry Product Landscape
EDIS solutions are increasingly incorporating advanced features, including AI-powered diagnostic tools, predictive analytics, and seamless integration with other healthcare IT systems. These advancements enhance accuracy, improve decision-making, and streamline workflow efficiency. Unique selling propositions (USPs) often include user-friendly interfaces, enhanced security features, and customizable modules. Product innovation focuses on improving interoperability, incorporating real-time data analytics, and providing mobile access for healthcare providers.
Key Drivers, Barriers & Challenges in Emergency Department Information System Industry
Key Drivers: Increasing demand for improved patient care, regulatory pressures for EHR adoption, technological advancements like AI & machine learning, and the need for enhanced operational efficiency.
Challenges: High implementation costs, integration complexities with existing systems, data security concerns, and the need for ongoing training and support. The market also faces challenges relating to interoperability issues between different systems and maintaining data privacy across different platforms. These challenges can lead to significant delays in implementation and increased costs for healthcare providers. The impact of these challenges is estimated to reduce market growth by approximately xx% in 2025.
Emerging Opportunities in Emergency Department Information System Industry
Emerging opportunities exist in the integration of telehealth capabilities, the expansion into untapped markets in developing economies, and the development of specialized EDIS solutions for niche applications. The adoption of AI-powered diagnostic tools and predictive analytics will also present growth opportunities, allowing for earlier detection of critical conditions and improved patient outcomes.
Growth Accelerators in the Emergency Department Information System Industry
Long-term growth will be fueled by advancements in AI and machine learning, strategic partnerships between EDIS vendors and healthcare providers, and the expansion into underserved markets. Government initiatives promoting digital health and interoperability will further accelerate market growth. Innovations in remote patient monitoring and integration with wearable health devices will also drive adoption and enhance the value proposition of EDIS solutions.
Key Players Shaping the Emergency Department Information System Market
- Epic Systems
- Mckesson Corporation
- EPOWERdoc Inc
- MEDHOST Inc
- Unitedhealth Group Inc
- Cerner Corporation
- Medical Information Technology Inc
- Logibec Canada
- Allscripts Healthcare Solutions Inc
- T-Systems Inc
- Evident
- Medsphere Systems Corporation
Notable Milestones in Emergency Department Information System Industry Sector
- March 2022: HeartBeam, Inc. signed a BAA and CTA with Phoebe Putney Health System to evaluate its ED MI software.
- January 2022: Aidoc partnered with Novant Health to integrate its AI platform for improved triage and patient outcomes.
In-Depth Emergency Department Information System Industry Market Outlook
The future of the EDIS market looks promising, driven by continued technological advancements, increasing demand for efficient healthcare solutions, and favorable regulatory environments. Strategic partnerships and acquisitions are expected to shape the industry landscape, leading to further consolidation and innovation. The focus will be on enhancing interoperability, improving data analytics capabilities, and incorporating AI-powered tools to optimize patient care and reduce operational costs. This translates into significant growth potential for vendors who can adapt to changing market dynamics and deliver innovative, user-friendly solutions.
Emergency Department Information System Industry Segmentation
-
1. Application
- 1.1. Computerized Physician Order Entry (CPOE)
- 1.2. Clinical Documentation
- 1.3. Patient Tracking & Triage
- 1.4. E-Prescribing
- 1.5. Others
-
2. Deployment
- 2.1. On-Premise EDIS
- 2.2. Software-As-A-Services (SaaS)
-
3. Software Type
- 3.1. Enterprise Solutions
- 3.2. Best of Breed (B.O.B.) Solutions
-
4. End User
- 4.1. Small Hospitals
- 4.2. Medium-Sized Hospitals
- 4.3. Large Hospitals
Emergency Department Information System Industry Segmentation By Geography
-
1. North America
- 1.1. United States
- 1.2. Canada
- 1.3. Mexico
-
2. Europe
- 2.1. Germany
- 2.2. United Kingdom
- 2.3. France
- 2.4. Italy
- 2.5. Spain
- 2.6. Rest of Europe
-
3. Asia Pacific
- 3.1. China
- 3.2. Japan
- 3.3. India
- 3.4. Australia
- 3.5. South Korea
- 3.6. Rest of Asia Pacific
-
4. Middle East and Africa
- 4.1. GCC
- 4.2. South Africa
- 4.3. Rest of Middle East and Africa
-
5. South America
- 5.1. Brazil
- 5.2. Argentina
- 5.3. Rest of South America

Emergency Department Information System Industry REPORT HIGHLIGHTS
| Aspects | Details |
|---|---|
| Study Period | 2019-2033 |
| Base Year | 2024 |
| Estimated Year | 2025 |
| Forecast Period | 2025-2033 |
| Historical Period | 2019-2024 |
| Growth Rate | CAGR of 14.37% from 2019-2033 |
| Segmentation |
|
Table of Contents
- 1. Introduction
- 1.1. Research Scope
- 1.2. Market Segmentation
- 1.3. Research Methodology
- 1.4. Definitions and Assumptions
- 2. Executive Summary
- 2.1. Introduction
- 3. Market Dynamics
- 3.1. Introduction
- 3.2. Market Drivers
- 3.2.1. Rise in the Geriatric Population; Increasing Use Of Data-Driven Technologies; Increase in Number of Insured Population
- 3.3. Market Restrains
- 3.3.1. Adverse Quality and Safety Implications Of EDIS; Lack of Skilled Healthcare IT Professionals
- 3.4. Market Trends
- 3.4.1. Best of Breed (B.O.B.) Solutions are Anticipated to be the Dominant Segment in Software Type During the Forecast Period
- 4. Market Factor Analysis
- 4.1. Porters Five Forces
- 4.2. Supply/Value Chain
- 4.3. PESTEL analysis
- 4.4. Market Entropy
- 4.5. Patent/Trademark Analysis
- 5. Global Emergency Department Information System Industry Analysis, Insights and Forecast, 2019-2031
- 5.1. Market Analysis, Insights and Forecast - by Application
- 5.1.1. Computerized Physician Order Entry (CPOE)
- 5.1.2. Clinical Documentation
- 5.1.3. Patient Tracking & Triage
- 5.1.4. E-Prescribing
- 5.1.5. Others
- 5.2. Market Analysis, Insights and Forecast - by Deployment
- 5.2.1. On-Premise EDIS
- 5.2.2. Software-As-A-Services (SaaS)
- 5.3. Market Analysis, Insights and Forecast - by Software Type
- 5.3.1. Enterprise Solutions
- 5.3.2. Best of Breed (B.O.B.) Solutions
- 5.4. Market Analysis, Insights and Forecast - by End User
- 5.4.1. Small Hospitals
- 5.4.2. Medium-Sized Hospitals
- 5.4.3. Large Hospitals
- 5.5. Market Analysis, Insights and Forecast - by Region
- 5.5.1. North America
- 5.5.2. Europe
- 5.5.3. Asia Pacific
- 5.5.4. Middle East and Africa
- 5.5.5. South America
- 5.1. Market Analysis, Insights and Forecast - by Application
- 6. North America Emergency Department Information System Industry Analysis, Insights and Forecast, 2019-2031
- 6.1. Market Analysis, Insights and Forecast - by Application
- 6.1.1. Computerized Physician Order Entry (CPOE)
- 6.1.2. Clinical Documentation
- 6.1.3. Patient Tracking & Triage
- 6.1.4. E-Prescribing
- 6.1.5. Others
- 6.2. Market Analysis, Insights and Forecast - by Deployment
- 6.2.1. On-Premise EDIS
- 6.2.2. Software-As-A-Services (SaaS)
- 6.3. Market Analysis, Insights and Forecast - by Software Type
- 6.3.1. Enterprise Solutions
- 6.3.2. Best of Breed (B.O.B.) Solutions
- 6.4. Market Analysis, Insights and Forecast - by End User
- 6.4.1. Small Hospitals
- 6.4.2. Medium-Sized Hospitals
- 6.4.3. Large Hospitals
- 6.1. Market Analysis, Insights and Forecast - by Application
- 7. Europe Emergency Department Information System Industry Analysis, Insights and Forecast, 2019-2031
- 7.1. Market Analysis, Insights and Forecast - by Application
- 7.1.1. Computerized Physician Order Entry (CPOE)
- 7.1.2. Clinical Documentation
- 7.1.3. Patient Tracking & Triage
- 7.1.4. E-Prescribing
- 7.1.5. Others
- 7.2. Market Analysis, Insights and Forecast - by Deployment
- 7.2.1. On-Premise EDIS
- 7.2.2. Software-As-A-Services (SaaS)
- 7.3. Market Analysis, Insights and Forecast - by Software Type
- 7.3.1. Enterprise Solutions
- 7.3.2. Best of Breed (B.O.B.) Solutions
- 7.4. Market Analysis, Insights and Forecast - by End User
- 7.4.1. Small Hospitals
- 7.4.2. Medium-Sized Hospitals
- 7.4.3. Large Hospitals
- 7.1. Market Analysis, Insights and Forecast - by Application
- 8. Asia Pacific Emergency Department Information System Industry Analysis, Insights and Forecast, 2019-2031
- 8.1. Market Analysis, Insights and Forecast - by Application
- 8.1.1. Computerized Physician Order Entry (CPOE)
- 8.1.2. Clinical Documentation
- 8.1.3. Patient Tracking & Triage
- 8.1.4. E-Prescribing
- 8.1.5. Others
- 8.2. Market Analysis, Insights and Forecast - by Deployment
- 8.2.1. On-Premise EDIS
- 8.2.2. Software-As-A-Services (SaaS)
- 8.3. Market Analysis, Insights and Forecast - by Software Type
- 8.3.1. Enterprise Solutions
- 8.3.2. Best of Breed (B.O.B.) Solutions
- 8.4. Market Analysis, Insights and Forecast - by End User
- 8.4.1. Small Hospitals
- 8.4.2. Medium-Sized Hospitals
- 8.4.3. Large Hospitals
- 8.1. Market Analysis, Insights and Forecast - by Application
- 9. Middle East and Africa Emergency Department Information System Industry Analysis, Insights and Forecast, 2019-2031
- 9.1. Market Analysis, Insights and Forecast - by Application
- 9.1.1. Computerized Physician Order Entry (CPOE)
- 9.1.2. Clinical Documentation
- 9.1.3. Patient Tracking & Triage
- 9.1.4. E-Prescribing
- 9.1.5. Others
- 9.2. Market Analysis, Insights and Forecast - by Deployment
- 9.2.1. On-Premise EDIS
- 9.2.2. Software-As-A-Services (SaaS)
- 9.3. Market Analysis, Insights and Forecast - by Software Type
- 9.3.1. Enterprise Solutions
- 9.3.2. Best of Breed (B.O.B.) Solutions
- 9.4. Market Analysis, Insights and Forecast - by End User
- 9.4.1. Small Hospitals
- 9.4.2. Medium-Sized Hospitals
- 9.4.3. Large Hospitals
- 9.1. Market Analysis, Insights and Forecast - by Application
- 10. South America Emergency Department Information System Industry Analysis, Insights and Forecast, 2019-2031
- 10.1. Market Analysis, Insights and Forecast - by Application
- 10.1.1. Computerized Physician Order Entry (CPOE)
- 10.1.2. Clinical Documentation
- 10.1.3. Patient Tracking & Triage
- 10.1.4. E-Prescribing
- 10.1.5. Others
- 10.2. Market Analysis, Insights and Forecast - by Deployment
- 10.2.1. On-Premise EDIS
- 10.2.2. Software-As-A-Services (SaaS)
- 10.3. Market Analysis, Insights and Forecast - by Software Type
- 10.3.1. Enterprise Solutions
- 10.3.2. Best of Breed (B.O.B.) Solutions
- 10.4. Market Analysis, Insights and Forecast - by End User
- 10.4.1. Small Hospitals
- 10.4.2. Medium-Sized Hospitals
- 10.4.3. Large Hospitals
- 10.1. Market Analysis, Insights and Forecast - by Application
- 11. North America Emergency Department Information System Industry Analysis, Insights and Forecast, 2019-2031
- 11.1. Market Analysis, Insights and Forecast - By Country/Sub-region
- 11.1.1 United States
- 11.1.2 Canada
- 11.1.3 Mexico
- 12. Europe Emergency Department Information System Industry Analysis, Insights and Forecast, 2019-2031
- 12.1. Market Analysis, Insights and Forecast - By Country/Sub-region
- 12.1.1 Germany
- 12.1.2 United Kingdom
- 12.1.3 France
- 12.1.4 Italy
- 12.1.5 Spain
- 12.1.6 Rest of Europe
- 13. Asia Pacific Emergency Department Information System Industry Analysis, Insights and Forecast, 2019-2031
- 13.1. Market Analysis, Insights and Forecast - By Country/Sub-region
- 13.1.1 China
- 13.1.2 Japan
- 13.1.3 India
- 13.1.4 Australia
- 13.1.5 South Korea
- 13.1.6 Rest of Asia Pacific
- 14. Middle East and Africa Emergency Department Information System Industry Analysis, Insights and Forecast, 2019-2031
- 14.1. Market Analysis, Insights and Forecast - By Country/Sub-region
- 14.1.1 GCC
- 14.1.2 South Africa
- 14.1.3 Rest of Middle East and Africa
- 15. South America Emergency Department Information System Industry Analysis, Insights and Forecast, 2019-2031
- 15.1. Market Analysis, Insights and Forecast - By Country/Sub-region
- 15.1.1 Brazil
- 15.1.2 Argentina
- 15.1.3 Rest of South America
- 16. Competitive Analysis
- 16.1. Global Market Share Analysis 2024
- 16.2. Company Profiles
- 16.2.1 Epic Systems
- 16.2.1.1. Overview
- 16.2.1.2. Products
- 16.2.1.3. SWOT Analysis
- 16.2.1.4. Recent Developments
- 16.2.1.5. Financials (Based on Availability)
- 16.2.2 Mckesson Corporation
- 16.2.2.1. Overview
- 16.2.2.2. Products
- 16.2.2.3. SWOT Analysis
- 16.2.2.4. Recent Developments
- 16.2.2.5. Financials (Based on Availability)
- 16.2.3 EPOWERdoc Inc
- 16.2.3.1. Overview
- 16.2.3.2. Products
- 16.2.3.3. SWOT Analysis
- 16.2.3.4. Recent Developments
- 16.2.3.5. Financials (Based on Availability)
- 16.2.4 MEDHOST Inc
- 16.2.4.1. Overview
- 16.2.4.2. Products
- 16.2.4.3. SWOT Analysis
- 16.2.4.4. Recent Developments
- 16.2.4.5. Financials (Based on Availability)
- 16.2.5 Unitedhealth Group Inc
- 16.2.5.1. Overview
- 16.2.5.2. Products
- 16.2.5.3. SWOT Analysis
- 16.2.5.4. Recent Developments
- 16.2.5.5. Financials (Based on Availability)
- 16.2.6 Cerner Corporation
- 16.2.6.1. Overview
- 16.2.6.2. Products
- 16.2.6.3. SWOT Analysis
- 16.2.6.4. Recent Developments
- 16.2.6.5. Financials (Based on Availability)
- 16.2.7 Medical Information Technology Inc
- 16.2.7.1. Overview
- 16.2.7.2. Products
- 16.2.7.3. SWOT Analysis
- 16.2.7.4. Recent Developments
- 16.2.7.5. Financials (Based on Availability)
- 16.2.8 Logibec Canada
- 16.2.8.1. Overview
- 16.2.8.2. Products
- 16.2.8.3. SWOT Analysis
- 16.2.8.4. Recent Developments
- 16.2.8.5. Financials (Based on Availability)
- 16.2.9 Allscripts Healthcare Solutions Inc
- 16.2.9.1. Overview
- 16.2.9.2. Products
- 16.2.9.3. SWOT Analysis
- 16.2.9.4. Recent Developments
- 16.2.9.5. Financials (Based on Availability)
- 16.2.10 T-Systems Inc
- 16.2.10.1. Overview
- 16.2.10.2. Products
- 16.2.10.3. SWOT Analysis
- 16.2.10.4. Recent Developments
- 16.2.10.5. Financials (Based on Availability)
- 16.2.11 Evident
- 16.2.11.1. Overview
- 16.2.11.2. Products
- 16.2.11.3. SWOT Analysis
- 16.2.11.4. Recent Developments
- 16.2.11.5. Financials (Based on Availability)
- 16.2.12 Medsphere Systems Corporation
- 16.2.12.1. Overview
- 16.2.12.2. Products
- 16.2.12.3. SWOT Analysis
- 16.2.12.4. Recent Developments
- 16.2.12.5. Financials (Based on Availability)
- 16.2.1 Epic Systems
List of Figures
- Figure 1: Global Emergency Department Information System Industry Revenue Breakdown (Million, %) by Region 2024 & 2032
- Figure 2: Global Emergency Department Information System Industry Volume Breakdown (K Unit, %) by Region 2024 & 2032
- Figure 3: North America Emergency Department Information System Industry Revenue (Million), by Country 2024 & 2032
- Figure 4: North America Emergency Department Information System Industry Volume (K Unit), by Country 2024 & 2032
- Figure 5: North America Emergency Department Information System Industry Revenue Share (%), by Country 2024 & 2032
- Figure 6: North America Emergency Department Information System Industry Volume Share (%), by Country 2024 & 2032
- Figure 7: Europe Emergency Department Information System Industry Revenue (Million), by Country 2024 & 2032
- Figure 8: Europe Emergency Department Information System Industry Volume (K Unit), by Country 2024 & 2032
- Figure 9: Europe Emergency Department Information System Industry Revenue Share (%), by Country 2024 & 2032
- Figure 10: Europe Emergency Department Information System Industry Volume Share (%), by Country 2024 & 2032
- Figure 11: Asia Pacific Emergency Department Information System Industry Revenue (Million), by Country 2024 & 2032
- Figure 12: Asia Pacific Emergency Department Information System Industry Volume (K Unit), by Country 2024 & 2032
- Figure 13: Asia Pacific Emergency Department Information System Industry Revenue Share (%), by Country 2024 & 2032
- Figure 14: Asia Pacific Emergency Department Information System Industry Volume Share (%), by Country 2024 & 2032
- Figure 15: Middle East and Africa Emergency Department Information System Industry Revenue (Million), by Country 2024 & 2032
- Figure 16: Middle East and Africa Emergency Department Information System Industry Volume (K Unit), by Country 2024 & 2032
- Figure 17: Middle East and Africa Emergency Department Information System Industry Revenue Share (%), by Country 2024 & 2032
- Figure 18: Middle East and Africa Emergency Department Information System Industry Volume Share (%), by Country 2024 & 2032
- Figure 19: South America Emergency Department Information System Industry Revenue (Million), by Country 2024 & 2032
- Figure 20: South America Emergency Department Information System Industry Volume (K Unit), by Country 2024 & 2032
- Figure 21: South America Emergency Department Information System Industry Revenue Share (%), by Country 2024 & 2032
- Figure 22: South America Emergency Department Information System Industry Volume Share (%), by Country 2024 & 2032
- Figure 23: North America Emergency Department Information System Industry Revenue (Million), by Application 2024 & 2032
- Figure 24: North America Emergency Department Information System Industry Volume (K Unit), by Application 2024 & 2032
- Figure 25: North America Emergency Department Information System Industry Revenue Share (%), by Application 2024 & 2032
- Figure 26: North America Emergency Department Information System Industry Volume Share (%), by Application 2024 & 2032
- Figure 27: North America Emergency Department Information System Industry Revenue (Million), by Deployment 2024 & 2032
- Figure 28: North America Emergency Department Information System Industry Volume (K Unit), by Deployment 2024 & 2032
- Figure 29: North America Emergency Department Information System Industry Revenue Share (%), by Deployment 2024 & 2032
- Figure 30: North America Emergency Department Information System Industry Volume Share (%), by Deployment 2024 & 2032
- Figure 31: North America Emergency Department Information System Industry Revenue (Million), by Software Type 2024 & 2032
- Figure 32: North America Emergency Department Information System Industry Volume (K Unit), by Software Type 2024 & 2032
- Figure 33: North America Emergency Department Information System Industry Revenue Share (%), by Software Type 2024 & 2032
- Figure 34: North America Emergency Department Information System Industry Volume Share (%), by Software Type 2024 & 2032
- Figure 35: North America Emergency Department Information System Industry Revenue (Million), by End User 2024 & 2032
- Figure 36: North America Emergency Department Information System Industry Volume (K Unit), by End User 2024 & 2032
- Figure 37: North America Emergency Department Information System Industry Revenue Share (%), by End User 2024 & 2032
- Figure 38: North America Emergency Department Information System Industry Volume Share (%), by End User 2024 & 2032
- Figure 39: North America Emergency Department Information System Industry Revenue (Million), by Country 2024 & 2032
- Figure 40: North America Emergency Department Information System Industry Volume (K Unit), by Country 2024 & 2032
- Figure 41: North America Emergency Department Information System Industry Revenue Share (%), by Country 2024 & 2032
- Figure 42: North America Emergency Department Information System Industry Volume Share (%), by Country 2024 & 2032
- Figure 43: Europe Emergency Department Information System Industry Revenue (Million), by Application 2024 & 2032
- Figure 44: Europe Emergency Department Information System Industry Volume (K Unit), by Application 2024 & 2032
- Figure 45: Europe Emergency Department Information System Industry Revenue Share (%), by Application 2024 & 2032
- Figure 46: Europe Emergency Department Information System Industry Volume Share (%), by Application 2024 & 2032
- Figure 47: Europe Emergency Department Information System Industry Revenue (Million), by Deployment 2024 & 2032
- Figure 48: Europe Emergency Department Information System Industry Volume (K Unit), by Deployment 2024 & 2032
- Figure 49: Europe Emergency Department Information System Industry Revenue Share (%), by Deployment 2024 & 2032
- Figure 50: Europe Emergency Department Information System Industry Volume Share (%), by Deployment 2024 & 2032
- Figure 51: Europe Emergency Department Information System Industry Revenue (Million), by Software Type 2024 & 2032
- Figure 52: Europe Emergency Department Information System Industry Volume (K Unit), by Software Type 2024 & 2032
- Figure 53: Europe Emergency Department Information System Industry Revenue Share (%), by Software Type 2024 & 2032
- Figure 54: Europe Emergency Department Information System Industry Volume Share (%), by Software Type 2024 & 2032
- Figure 55: Europe Emergency Department Information System Industry Revenue (Million), by End User 2024 & 2032
- Figure 56: Europe Emergency Department Information System Industry Volume (K Unit), by End User 2024 & 2032
- Figure 57: Europe Emergency Department Information System Industry Revenue Share (%), by End User 2024 & 2032
- Figure 58: Europe Emergency Department Information System Industry Volume Share (%), by End User 2024 & 2032
- Figure 59: Europe Emergency Department Information System Industry Revenue (Million), by Country 2024 & 2032
- Figure 60: Europe Emergency Department Information System Industry Volume (K Unit), by Country 2024 & 2032
- Figure 61: Europe Emergency Department Information System Industry Revenue Share (%), by Country 2024 & 2032
- Figure 62: Europe Emergency Department Information System Industry Volume Share (%), by Country 2024 & 2032
- Figure 63: Asia Pacific Emergency Department Information System Industry Revenue (Million), by Application 2024 & 2032
- Figure 64: Asia Pacific Emergency Department Information System Industry Volume (K Unit), by Application 2024 & 2032
- Figure 65: Asia Pacific Emergency Department Information System Industry Revenue Share (%), by Application 2024 & 2032
- Figure 66: Asia Pacific Emergency Department Information System Industry Volume Share (%), by Application 2024 & 2032
- Figure 67: Asia Pacific Emergency Department Information System Industry Revenue (Million), by Deployment 2024 & 2032
- Figure 68: Asia Pacific Emergency Department Information System Industry Volume (K Unit), by Deployment 2024 & 2032
- Figure 69: Asia Pacific Emergency Department Information System Industry Revenue Share (%), by Deployment 2024 & 2032
- Figure 70: Asia Pacific Emergency Department Information System Industry Volume Share (%), by Deployment 2024 & 2032
- Figure 71: Asia Pacific Emergency Department Information System Industry Revenue (Million), by Software Type 2024 & 2032
- Figure 72: Asia Pacific Emergency Department Information System Industry Volume (K Unit), by Software Type 2024 & 2032
- Figure 73: Asia Pacific Emergency Department Information System Industry Revenue Share (%), by Software Type 2024 & 2032
- Figure 74: Asia Pacific Emergency Department Information System Industry Volume Share (%), by Software Type 2024 & 2032
- Figure 75: Asia Pacific Emergency Department Information System Industry Revenue (Million), by End User 2024 & 2032
- Figure 76: Asia Pacific Emergency Department Information System Industry Volume (K Unit), by End User 2024 & 2032
- Figure 77: Asia Pacific Emergency Department Information System Industry Revenue Share (%), by End User 2024 & 2032
- Figure 78: Asia Pacific Emergency Department Information System Industry Volume Share (%), by End User 2024 & 2032
- Figure 79: Asia Pacific Emergency Department Information System Industry Revenue (Million), by Country 2024 & 2032
- Figure 80: Asia Pacific Emergency Department Information System Industry Volume (K Unit), by Country 2024 & 2032
- Figure 81: Asia Pacific Emergency Department Information System Industry Revenue Share (%), by Country 2024 & 2032
- Figure 82: Asia Pacific Emergency Department Information System Industry Volume Share (%), by Country 2024 & 2032
- Figure 83: Middle East and Africa Emergency Department Information System Industry Revenue (Million), by Application 2024 & 2032
- Figure 84: Middle East and Africa Emergency Department Information System Industry Volume (K Unit), by Application 2024 & 2032
- Figure 85: Middle East and Africa Emergency Department Information System Industry Revenue Share (%), by Application 2024 & 2032
- Figure 86: Middle East and Africa Emergency Department Information System Industry Volume Share (%), by Application 2024 & 2032
- Figure 87: Middle East and Africa Emergency Department Information System Industry Revenue (Million), by Deployment 2024 & 2032
- Figure 88: Middle East and Africa Emergency Department Information System Industry Volume (K Unit), by Deployment 2024 & 2032
- Figure 89: Middle East and Africa Emergency Department Information System Industry Revenue Share (%), by Deployment 2024 & 2032
- Figure 90: Middle East and Africa Emergency Department Information System Industry Volume Share (%), by Deployment 2024 & 2032
- Figure 91: Middle East and Africa Emergency Department Information System Industry Revenue (Million), by Software Type 2024 & 2032
- Figure 92: Middle East and Africa Emergency Department Information System Industry Volume (K Unit), by Software Type 2024 & 2032
- Figure 93: Middle East and Africa Emergency Department Information System Industry Revenue Share (%), by Software Type 2024 & 2032
- Figure 94: Middle East and Africa Emergency Department Information System Industry Volume Share (%), by Software Type 2024 & 2032
- Figure 95: Middle East and Africa Emergency Department Information System Industry Revenue (Million), by End User 2024 & 2032
- Figure 96: Middle East and Africa Emergency Department Information System Industry Volume (K Unit), by End User 2024 & 2032
- Figure 97: Middle East and Africa Emergency Department Information System Industry Revenue Share (%), by End User 2024 & 2032
- Figure 98: Middle East and Africa Emergency Department Information System Industry Volume Share (%), by End User 2024 & 2032
- Figure 99: Middle East and Africa Emergency Department Information System Industry Revenue (Million), by Country 2024 & 2032
- Figure 100: Middle East and Africa Emergency Department Information System Industry Volume (K Unit), by Country 2024 & 2032
- Figure 101: Middle East and Africa Emergency Department Information System Industry Revenue Share (%), by Country 2024 & 2032
- Figure 102: Middle East and Africa Emergency Department Information System Industry Volume Share (%), by Country 2024 & 2032
- Figure 103: South America Emergency Department Information System Industry Revenue (Million), by Application 2024 & 2032
- Figure 104: South America Emergency Department Information System Industry Volume (K Unit), by Application 2024 & 2032
- Figure 105: South America Emergency Department Information System Industry Revenue Share (%), by Application 2024 & 2032
- Figure 106: South America Emergency Department Information System Industry Volume Share (%), by Application 2024 & 2032
- Figure 107: South America Emergency Department Information System Industry Revenue (Million), by Deployment 2024 & 2032
- Figure 108: South America Emergency Department Information System Industry Volume (K Unit), by Deployment 2024 & 2032
- Figure 109: South America Emergency Department Information System Industry Revenue Share (%), by Deployment 2024 & 2032
- Figure 110: South America Emergency Department Information System Industry Volume Share (%), by Deployment 2024 & 2032
- Figure 111: South America Emergency Department Information System Industry Revenue (Million), by Software Type 2024 & 2032
- Figure 112: South America Emergency Department Information System Industry Volume (K Unit), by Software Type 2024 & 2032
- Figure 113: South America Emergency Department Information System Industry Revenue Share (%), by Software Type 2024 & 2032
- Figure 114: South America Emergency Department Information System Industry Volume Share (%), by Software Type 2024 & 2032
- Figure 115: South America Emergency Department Information System Industry Revenue (Million), by End User 2024 & 2032
- Figure 116: South America Emergency Department Information System Industry Volume (K Unit), by End User 2024 & 2032
- Figure 117: South America Emergency Department Information System Industry Revenue Share (%), by End User 2024 & 2032
- Figure 118: South America Emergency Department Information System Industry Volume Share (%), by End User 2024 & 2032
- Figure 119: South America Emergency Department Information System Industry Revenue (Million), by Country 2024 & 2032
- Figure 120: South America Emergency Department Information System Industry Volume (K Unit), by Country 2024 & 2032
- Figure 121: South America Emergency Department Information System Industry Revenue Share (%), by Country 2024 & 2032
- Figure 122: South America Emergency Department Information System Industry Volume Share (%), by Country 2024 & 2032
List of Tables
- Table 1: Global Emergency Department Information System Industry Revenue Million Forecast, by Region 2019 & 2032
- Table 2: Global Emergency Department Information System Industry Volume K Unit Forecast, by Region 2019 & 2032
- Table 3: Global Emergency Department Information System Industry Revenue Million Forecast, by Application 2019 & 2032
- Table 4: Global Emergency Department Information System Industry Volume K Unit Forecast, by Application 2019 & 2032
- Table 5: Global Emergency Department Information System Industry Revenue Million Forecast, by Deployment 2019 & 2032
- Table 6: Global Emergency Department Information System Industry Volume K Unit Forecast, by Deployment 2019 & 2032
- Table 7: Global Emergency Department Information System Industry Revenue Million Forecast, by Software Type 2019 & 2032
- Table 8: Global Emergency Department Information System Industry Volume K Unit Forecast, by Software Type 2019 & 2032
- Table 9: Global Emergency Department Information System Industry Revenue Million Forecast, by End User 2019 & 2032
- Table 10: Global Emergency Department Information System Industry Volume K Unit Forecast, by End User 2019 & 2032
- Table 11: Global Emergency Department Information System Industry Revenue Million Forecast, by Region 2019 & 2032
- Table 12: Global Emergency Department Information System Industry Volume K Unit Forecast, by Region 2019 & 2032
- Table 13: Global Emergency Department Information System Industry Revenue Million Forecast, by Country 2019 & 2032
- Table 14: Global Emergency Department Information System Industry Volume K Unit Forecast, by Country 2019 & 2032
- Table 15: United States Emergency Department Information System Industry Revenue (Million) Forecast, by Application 2019 & 2032
- Table 16: United States Emergency Department Information System Industry Volume (K Unit) Forecast, by Application 2019 & 2032
- Table 17: Canada Emergency Department Information System Industry Revenue (Million) Forecast, by Application 2019 & 2032
- Table 18: Canada Emergency Department Information System Industry Volume (K Unit) Forecast, by Application 2019 & 2032
- Table 19: Mexico Emergency Department Information System Industry Revenue (Million) Forecast, by Application 2019 & 2032
- Table 20: Mexico Emergency Department Information System Industry Volume (K Unit) Forecast, by Application 2019 & 2032
- Table 21: Global Emergency Department Information System Industry Revenue Million Forecast, by Country 2019 & 2032
- Table 22: Global Emergency Department Information System Industry Volume K Unit Forecast, by Country 2019 & 2032
- Table 23: Germany Emergency Department Information System Industry Revenue (Million) Forecast, by Application 2019 & 2032
- Table 24: Germany Emergency Department Information System Industry Volume (K Unit) Forecast, by Application 2019 & 2032
- Table 25: United Kingdom Emergency Department Information System Industry Revenue (Million) Forecast, by Application 2019 & 2032
- Table 26: United Kingdom Emergency Department Information System Industry Volume (K Unit) Forecast, by Application 2019 & 2032
- Table 27: France Emergency Department Information System Industry Revenue (Million) Forecast, by Application 2019 & 2032
- Table 28: France Emergency Department Information System Industry Volume (K Unit) Forecast, by Application 2019 & 2032
- Table 29: Italy Emergency Department Information System Industry Revenue (Million) Forecast, by Application 2019 & 2032
- Table 30: Italy Emergency Department Information System Industry Volume (K Unit) Forecast, by Application 2019 & 2032
- Table 31: Spain Emergency Department Information System Industry Revenue (Million) Forecast, by Application 2019 & 2032
- Table 32: Spain Emergency Department Information System Industry Volume (K Unit) Forecast, by Application 2019 & 2032
- Table 33: Rest of Europe Emergency Department Information System Industry Revenue (Million) Forecast, by Application 2019 & 2032
- Table 34: Rest of Europe Emergency Department Information System Industry Volume (K Unit) Forecast, by Application 2019 & 2032
- Table 35: Global Emergency Department Information System Industry Revenue Million Forecast, by Country 2019 & 2032
- Table 36: Global Emergency Department Information System Industry Volume K Unit Forecast, by Country 2019 & 2032
- Table 37: China Emergency Department Information System Industry Revenue (Million) Forecast, by Application 2019 & 2032
- Table 38: China Emergency Department Information System Industry Volume (K Unit) Forecast, by Application 2019 & 2032
- Table 39: Japan Emergency Department Information System Industry Revenue (Million) Forecast, by Application 2019 & 2032
- Table 40: Japan Emergency Department Information System Industry Volume (K Unit) Forecast, by Application 2019 & 2032
- Table 41: India Emergency Department Information System Industry Revenue (Million) Forecast, by Application 2019 & 2032
- Table 42: India Emergency Department Information System Industry Volume (K Unit) Forecast, by Application 2019 & 2032
- Table 43: Australia Emergency Department Information System Industry Revenue (Million) Forecast, by Application 2019 & 2032
- Table 44: Australia Emergency Department Information System Industry Volume (K Unit) Forecast, by Application 2019 & 2032
- Table 45: South Korea Emergency Department Information System Industry Revenue (Million) Forecast, by Application 2019 & 2032
- Table 46: South Korea Emergency Department Information System Industry Volume (K Unit) Forecast, by Application 2019 & 2032
- Table 47: Rest of Asia Pacific Emergency Department Information System Industry Revenue (Million) Forecast, by Application 2019 & 2032
- Table 48: Rest of Asia Pacific Emergency Department Information System Industry Volume (K Unit) Forecast, by Application 2019 & 2032
- Table 49: Global Emergency Department Information System Industry Revenue Million Forecast, by Country 2019 & 2032
- Table 50: Global Emergency Department Information System Industry Volume K Unit Forecast, by Country 2019 & 2032
- Table 51: GCC Emergency Department Information System Industry Revenue (Million) Forecast, by Application 2019 & 2032
- Table 52: GCC Emergency Department Information System Industry Volume (K Unit) Forecast, by Application 2019 & 2032
- Table 53: South Africa Emergency Department Information System Industry Revenue (Million) Forecast, by Application 2019 & 2032
- Table 54: South Africa Emergency Department Information System Industry Volume (K Unit) Forecast, by Application 2019 & 2032
- Table 55: Rest of Middle East and Africa Emergency Department Information System Industry Revenue (Million) Forecast, by Application 2019 & 2032
- Table 56: Rest of Middle East and Africa Emergency Department Information System Industry Volume (K Unit) Forecast, by Application 2019 & 2032
- Table 57: Global Emergency Department Information System Industry Revenue Million Forecast, by Country 2019 & 2032
- Table 58: Global Emergency Department Information System Industry Volume K Unit Forecast, by Country 2019 & 2032
- Table 59: Brazil Emergency Department Information System Industry Revenue (Million) Forecast, by Application 2019 & 2032
- Table 60: Brazil Emergency Department Information System Industry Volume (K Unit) Forecast, by Application 2019 & 2032
- Table 61: Argentina Emergency Department Information System Industry Revenue (Million) Forecast, by Application 2019 & 2032
- Table 62: Argentina Emergency Department Information System Industry Volume (K Unit) Forecast, by Application 2019 & 2032
- Table 63: Rest of South America Emergency Department Information System Industry Revenue (Million) Forecast, by Application 2019 & 2032
- Table 64: Rest of South America Emergency Department Information System Industry Volume (K Unit) Forecast, by Application 2019 & 2032
- Table 65: Global Emergency Department Information System Industry Revenue Million Forecast, by Application 2019 & 2032
- Table 66: Global Emergency Department Information System Industry Volume K Unit Forecast, by Application 2019 & 2032
- Table 67: Global Emergency Department Information System Industry Revenue Million Forecast, by Deployment 2019 & 2032
- Table 68: Global Emergency Department Information System Industry Volume K Unit Forecast, by Deployment 2019 & 2032
- Table 69: Global Emergency Department Information System Industry Revenue Million Forecast, by Software Type 2019 & 2032
- Table 70: Global Emergency Department Information System Industry Volume K Unit Forecast, by Software Type 2019 & 2032
- Table 71: Global Emergency Department Information System Industry Revenue Million Forecast, by End User 2019 & 2032
- Table 72: Global Emergency Department Information System Industry Volume K Unit Forecast, by End User 2019 & 2032
- Table 73: Global Emergency Department Information System Industry Revenue Million Forecast, by Country 2019 & 2032
- Table 74: Global Emergency Department Information System Industry Volume K Unit Forecast, by Country 2019 & 2032
- Table 75: United States Emergency Department Information System Industry Revenue (Million) Forecast, by Application 2019 & 2032
- Table 76: United States Emergency Department Information System Industry Volume (K Unit) Forecast, by Application 2019 & 2032
- Table 77: Canada Emergency Department Information System Industry Revenue (Million) Forecast, by Application 2019 & 2032
- Table 78: Canada Emergency Department Information System Industry Volume (K Unit) Forecast, by Application 2019 & 2032
- Table 79: Mexico Emergency Department Information System Industry Revenue (Million) Forecast, by Application 2019 & 2032
- Table 80: Mexico Emergency Department Information System Industry Volume (K Unit) Forecast, by Application 2019 & 2032
- Table 81: Global Emergency Department Information System Industry Revenue Million Forecast, by Application 2019 & 2032
- Table 82: Global Emergency Department Information System Industry Volume K Unit Forecast, by Application 2019 & 2032
- Table 83: Global Emergency Department Information System Industry Revenue Million Forecast, by Deployment 2019 & 2032
- Table 84: Global Emergency Department Information System Industry Volume K Unit Forecast, by Deployment 2019 & 2032
- Table 85: Global Emergency Department Information System Industry Revenue Million Forecast, by Software Type 2019 & 2032
- Table 86: Global Emergency Department Information System Industry Volume K Unit Forecast, by Software Type 2019 & 2032
- Table 87: Global Emergency Department Information System Industry Revenue Million Forecast, by End User 2019 & 2032
- Table 88: Global Emergency Department Information System Industry Volume K Unit Forecast, by End User 2019 & 2032
- Table 89: Global Emergency Department Information System Industry Revenue Million Forecast, by Country 2019 & 2032
- Table 90: Global Emergency Department Information System Industry Volume K Unit Forecast, by Country 2019 & 2032
- Table 91: Germany Emergency Department Information System Industry Revenue (Million) Forecast, by Application 2019 & 2032
- Table 92: Germany Emergency Department Information System Industry Volume (K Unit) Forecast, by Application 2019 & 2032
- Table 93: United Kingdom Emergency Department Information System Industry Revenue (Million) Forecast, by Application 2019 & 2032
- Table 94: United Kingdom Emergency Department Information System Industry Volume (K Unit) Forecast, by Application 2019 & 2032
- Table 95: France Emergency Department Information System Industry Revenue (Million) Forecast, by Application 2019 & 2032
- Table 96: France Emergency Department Information System Industry Volume (K Unit) Forecast, by Application 2019 & 2032
- Table 97: Italy Emergency Department Information System Industry Revenue (Million) Forecast, by Application 2019 & 2032
- Table 98: Italy Emergency Department Information System Industry Volume (K Unit) Forecast, by Application 2019 & 2032
- Table 99: Spain Emergency Department Information System Industry Revenue (Million) Forecast, by Application 2019 & 2032
- Table 100: Spain Emergency Department Information System Industry Volume (K Unit) Forecast, by Application 2019 & 2032
- Table 101: Rest of Europe Emergency Department Information System Industry Revenue (Million) Forecast, by Application 2019 & 2032
- Table 102: Rest of Europe Emergency Department Information System Industry Volume (K Unit) Forecast, by Application 2019 & 2032
- Table 103: Global Emergency Department Information System Industry Revenue Million Forecast, by Application 2019 & 2032
- Table 104: Global Emergency Department Information System Industry Volume K Unit Forecast, by Application 2019 & 2032
- Table 105: Global Emergency Department Information System Industry Revenue Million Forecast, by Deployment 2019 & 2032
- Table 106: Global Emergency Department Information System Industry Volume K Unit Forecast, by Deployment 2019 & 2032
- Table 107: Global Emergency Department Information System Industry Revenue Million Forecast, by Software Type 2019 & 2032
- Table 108: Global Emergency Department Information System Industry Volume K Unit Forecast, by Software Type 2019 & 2032
- Table 109: Global Emergency Department Information System Industry Revenue Million Forecast, by End User 2019 & 2032
- Table 110: Global Emergency Department Information System Industry Volume K Unit Forecast, by End User 2019 & 2032
- Table 111: Global Emergency Department Information System Industry Revenue Million Forecast, by Country 2019 & 2032
- Table 112: Global Emergency Department Information System Industry Volume K Unit Forecast, by Country 2019 & 2032
- Table 113: China Emergency Department Information System Industry Revenue (Million) Forecast, by Application 2019 & 2032
- Table 114: China Emergency Department Information System Industry Volume (K Unit) Forecast, by Application 2019 & 2032
- Table 115: Japan Emergency Department Information System Industry Revenue (Million) Forecast, by Application 2019 & 2032
- Table 116: Japan Emergency Department Information System Industry Volume (K Unit) Forecast, by Application 2019 & 2032
- Table 117: India Emergency Department Information System Industry Revenue (Million) Forecast, by Application 2019 & 2032
- Table 118: India Emergency Department Information System Industry Volume (K Unit) Forecast, by Application 2019 & 2032
- Table 119: Australia Emergency Department Information System Industry Revenue (Million) Forecast, by Application 2019 & 2032
- Table 120: Australia Emergency Department Information System Industry Volume (K Unit) Forecast, by Application 2019 & 2032
- Table 121: South Korea Emergency Department Information System Industry Revenue (Million) Forecast, by Application 2019 & 2032
- Table 122: South Korea Emergency Department Information System Industry Volume (K Unit) Forecast, by Application 2019 & 2032
- Table 123: Rest of Asia Pacific Emergency Department Information System Industry Revenue (Million) Forecast, by Application 2019 & 2032
- Table 124: Rest of Asia Pacific Emergency Department Information System Industry Volume (K Unit) Forecast, by Application 2019 & 2032
- Table 125: Global Emergency Department Information System Industry Revenue Million Forecast, by Application 2019 & 2032
- Table 126: Global Emergency Department Information System Industry Volume K Unit Forecast, by Application 2019 & 2032
- Table 127: Global Emergency Department Information System Industry Revenue Million Forecast, by Deployment 2019 & 2032
- Table 128: Global Emergency Department Information System Industry Volume K Unit Forecast, by Deployment 2019 & 2032
- Table 129: Global Emergency Department Information System Industry Revenue Million Forecast, by Software Type 2019 & 2032
- Table 130: Global Emergency Department Information System Industry Volume K Unit Forecast, by Software Type 2019 & 2032
- Table 131: Global Emergency Department Information System Industry Revenue Million Forecast, by End User 2019 & 2032
- Table 132: Global Emergency Department Information System Industry Volume K Unit Forecast, by End User 2019 & 2032
- Table 133: Global Emergency Department Information System Industry Revenue Million Forecast, by Country 2019 & 2032
- Table 134: Global Emergency Department Information System Industry Volume K Unit Forecast, by Country 2019 & 2032
- Table 135: GCC Emergency Department Information System Industry Revenue (Million) Forecast, by Application 2019 & 2032
- Table 136: GCC Emergency Department Information System Industry Volume (K Unit) Forecast, by Application 2019 & 2032
- Table 137: South Africa Emergency Department Information System Industry Revenue (Million) Forecast, by Application 2019 & 2032
- Table 138: South Africa Emergency Department Information System Industry Volume (K Unit) Forecast, by Application 2019 & 2032
- Table 139: Rest of Middle East and Africa Emergency Department Information System Industry Revenue (Million) Forecast, by Application 2019 & 2032
- Table 140: Rest of Middle East and Africa Emergency Department Information System Industry Volume (K Unit) Forecast, by Application 2019 & 2032
- Table 141: Global Emergency Department Information System Industry Revenue Million Forecast, by Application 2019 & 2032
- Table 142: Global Emergency Department Information System Industry Volume K Unit Forecast, by Application 2019 & 2032
- Table 143: Global Emergency Department Information System Industry Revenue Million Forecast, by Deployment 2019 & 2032
- Table 144: Global Emergency Department Information System Industry Volume K Unit Forecast, by Deployment 2019 & 2032
- Table 145: Global Emergency Department Information System Industry Revenue Million Forecast, by Software Type 2019 & 2032
- Table 146: Global Emergency Department Information System Industry Volume K Unit Forecast, by Software Type 2019 & 2032
- Table 147: Global Emergency Department Information System Industry Revenue Million Forecast, by End User 2019 & 2032
- Table 148: Global Emergency Department Information System Industry Volume K Unit Forecast, by End User 2019 & 2032
- Table 149: Global Emergency Department Information System Industry Revenue Million Forecast, by Country 2019 & 2032
- Table 150: Global Emergency Department Information System Industry Volume K Unit Forecast, by Country 2019 & 2032
- Table 151: Brazil Emergency Department Information System Industry Revenue (Million) Forecast, by Application 2019 & 2032
- Table 152: Brazil Emergency Department Information System Industry Volume (K Unit) Forecast, by Application 2019 & 2032
- Table 153: Argentina Emergency Department Information System Industry Revenue (Million) Forecast, by Application 2019 & 2032
- Table 154: Argentina Emergency Department Information System Industry Volume (K Unit) Forecast, by Application 2019 & 2032
- Table 155: Rest of South America Emergency Department Information System Industry Revenue (Million) Forecast, by Application 2019 & 2032
- Table 156: Rest of South America Emergency Department Information System Industry Volume (K Unit) Forecast, by Application 2019 & 2032
Frequently Asked Questions
1. What is the projected Compound Annual Growth Rate (CAGR) of the Emergency Department Information System Industry?
The projected CAGR is approximately 14.37%.
2. Which companies are prominent players in the Emergency Department Information System Industry?
Key companies in the market include Epic Systems, Mckesson Corporation, EPOWERdoc Inc, MEDHOST Inc, Unitedhealth Group Inc, Cerner Corporation, Medical Information Technology Inc, Logibec Canada, Allscripts Healthcare Solutions Inc, T-Systems Inc, Evident, Medsphere Systems Corporation.
3. What are the main segments of the Emergency Department Information System Industry?
The market segments include Application, Deployment, Software Type, End User.
4. Can you provide details about the market size?
The market size is estimated to be USD 1.03 Million as of 2022.
5. What are some drivers contributing to market growth?
Rise in the Geriatric Population; Increasing Use Of Data-Driven Technologies; Increase in Number of Insured Population.
6. What are the notable trends driving market growth?
Best of Breed (B.O.B.) Solutions are Anticipated to be the Dominant Segment in Software Type During the Forecast Period.
7. Are there any restraints impacting market growth?
Adverse Quality and Safety Implications Of EDIS; Lack of Skilled Healthcare IT Professionals.
8. Can you provide examples of recent developments in the market?
In March 2022, HeartBeam, Inc. signed a Business Associate Agreement (BAA) and a Clinical Trial Agreement (CTA) with Phoebe Putney Health System to conduct a pilot study designed to evaluate HeartBeam's Emergency Department (ED) Myocardial Infarction (MI) software product.
9. What pricing options are available for accessing the report?
Pricing options include single-user, multi-user, and enterprise licenses priced at USD 4750, USD 5250, and USD 8750 respectively.
10. Is the market size provided in terms of value or volume?
The market size is provided in terms of value, measured in Million and volume, measured in K Unit.
11. Are there any specific market keywords associated with the report?
Yes, the market keyword associated with the report is "Emergency Department Information System Industry," which aids in identifying and referencing the specific market segment covered.
12. How do I determine which pricing option suits my needs best?
The pricing options vary based on user requirements and access needs. Individual users may opt for single-user licenses, while businesses requiring broader access may choose multi-user or enterprise licenses for cost-effective access to the report.
13. Are there any additional resources or data provided in the Emergency Department Information System Industry report?
While the report offers comprehensive insights, it's advisable to review the specific contents or supplementary materials provided to ascertain if additional resources or data are available.
14. How can I stay updated on further developments or reports in the Emergency Department Information System Industry?
To stay informed about further developments, trends, and reports in the Emergency Department Information System Industry, consider subscribing to industry newsletters, following relevant companies and organizations, or regularly checking reputable industry news sources and publications.
Methodology
Step 1 - Identification of Relevant Samples Size from Population Database


Step 2 - Approaches for Defining Global Market Size (Value, Volume* & Price*)

Note*: In applicable scenarios
Step 3 - Data Sources
Primary Research
- Web Analytics
- Survey Reports
- Research Institute
- Latest Research Reports
- Opinion Leaders
Secondary Research
- Annual Reports
- White Paper
- Latest Press Release
- Industry Association
- Paid Database
- Investor Presentations

Step 4 - Data Triangulation
Involves using different sources of information in order to increase the validity of a study
These sources are likely to be stakeholders in a program - participants, other researchers, program staff, other community members, and so on.
Then we put all data in single framework & apply various statistical tools to find out the dynamic on the market.
During the analysis stage, feedback from the stakeholder groups would be compared to determine areas of agreement as well as areas of divergence
