

Key Insights
The EU food colorant market, exhibiting a Compound Annual Growth Rate (CAGR) of 3.80% from 2019 to 2024, is poised for continued expansion. Driven by increasing consumer demand for visually appealing food products, particularly within the confectionery, bakery, and beverage sectors, the market is witnessing significant growth. The preference for natural food colorants is a prominent trend, fueled by growing health consciousness and a shift away from synthetic alternatives perceived as potentially harmful. This trend is further amplified by stringent regulations and labeling requirements across the EU, pushing manufacturers towards cleaner label solutions. However, the market faces challenges from fluctuating raw material prices and the inherent complexity of sourcing and producing natural colorants, potentially impacting overall market value. The segment breakdown reveals a substantial contribution from synthetic colorants due to their cost-effectiveness and consistent color delivery, though the natural colorant segment is expected to exhibit faster growth due to its premium positioning and health halo. Within the application segments, the beverage and confectionery sectors are currently leading the market, leveraging colorants to enhance product appeal and differentiation. Key players like Chr. Hansen, Sensient Technologies, and Givaudan are actively investing in research and development, focusing on innovative natural colorant solutions to cater to the evolving consumer preferences. The market's future growth will hinge on successfully balancing consumer demand for natural alternatives with the challenges of ensuring consistent supply and affordability.
The European Union's robust regulatory environment, particularly concerning food safety and labeling, significantly shapes market dynamics. This drives innovation towards cleaner, sustainable, and traceable food colorants. While the market is geographically diverse, key regions such as Germany, the United Kingdom, and France are significant contributors to overall revenue. Competitive intensity remains high, with major players focusing on strategic partnerships, mergers, and acquisitions to expand their product portfolios and geographic reach. Future growth hinges on successful technological advancements leading to the development of novel, sustainable natural colorants with improved stability and cost-effectiveness. This will cater to the rising consumer preferences for "clean label" products while addressing the challenges of supply chain management and price volatility. We project a continued expansion of the EU food colorant market, with specific segments—notably the natural colorants within confectionery and beverage applications—leading this growth.

EU Food Colorant Market Report: A Comprehensive Analysis (2019-2033)
This comprehensive report provides an in-depth analysis of the EU food colorant market, offering invaluable insights for industry professionals, investors, and strategic decision-makers. With a detailed examination of market dynamics, growth trends, and key players, this report equips you with the knowledge necessary to navigate this dynamic landscape. The study period spans from 2019 to 2033, with a base year of 2025 and a forecast period from 2025 to 2033. The historical period covered is 2019-2024. Market values are presented in million units.
EU Food Colorant Market Market Dynamics & Structure
The EU food colorant market is characterized by a moderately concentrated landscape, with key players such as Chr. Hansen A/S, Sensient Technologies, Dohler Group, Riken Vitamin, BASF SE, Koninklijke DSM N.V., D&D Williamson & Co, and Givaudan (Naturex) holding significant market share. However, the market also accommodates a number of smaller, specialized players. Technological innovation, particularly in natural colorants and sustainable production methods, is a key driver. Stringent EU regulations regarding food safety and labeling significantly shape the market, pushing manufacturers towards greater transparency and compliance. The market experiences competitive pressure from substitute ingredients, such as natural extracts and fruit/vegetable purees. Consumer preferences, shifting towards healthier and more natural food options, are influencing demand for natural colorants. M&A activity within the sector is moderate, driven by efforts to expand product portfolios and increase market reach.
- Market Concentration: Moderately concentrated, with top 8 players holding approximately xx% market share in 2025.
- Technological Innovation: Focus on natural colorants, sustainable sourcing, and improved color stability.
- Regulatory Landscape: Stringent EU food safety and labeling regulations drive compliance and transparency.
- Substitute Products: Natural extracts and fruit/vegetable purees pose competitive pressure.
- End-User Demographics: Growing health consciousness drives demand for natural colorants.
- M&A Activity: Moderate activity focused on portfolio expansion and market share growth. xx M&A deals observed between 2019-2024.
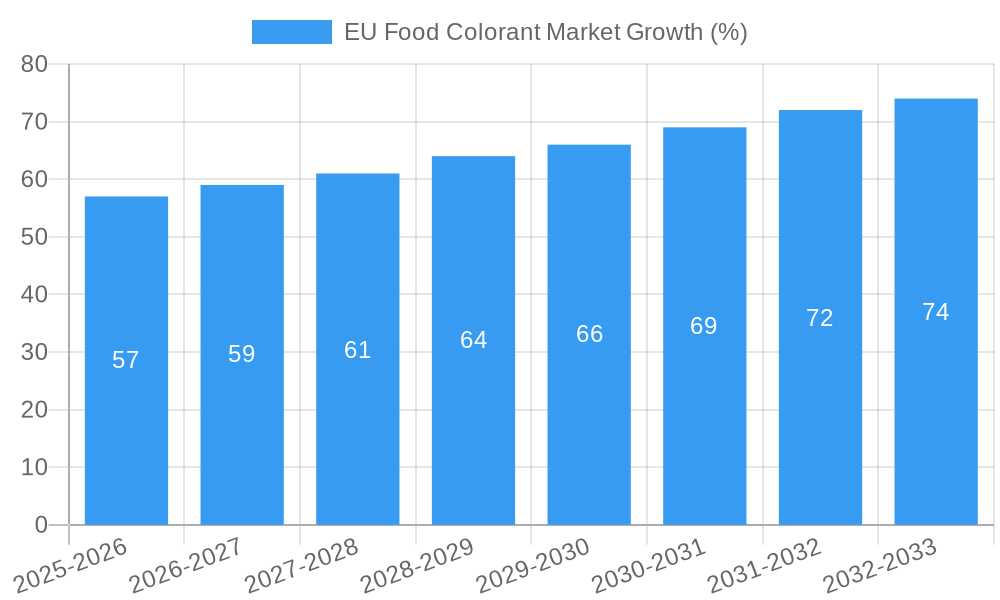
EU Food Colorant Market Growth Trends & Insights
The EU food colorant market exhibits robust growth, driven by increasing demand from the food and beverage industry, expanding consumer preference for visually appealing products, and the rise of novel food applications. The market size has witnessed a steady increase from xx million in 2019 to xx million in 2024. This growth is projected to continue at a CAGR of xx% during the forecast period (2025-2033), reaching an estimated xx million by 2033. Market penetration is highest in the confectionery and beverage sectors, while growth potential lies in expanding applications within the meat, poultry, and seafood segments. Technological disruptions, particularly in the development of natural colorants with enhanced stability and performance, are significantly influencing market trends. Consumer behavior shifts toward healthier and cleaner label products further fuel the demand for natural alternatives. Specific trends include a move towards plant-based colorants and increasing demand for certified organic colorants.
Dominant Regions, Countries, or Segments in EU Food Colorant Market
Germany, France, and the UK are the dominant markets within the EU, accounting for approximately xx% of the total market value in 2025. The natural color segment is the fastest-growing product type, driven by increasing consumer demand for natural and healthy food options. Among applications, the beverage and confectionery sectors are the largest consumers of food colorants, showcasing high market share and significant growth potential.
- Leading Region: Western Europe (Germany, France, UK)
- Fastest Growing Segment (Product Type): Natural Color
- Largest Application Segments: Beverage, Confectionery
- Key Drivers: Growing demand for visually appealing food products, increasing health consciousness, and innovative product launches. Strong food processing and manufacturing industries in leading countries contribute to high demand.
EU Food Colorant Market Product Landscape
The EU food colorant market showcases a diverse product landscape encompassing natural and synthetic colorants, each with unique applications and performance characteristics. Recent innovations focus on enhancing the stability and performance of natural colorants, addressing limitations in terms of lightfastness and heat stability. Technological advancements include the development of new extraction techniques for natural pigments and the application of nanotechnology to improve color dispersion and intensity. Unique selling propositions often center around the origin, sustainability, and purity of the colorants.
Key Drivers, Barriers & Challenges in EU Food Colorant Market
Key Drivers:
- Increasing demand for visually appealing food products.
- Growing consumer preference for natural and healthy food options.
- Technological advancements leading to improved color stability and performance.
- Expanding applications in various food and beverage categories.
Key Challenges:
- Stringent EU regulations related to food safety and labeling pose challenges for manufacturers.
- Fluctuations in raw material prices impact the cost of production.
- Intense competition among established and emerging players.
- Supply chain disruptions can lead to production delays.
Emerging Opportunities in EU Food Colorant Market
Emerging opportunities lie in the development of novel natural colorants derived from sustainable and ethically sourced materials. Untapped markets exist in the functional food and beverage segment, where colorants can contribute to product differentiation and enhanced consumer appeal. Evolving consumer preferences for personalized nutrition and customized food products present further potential. The increasing demand for clean-label products also necessitates the development of novel natural colorants that do not compromise on product quality or consumer experience.
Growth Accelerators in the EU Food Colorant Market Industry
Long-term growth is accelerated by technological breakthroughs resulting in improved color stability and vibrant colors from natural sources. Strategic partnerships between colorant manufacturers and food producers facilitate the development of innovative food and beverage products. Market expansion strategies, including penetration into emerging markets and diversification of product portfolios, further fuel market expansion.
Key Players Shaping the EU Food Colorant Market Market
- Chr. Hansen A/S
- Sensient Technologies
- Dohler Group
- Riken Vitamin
- BASF SE
- Koninklijke DSM N.V.
- D&D Williamson & Co
- Givaudan (Naturex)
- List Not Exhaustive
Notable Milestones in EU Food Colorant Market Sector
- 2020: Increased regulatory scrutiny on synthetic colorants leads to a surge in demand for natural alternatives.
- 2022: Launch of a new range of sustainably sourced natural colorants by a major player.
- 2023: Successful merger between two leading colorant manufacturers expands market presence.
- 2024: Significant investment in R&D focused on developing novel colorant extraction techniques.
In-Depth EU Food Colorant Market Market Outlook
The EU food colorant market is poised for continued growth, driven by innovative product developments, evolving consumer preferences, and expanding application areas. Strategic partnerships, acquisitions, and sustained investment in research and development will shape the market's future. The market offers significant opportunities for players who can deliver high-quality, sustainable, and innovative colorant solutions that meet the ever-evolving demands of the food and beverage industry. Growth is projected to be particularly strong in the natural colorants segment, driven by the global trend towards healthier food choices.
EU Food Colorant Market Segmentation
-
1. Product Type
- 1.1. Natural Color
- 1.2. Synthetic Color
-
2. Application
- 2.1. Beverage
- 2.2. Dairy & Frozen Product
- 2.3. Bakery
- 2.4. Meat, Poultry & Seafood
- 2.5. Confectionery
- 2.6. Others
EU Food Colorant Market Segmentation By Geography
- 1. Spain
- 2. United Kingdom
- 3. Germany
- 4. France
- 5. Italy
- 6. Russia
- 7. Rest of Europe

EU Food Colorant Market REPORT HIGHLIGHTS
| Aspects | Details |
|---|---|
| Study Period | 2019-2033 |
| Base Year | 2024 |
| Estimated Year | 2025 |
| Forecast Period | 2025-2033 |
| Historical Period | 2019-2024 |
| Growth Rate | CAGR of 3.80% from 2019-2033 |
| Segmentation |
|
Table of Contents
- 1. Introduction
- 1.1. Research Scope
- 1.2. Market Segmentation
- 1.3. Research Methodology
- 1.4. Definitions and Assumptions
- 2. Executive Summary
- 2.1. Introduction
- 3. Market Dynamics
- 3.1. Introduction
- 3.2. Market Drivers
- 3.2.1. The Rising Awareness of the Health Benefits Associated with Collagen Consumption; Rising Sport and Fitness Trends Drives the Market Growth
- 3.3. Market Restrains
- 3.3.1. Concerns over the Source and Animal Welfare in Collagen Extraction Limit the Market Growth
- 3.4. Market Trends
- 3.4.1. United Kingdom Held the Largest Market Share
- 4. Market Factor Analysis
- 4.1. Porters Five Forces
- 4.2. Supply/Value Chain
- 4.3. PESTEL analysis
- 4.4. Market Entropy
- 4.5. Patent/Trademark Analysis
- 5. Global EU Food Colorant Market Analysis, Insights and Forecast, 2019-2031
- 5.1. Market Analysis, Insights and Forecast - by Product Type
- 5.1.1. Natural Color
- 5.1.2. Synthetic Color
- 5.2. Market Analysis, Insights and Forecast - by Application
- 5.2.1. Beverage
- 5.2.2. Dairy & Frozen Product
- 5.2.3. Bakery
- 5.2.4. Meat, Poultry & Seafood
- 5.2.5. Confectionery
- 5.2.6. Others
- 5.3. Market Analysis, Insights and Forecast - by Region
- 5.3.1. Spain
- 5.3.2. United Kingdom
- 5.3.3. Germany
- 5.3.4. France
- 5.3.5. Italy
- 5.3.6. Russia
- 5.3.7. Rest of Europe
- 5.1. Market Analysis, Insights and Forecast - by Product Type
- 6. Spain EU Food Colorant Market Analysis, Insights and Forecast, 2019-2031
- 6.1. Market Analysis, Insights and Forecast - by Product Type
- 6.1.1. Natural Color
- 6.1.2. Synthetic Color
- 6.2. Market Analysis, Insights and Forecast - by Application
- 6.2.1. Beverage
- 6.2.2. Dairy & Frozen Product
- 6.2.3. Bakery
- 6.2.4. Meat, Poultry & Seafood
- 6.2.5. Confectionery
- 6.2.6. Others
- 6.1. Market Analysis, Insights and Forecast - by Product Type
- 7. United Kingdom EU Food Colorant Market Analysis, Insights and Forecast, 2019-2031
- 7.1. Market Analysis, Insights and Forecast - by Product Type
- 7.1.1. Natural Color
- 7.1.2. Synthetic Color
- 7.2. Market Analysis, Insights and Forecast - by Application
- 7.2.1. Beverage
- 7.2.2. Dairy & Frozen Product
- 7.2.3. Bakery
- 7.2.4. Meat, Poultry & Seafood
- 7.2.5. Confectionery
- 7.2.6. Others
- 7.1. Market Analysis, Insights and Forecast - by Product Type
- 8. Germany EU Food Colorant Market Analysis, Insights and Forecast, 2019-2031
- 8.1. Market Analysis, Insights and Forecast - by Product Type
- 8.1.1. Natural Color
- 8.1.2. Synthetic Color
- 8.2. Market Analysis, Insights and Forecast - by Application
- 8.2.1. Beverage
- 8.2.2. Dairy & Frozen Product
- 8.2.3. Bakery
- 8.2.4. Meat, Poultry & Seafood
- 8.2.5. Confectionery
- 8.2.6. Others
- 8.1. Market Analysis, Insights and Forecast - by Product Type
- 9. France EU Food Colorant Market Analysis, Insights and Forecast, 2019-2031
- 9.1. Market Analysis, Insights and Forecast - by Product Type
- 9.1.1. Natural Color
- 9.1.2. Synthetic Color
- 9.2. Market Analysis, Insights and Forecast - by Application
- 9.2.1. Beverage
- 9.2.2. Dairy & Frozen Product
- 9.2.3. Bakery
- 9.2.4. Meat, Poultry & Seafood
- 9.2.5. Confectionery
- 9.2.6. Others
- 9.1. Market Analysis, Insights and Forecast - by Product Type
- 10. Italy EU Food Colorant Market Analysis, Insights and Forecast, 2019-2031
- 10.1. Market Analysis, Insights and Forecast - by Product Type
- 10.1.1. Natural Color
- 10.1.2. Synthetic Color
- 10.2. Market Analysis, Insights and Forecast - by Application
- 10.2.1. Beverage
- 10.2.2. Dairy & Frozen Product
- 10.2.3. Bakery
- 10.2.4. Meat, Poultry & Seafood
- 10.2.5. Confectionery
- 10.2.6. Others
- 10.1. Market Analysis, Insights and Forecast - by Product Type
- 11. Russia EU Food Colorant Market Analysis, Insights and Forecast, 2019-2031
- 11.1. Market Analysis, Insights and Forecast - by Product Type
- 11.1.1. Natural Color
- 11.1.2. Synthetic Color
- 11.2. Market Analysis, Insights and Forecast - by Application
- 11.2.1. Beverage
- 11.2.2. Dairy & Frozen Product
- 11.2.3. Bakery
- 11.2.4. Meat, Poultry & Seafood
- 11.2.5. Confectionery
- 11.2.6. Others
- 11.1. Market Analysis, Insights and Forecast - by Product Type
- 12. Rest of Europe EU Food Colorant Market Analysis, Insights and Forecast, 2019-2031
- 12.1. Market Analysis, Insights and Forecast - by Product Type
- 12.1.1. Natural Color
- 12.1.2. Synthetic Color
- 12.2. Market Analysis, Insights and Forecast - by Application
- 12.2.1. Beverage
- 12.2.2. Dairy & Frozen Product
- 12.2.3. Bakery
- 12.2.4. Meat, Poultry & Seafood
- 12.2.5. Confectionery
- 12.2.6. Others
- 12.1. Market Analysis, Insights and Forecast - by Product Type
- 13. North America EU Food Colorant Market Analysis, Insights and Forecast, 2019-2031
- 13.1. Market Analysis, Insights and Forecast - By Country/Sub-region
- 13.1.1 United States
- 13.1.2 Canada
- 13.1.3 Mexico
- 14. Europe EU Food Colorant Market Analysis, Insights and Forecast, 2019-2031
- 14.1. Market Analysis, Insights and Forecast - By Country/Sub-region
- 14.1.1 Germany
- 14.1.2 United Kingdom
- 14.1.3 France
- 14.1.4 Spain
- 14.1.5 Italy
- 14.1.6 Spain
- 14.1.7 Belgium
- 14.1.8 Netherland
- 14.1.9 Nordics
- 14.1.10 Rest of Europe
- 15. Asia Pacific EU Food Colorant Market Analysis, Insights and Forecast, 2019-2031
- 15.1. Market Analysis, Insights and Forecast - By Country/Sub-region
- 15.1.1 China
- 15.1.2 Japan
- 15.1.3 India
- 15.1.4 South Korea
- 15.1.5 Southeast Asia
- 15.1.6 Australia
- 15.1.7 Indonesia
- 15.1.8 Phillipes
- 15.1.9 Singapore
- 15.1.10 Thailandc
- 15.1.11 Rest of Asia Pacific
- 16. South America EU Food Colorant Market Analysis, Insights and Forecast, 2019-2031
- 16.1. Market Analysis, Insights and Forecast - By Country/Sub-region
- 16.1.1 Brazil
- 16.1.2 Argentina
- 16.1.3 Peru
- 16.1.4 Chile
- 16.1.5 Colombia
- 16.1.6 Ecuador
- 16.1.7 Venezuela
- 16.1.8 Rest of South America
- 17. North America EU Food Colorant Market Analysis, Insights and Forecast, 2019-2031
- 17.1. Market Analysis, Insights and Forecast - By Country/Sub-region
- 17.1.1 United States
- 17.1.2 Canada
- 17.1.3 Mexico
- 18. MEA EU Food Colorant Market Analysis, Insights and Forecast, 2019-2031
- 18.1. Market Analysis, Insights and Forecast - By Country/Sub-region
- 18.1.1 United Arab Emirates
- 18.1.2 Saudi Arabia
- 18.1.3 South Africa
- 18.1.4 Rest of Middle East and Africa
- 19. Competitive Analysis
- 19.1. Global Market Share Analysis 2024
- 19.2. Company Profiles
- 19.2.1 Chr Hansen A/S
- 19.2.1.1. Overview
- 19.2.1.2. Products
- 19.2.1.3. SWOT Analysis
- 19.2.1.4. Recent Developments
- 19.2.1.5. Financials (Based on Availability)
- 19.2.2 Sensient Technologies
- 19.2.2.1. Overview
- 19.2.2.2. Products
- 19.2.2.3. SWOT Analysis
- 19.2.2.4. Recent Developments
- 19.2.2.5. Financials (Based on Availability)
- 19.2.3 Dohler Group
- 19.2.3.1. Overview
- 19.2.3.2. Products
- 19.2.3.3. SWOT Analysis
- 19.2.3.4. Recent Developments
- 19.2.3.5. Financials (Based on Availability)
- 19.2.4 Riken Vitamin
- 19.2.4.1. Overview
- 19.2.4.2. Products
- 19.2.4.3. SWOT Analysis
- 19.2.4.4. Recent Developments
- 19.2.4.5. Financials (Based on Availability)
- 19.2.5 BASF SE
- 19.2.5.1. Overview
- 19.2.5.2. Products
- 19.2.5.3. SWOT Analysis
- 19.2.5.4. Recent Developments
- 19.2.5.5. Financials (Based on Availability)
- 19.2.6 Koninklijke DSM N V
- 19.2.6.1. Overview
- 19.2.6.2. Products
- 19.2.6.3. SWOT Analysis
- 19.2.6.4. Recent Developments
- 19.2.6.5. Financials (Based on Availability)
- 19.2.7 D D Williamson & Co
- 19.2.7.1. Overview
- 19.2.7.2. Products
- 19.2.7.3. SWOT Analysis
- 19.2.7.4. Recent Developments
- 19.2.7.5. Financials (Based on Availability)
- 19.2.8 Givaudan (Naturex)*List Not Exhaustive
- 19.2.8.1. Overview
- 19.2.8.2. Products
- 19.2.8.3. SWOT Analysis
- 19.2.8.4. Recent Developments
- 19.2.8.5. Financials (Based on Availability)
- 19.2.1 Chr Hansen A/S
List of Figures
- Figure 1: Global EU Food Colorant Market Revenue Breakdown (Million, %) by Region 2024 & 2032
- Figure 2: North America EU Food Colorant Market Revenue (Million), by Country 2024 & 2032
- Figure 3: North America EU Food Colorant Market Revenue Share (%), by Country 2024 & 2032
- Figure 4: Europe EU Food Colorant Market Revenue (Million), by Country 2024 & 2032
- Figure 5: Europe EU Food Colorant Market Revenue Share (%), by Country 2024 & 2032
- Figure 6: Asia Pacific EU Food Colorant Market Revenue (Million), by Country 2024 & 2032
- Figure 7: Asia Pacific EU Food Colorant Market Revenue Share (%), by Country 2024 & 2032
- Figure 8: South America EU Food Colorant Market Revenue (Million), by Country 2024 & 2032
- Figure 9: South America EU Food Colorant Market Revenue Share (%), by Country 2024 & 2032
- Figure 10: North America EU Food Colorant Market Revenue (Million), by Country 2024 & 2032
- Figure 11: North America EU Food Colorant Market Revenue Share (%), by Country 2024 & 2032
- Figure 12: MEA EU Food Colorant Market Revenue (Million), by Country 2024 & 2032
- Figure 13: MEA EU Food Colorant Market Revenue Share (%), by Country 2024 & 2032
- Figure 14: Spain EU Food Colorant Market Revenue (Million), by Product Type 2024 & 2032
- Figure 15: Spain EU Food Colorant Market Revenue Share (%), by Product Type 2024 & 2032
- Figure 16: Spain EU Food Colorant Market Revenue (Million), by Application 2024 & 2032
- Figure 17: Spain EU Food Colorant Market Revenue Share (%), by Application 2024 & 2032
- Figure 18: Spain EU Food Colorant Market Revenue (Million), by Country 2024 & 2032
- Figure 19: Spain EU Food Colorant Market Revenue Share (%), by Country 2024 & 2032
- Figure 20: United Kingdom EU Food Colorant Market Revenue (Million), by Product Type 2024 & 2032
- Figure 21: United Kingdom EU Food Colorant Market Revenue Share (%), by Product Type 2024 & 2032
- Figure 22: United Kingdom EU Food Colorant Market Revenue (Million), by Application 2024 & 2032
- Figure 23: United Kingdom EU Food Colorant Market Revenue Share (%), by Application 2024 & 2032
- Figure 24: United Kingdom EU Food Colorant Market Revenue (Million), by Country 2024 & 2032
- Figure 25: United Kingdom EU Food Colorant Market Revenue Share (%), by Country 2024 & 2032
- Figure 26: Germany EU Food Colorant Market Revenue (Million), by Product Type 2024 & 2032
- Figure 27: Germany EU Food Colorant Market Revenue Share (%), by Product Type 2024 & 2032
- Figure 28: Germany EU Food Colorant Market Revenue (Million), by Application 2024 & 2032
- Figure 29: Germany EU Food Colorant Market Revenue Share (%), by Application 2024 & 2032
- Figure 30: Germany EU Food Colorant Market Revenue (Million), by Country 2024 & 2032
- Figure 31: Germany EU Food Colorant Market Revenue Share (%), by Country 2024 & 2032
- Figure 32: France EU Food Colorant Market Revenue (Million), by Product Type 2024 & 2032
- Figure 33: France EU Food Colorant Market Revenue Share (%), by Product Type 2024 & 2032
- Figure 34: France EU Food Colorant Market Revenue (Million), by Application 2024 & 2032
- Figure 35: France EU Food Colorant Market Revenue Share (%), by Application 2024 & 2032
- Figure 36: France EU Food Colorant Market Revenue (Million), by Country 2024 & 2032
- Figure 37: France EU Food Colorant Market Revenue Share (%), by Country 2024 & 2032
- Figure 38: Italy EU Food Colorant Market Revenue (Million), by Product Type 2024 & 2032
- Figure 39: Italy EU Food Colorant Market Revenue Share (%), by Product Type 2024 & 2032
- Figure 40: Italy EU Food Colorant Market Revenue (Million), by Application 2024 & 2032
- Figure 41: Italy EU Food Colorant Market Revenue Share (%), by Application 2024 & 2032
- Figure 42: Italy EU Food Colorant Market Revenue (Million), by Country 2024 & 2032
- Figure 43: Italy EU Food Colorant Market Revenue Share (%), by Country 2024 & 2032
- Figure 44: Russia EU Food Colorant Market Revenue (Million), by Product Type 2024 & 2032
- Figure 45: Russia EU Food Colorant Market Revenue Share (%), by Product Type 2024 & 2032
- Figure 46: Russia EU Food Colorant Market Revenue (Million), by Application 2024 & 2032
- Figure 47: Russia EU Food Colorant Market Revenue Share (%), by Application 2024 & 2032
- Figure 48: Russia EU Food Colorant Market Revenue (Million), by Country 2024 & 2032
- Figure 49: Russia EU Food Colorant Market Revenue Share (%), by Country 2024 & 2032
- Figure 50: Rest of Europe EU Food Colorant Market Revenue (Million), by Product Type 2024 & 2032
- Figure 51: Rest of Europe EU Food Colorant Market Revenue Share (%), by Product Type 2024 & 2032
- Figure 52: Rest of Europe EU Food Colorant Market Revenue (Million), by Application 2024 & 2032
- Figure 53: Rest of Europe EU Food Colorant Market Revenue Share (%), by Application 2024 & 2032
- Figure 54: Rest of Europe EU Food Colorant Market Revenue (Million), by Country 2024 & 2032
- Figure 55: Rest of Europe EU Food Colorant Market Revenue Share (%), by Country 2024 & 2032
List of Tables
- Table 1: Global EU Food Colorant Market Revenue Million Forecast, by Region 2019 & 2032
- Table 2: Global EU Food Colorant Market Revenue Million Forecast, by Product Type 2019 & 2032
- Table 3: Global EU Food Colorant Market Revenue Million Forecast, by Application 2019 & 2032
- Table 4: Global EU Food Colorant Market Revenue Million Forecast, by Region 2019 & 2032
- Table 5: Global EU Food Colorant Market Revenue Million Forecast, by Country 2019 & 2032
- Table 6: United States EU Food Colorant Market Revenue (Million) Forecast, by Application 2019 & 2032
- Table 7: Canada EU Food Colorant Market Revenue (Million) Forecast, by Application 2019 & 2032
- Table 8: Mexico EU Food Colorant Market Revenue (Million) Forecast, by Application 2019 & 2032
- Table 9: Global EU Food Colorant Market Revenue Million Forecast, by Country 2019 & 2032
- Table 10: Germany EU Food Colorant Market Revenue (Million) Forecast, by Application 2019 & 2032
- Table 11: United Kingdom EU Food Colorant Market Revenue (Million) Forecast, by Application 2019 & 2032
- Table 12: France EU Food Colorant Market Revenue (Million) Forecast, by Application 2019 & 2032
- Table 13: Spain EU Food Colorant Market Revenue (Million) Forecast, by Application 2019 & 2032
- Table 14: Italy EU Food Colorant Market Revenue (Million) Forecast, by Application 2019 & 2032
- Table 15: Spain EU Food Colorant Market Revenue (Million) Forecast, by Application 2019 & 2032
- Table 16: Belgium EU Food Colorant Market Revenue (Million) Forecast, by Application 2019 & 2032
- Table 17: Netherland EU Food Colorant Market Revenue (Million) Forecast, by Application 2019 & 2032
- Table 18: Nordics EU Food Colorant Market Revenue (Million) Forecast, by Application 2019 & 2032
- Table 19: Rest of Europe EU Food Colorant Market Revenue (Million) Forecast, by Application 2019 & 2032
- Table 20: Global EU Food Colorant Market Revenue Million Forecast, by Country 2019 & 2032
- Table 21: China EU Food Colorant Market Revenue (Million) Forecast, by Application 2019 & 2032
- Table 22: Japan EU Food Colorant Market Revenue (Million) Forecast, by Application 2019 & 2032
- Table 23: India EU Food Colorant Market Revenue (Million) Forecast, by Application 2019 & 2032
- Table 24: South Korea EU Food Colorant Market Revenue (Million) Forecast, by Application 2019 & 2032
- Table 25: Southeast Asia EU Food Colorant Market Revenue (Million) Forecast, by Application 2019 & 2032
- Table 26: Australia EU Food Colorant Market Revenue (Million) Forecast, by Application 2019 & 2032
- Table 27: Indonesia EU Food Colorant Market Revenue (Million) Forecast, by Application 2019 & 2032
- Table 28: Phillipes EU Food Colorant Market Revenue (Million) Forecast, by Application 2019 & 2032
- Table 29: Singapore EU Food Colorant Market Revenue (Million) Forecast, by Application 2019 & 2032
- Table 30: Thailandc EU Food Colorant Market Revenue (Million) Forecast, by Application 2019 & 2032
- Table 31: Rest of Asia Pacific EU Food Colorant Market Revenue (Million) Forecast, by Application 2019 & 2032
- Table 32: Global EU Food Colorant Market Revenue Million Forecast, by Country 2019 & 2032
- Table 33: Brazil EU Food Colorant Market Revenue (Million) Forecast, by Application 2019 & 2032
- Table 34: Argentina EU Food Colorant Market Revenue (Million) Forecast, by Application 2019 & 2032
- Table 35: Peru EU Food Colorant Market Revenue (Million) Forecast, by Application 2019 & 2032
- Table 36: Chile EU Food Colorant Market Revenue (Million) Forecast, by Application 2019 & 2032
- Table 37: Colombia EU Food Colorant Market Revenue (Million) Forecast, by Application 2019 & 2032
- Table 38: Ecuador EU Food Colorant Market Revenue (Million) Forecast, by Application 2019 & 2032
- Table 39: Venezuela EU Food Colorant Market Revenue (Million) Forecast, by Application 2019 & 2032
- Table 40: Rest of South America EU Food Colorant Market Revenue (Million) Forecast, by Application 2019 & 2032
- Table 41: Global EU Food Colorant Market Revenue Million Forecast, by Country 2019 & 2032
- Table 42: United States EU Food Colorant Market Revenue (Million) Forecast, by Application 2019 & 2032
- Table 43: Canada EU Food Colorant Market Revenue (Million) Forecast, by Application 2019 & 2032
- Table 44: Mexico EU Food Colorant Market Revenue (Million) Forecast, by Application 2019 & 2032
- Table 45: Global EU Food Colorant Market Revenue Million Forecast, by Country 2019 & 2032
- Table 46: United Arab Emirates EU Food Colorant Market Revenue (Million) Forecast, by Application 2019 & 2032
- Table 47: Saudi Arabia EU Food Colorant Market Revenue (Million) Forecast, by Application 2019 & 2032
- Table 48: South Africa EU Food Colorant Market Revenue (Million) Forecast, by Application 2019 & 2032
- Table 49: Rest of Middle East and Africa EU Food Colorant Market Revenue (Million) Forecast, by Application 2019 & 2032
- Table 50: Global EU Food Colorant Market Revenue Million Forecast, by Product Type 2019 & 2032
- Table 51: Global EU Food Colorant Market Revenue Million Forecast, by Application 2019 & 2032
- Table 52: Global EU Food Colorant Market Revenue Million Forecast, by Country 2019 & 2032
- Table 53: Global EU Food Colorant Market Revenue Million Forecast, by Product Type 2019 & 2032
- Table 54: Global EU Food Colorant Market Revenue Million Forecast, by Application 2019 & 2032
- Table 55: Global EU Food Colorant Market Revenue Million Forecast, by Country 2019 & 2032
- Table 56: Global EU Food Colorant Market Revenue Million Forecast, by Product Type 2019 & 2032
- Table 57: Global EU Food Colorant Market Revenue Million Forecast, by Application 2019 & 2032
- Table 58: Global EU Food Colorant Market Revenue Million Forecast, by Country 2019 & 2032
- Table 59: Global EU Food Colorant Market Revenue Million Forecast, by Product Type 2019 & 2032
- Table 60: Global EU Food Colorant Market Revenue Million Forecast, by Application 2019 & 2032
- Table 61: Global EU Food Colorant Market Revenue Million Forecast, by Country 2019 & 2032
- Table 62: Global EU Food Colorant Market Revenue Million Forecast, by Product Type 2019 & 2032
- Table 63: Global EU Food Colorant Market Revenue Million Forecast, by Application 2019 & 2032
- Table 64: Global EU Food Colorant Market Revenue Million Forecast, by Country 2019 & 2032
- Table 65: Global EU Food Colorant Market Revenue Million Forecast, by Product Type 2019 & 2032
- Table 66: Global EU Food Colorant Market Revenue Million Forecast, by Application 2019 & 2032
- Table 67: Global EU Food Colorant Market Revenue Million Forecast, by Country 2019 & 2032
- Table 68: Global EU Food Colorant Market Revenue Million Forecast, by Product Type 2019 & 2032
- Table 69: Global EU Food Colorant Market Revenue Million Forecast, by Application 2019 & 2032
- Table 70: Global EU Food Colorant Market Revenue Million Forecast, by Country 2019 & 2032
Frequently Asked Questions
1. What is the projected Compound Annual Growth Rate (CAGR) of the EU Food Colorant Market?
The projected CAGR is approximately 3.80%.
2. Which companies are prominent players in the EU Food Colorant Market?
Key companies in the market include Chr Hansen A/S, Sensient Technologies, Dohler Group, Riken Vitamin, BASF SE, Koninklijke DSM N V, D D Williamson & Co, Givaudan (Naturex)*List Not Exhaustive.
3. What are the main segments of the EU Food Colorant Market?
The market segments include Product Type, Application.
4. Can you provide details about the market size?
The market size is estimated to be USD XX Million as of 2022.
5. What are some drivers contributing to market growth?
The Rising Awareness of the Health Benefits Associated with Collagen Consumption; Rising Sport and Fitness Trends Drives the Market Growth.
6. What are the notable trends driving market growth?
United Kingdom Held the Largest Market Share.
7. Are there any restraints impacting market growth?
Concerns over the Source and Animal Welfare in Collagen Extraction Limit the Market Growth.
8. Can you provide examples of recent developments in the market?
N/A
9. What pricing options are available for accessing the report?
Pricing options include single-user, multi-user, and enterprise licenses priced at USD 4750, USD 5250, and USD 8750 respectively.
10. Is the market size provided in terms of value or volume?
The market size is provided in terms of value, measured in Million.
11. Are there any specific market keywords associated with the report?
Yes, the market keyword associated with the report is "EU Food Colorant Market," which aids in identifying and referencing the specific market segment covered.
12. How do I determine which pricing option suits my needs best?
The pricing options vary based on user requirements and access needs. Individual users may opt for single-user licenses, while businesses requiring broader access may choose multi-user or enterprise licenses for cost-effective access to the report.
13. Are there any additional resources or data provided in the EU Food Colorant Market report?
While the report offers comprehensive insights, it's advisable to review the specific contents or supplementary materials provided to ascertain if additional resources or data are available.
14. How can I stay updated on further developments or reports in the EU Food Colorant Market?
To stay informed about further developments, trends, and reports in the EU Food Colorant Market, consider subscribing to industry newsletters, following relevant companies and organizations, or regularly checking reputable industry news sources and publications.
Methodology
Step 1 - Identification of Relevant Samples Size from Population Database


Step 2 - Approaches for Defining Global Market Size (Value, Volume* & Price*)

Note*: In applicable scenarios
Step 3 - Data Sources
Primary Research
- Web Analytics
- Survey Reports
- Research Institute
- Latest Research Reports
- Opinion Leaders
Secondary Research
- Annual Reports
- White Paper
- Latest Press Release
- Industry Association
- Paid Database
- Investor Presentations

Step 4 - Data Triangulation
Involves using different sources of information in order to increase the validity of a study
These sources are likely to be stakeholders in a program - participants, other researchers, program staff, other community members, and so on.
Then we put all data in single framework & apply various statistical tools to find out the dynamic on the market.
During the analysis stage, feedback from the stakeholder groups would be compared to determine areas of agreement as well as areas of divergence
