

Key Insights
The European soft drinks packaging market, projected at 44.3 billion in 2025 with a CAGR of 12.6% through 2033, is driven by increasing demand for convenient, on-the-go beverage consumption. Evolving consumer preferences favor sustainable and eco-friendly packaging, including recycled plastics and plant-based alternatives. Plastic bottles currently dominate due to cost-effectiveness, though environmental concerns are spurring innovation in sustainable materials. Metal cans are expected to grow, benefiting from high recyclability and suitability for carbonated drinks. Leading markets include Germany, France, and the UK, attributed to high per capita consumption and robust manufacturing. Regulatory pressures on plastic waste and the circular economy present growth restraints, particularly for plastic packaging. Key industry players like CAN-PACK SA, Ardagh Group SA, and Ball Corporation are focusing on material science innovation and package design to enhance competitiveness and address sustainability.
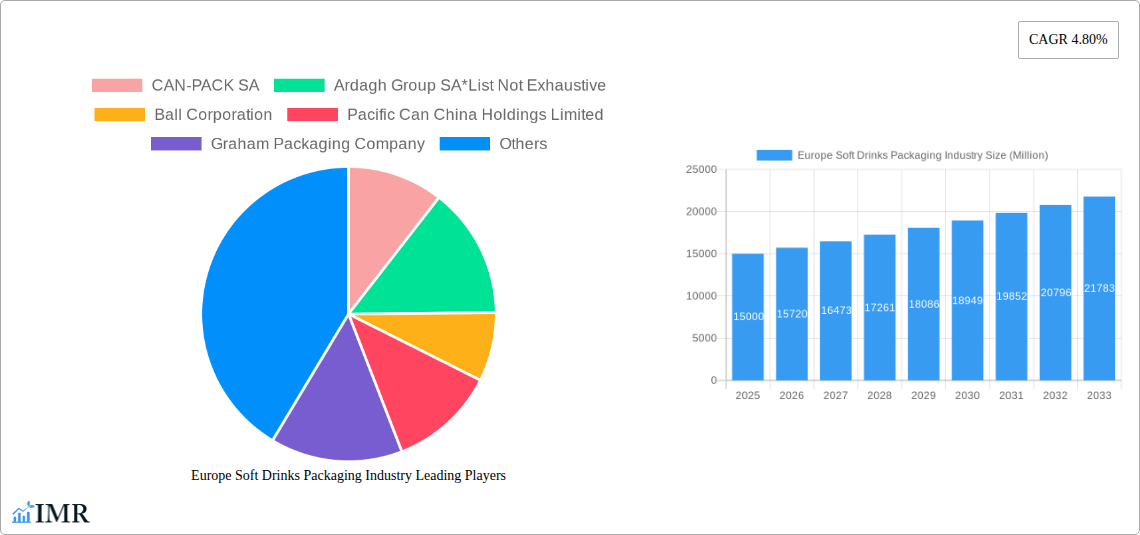
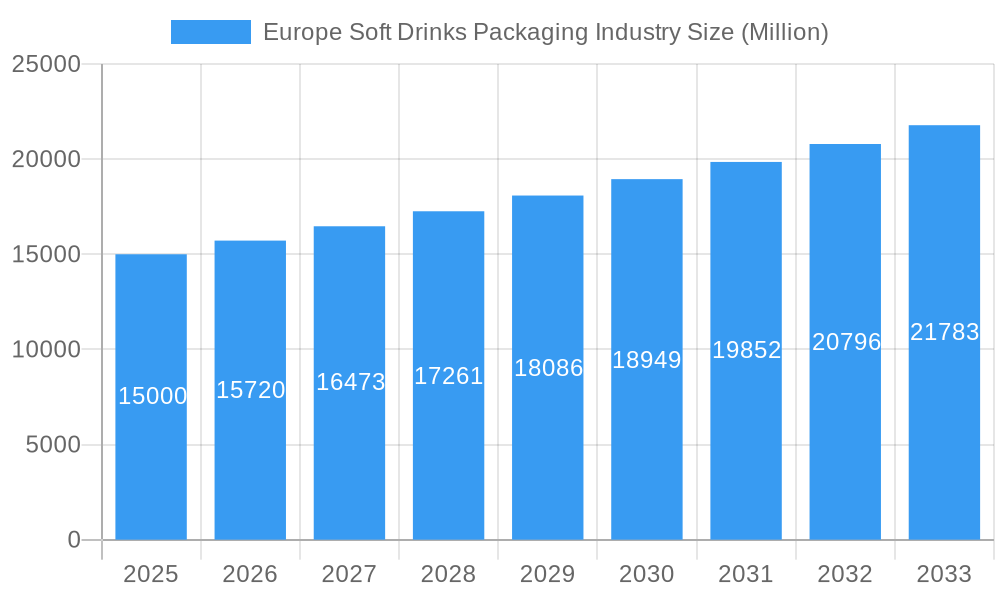
Europe Soft Drinks Packaging Industry Market Size (In Billion)
Market segmentation indicates plastic as the leading material, with significant growth anticipated for sustainable alternatives like paperboard and glass. Bottles remain the primary product type, followed by cans and cartons. The UK and Germany are poised for above-average growth due to strong economies and a focus on packaging innovation. The competitive environment is marked by consolidation and strategic alliances, with major players investing in R&D for eco-friendly solutions. Market consolidation is probable as companies prioritize sustainable practices and efficient supply chains. Success will hinge on balancing cost-effectiveness with sustainability to meet evolving consumer demands and environmental regulations.
Europe Soft Drinks Packaging Industry Company Market Share
Europe Soft Drinks Packaging Industry: A Comprehensive Market Report (2019-2033)
This comprehensive report delivers an in-depth analysis of the Europe soft drinks packaging market, providing crucial insights for industry professionals, investors, and strategic decision-makers. Covering the period 2019-2033, with a focus on 2025, this report meticulously examines market dynamics, growth trends, dominant segments, key players, and future opportunities within this dynamic sector. The analysis includes detailed breakdowns by material (plastic, metal, glass, paper & paperboard) and product type (bottles, cans, boxes, cartons), offering a granular understanding of the market's composition and evolution. The report uses Million units as the unit for all values.
Europe Soft Drinks Packaging Industry Market Dynamics & Structure
This section analyzes the competitive landscape of the European soft drinks packaging market, encompassing market concentration, technological advancements, regulatory influences, competitive substitutes, end-user demographics, and merger & acquisition (M&A) activities. The market is characterized by a moderately consolidated structure with key players holding significant market share.
- Market Concentration: The top 10 players account for approximately xx% of the market share in 2025 (Estimated Year).
- Technological Innovation: Continuous innovation in materials science, printing technologies, and automation drives efficiency and sustainability improvements. However, high R&D costs and regulatory compliance pose barriers to entry for smaller players.
- Regulatory Framework: EU regulations concerning plastic waste, recyclability, and food safety significantly influence packaging choices and material selection. Compliance costs impact profitability and necessitate ongoing adaptation.
- Competitive Substitutes: The emergence of alternative packaging solutions (e.g., biodegradable materials) presents both opportunities and challenges for established players. Market share of these alternatives is predicted to be xx% by 2033.
- End-User Demographics: Shifting consumer preferences toward healthier beverages and sustainable packaging influence demand for specific types of packaging. The increasing demand for eco-friendly packaging has led to a significant uptake in xx million units of sustainable options.
- M&A Trends: Consolidation through M&A activities is expected to continue, driven by the need for economies of scale, expanded product portfolios, and access to new technologies. An estimated xx M&A deals occurred between 2019 and 2024, with an average deal value of xx million units.
Europe Soft Drinks Packaging Industry Growth Trends & Insights
This section provides a detailed analysis of the Europe soft drinks packaging market's growth trajectory, encompassing market size evolution, adoption rates, technological disruptions, and evolving consumer behaviors. Leveraging extensive market research data, this section reveals the market's CAGR (Compound Annual Growth Rate) from 2019 to 2024 was xx%, and projects a CAGR of xx% during the forecast period (2025-2033). Market penetration of sustainable packaging solutions is expected to increase from xx% in 2025 to xx% by 2033. Technological disruptions, such as the increased adoption of lightweighting techniques and the integration of smart packaging technologies, are key growth drivers. Consumer preference shifts towards convenience, sustainability, and premiumization have also influenced growth.
Dominant Regions, Countries, or Segments in Europe Soft Drinks Packaging Industry
This section identifies the leading regions, countries, and segments within the European soft drinks packaging market driving growth. Western Europe holds the largest market share driven by higher per capita consumption of soft drinks and greater disposable incomes. Within materials, plastic packaging dominates with xx million units in 2025. Bottles remain the dominant product type, accounting for xx% of total units.
- Key Drivers in Western Europe:
- Strong consumer demand for soft drinks
- Well-established infrastructure for packaging production and distribution
- Favorable economic conditions
- Growth Potential in Eastern Europe:
- Rising disposable incomes and changing consumer preferences
- Increasing investments in the food and beverage industry
- Expanding retail infrastructure
Growth in the paper and paperboard segment is fueled by the increasing consumer demand for sustainable packaging solutions. Germany, France, and the UK are the major contributors to market growth due to large soft drink consumption and strong manufacturing presence.
Europe Soft Drinks Packaging Industry Product Landscape
The European soft drinks packaging market showcases a diverse range of products, catering to various beverage types and consumer preferences. Product innovation focuses on enhancing sustainability, improving barrier properties, and optimizing convenience. Lightweighting, the use of recycled materials, and the integration of smart packaging features are key trends. Companies are investing in advanced printing techniques to improve aesthetic appeal and branding opportunities. The focus on recyclability and reduced environmental impact drives the development of innovative materials and designs.
Key Drivers, Barriers & Challenges in Europe Soft Drinks Packaging Industry
Key Drivers:
- Growing demand for convenient and on-the-go beverage consumption.
- Increased preference for sustainable and eco-friendly packaging options.
- Technological advancements in packaging materials and manufacturing processes.
- Stringent regulatory requirements promoting recyclability and reduced environmental impact.
Key Challenges and Restraints:
- Fluctuations in raw material prices, particularly for plastics and metals. This has led to an increase in packaging costs by approximately xx% in 2024.
- Stringent environmental regulations impacting production costs and material choices.
- Intense competition among established packaging manufacturers.
- Supply chain disruptions impacting timely delivery of packaging materials.
Emerging Opportunities in Europe Soft Drinks Packaging Industry
Emerging opportunities include the growing demand for sustainable and biodegradable packaging materials, personalized packaging solutions, the integration of smart packaging technologies for enhanced product traceability and consumer engagement, and the expansion into niche markets such as functional beverages and premium soft drinks. The rising popularity of online grocery shopping also presents opportunities for innovative packaging formats designed for e-commerce.
Growth Accelerators in the Europe Soft Drinks Packaging Industry
Long-term growth in the European soft drinks packaging industry is fueled by continuous technological innovation, strategic partnerships between packaging manufacturers and beverage companies, and the expansion into new markets. The development of lightweight, recyclable, and sustainable packaging solutions will play a crucial role in driving future growth. Investments in automation and advanced manufacturing processes will improve efficiency and reduce production costs, further boosting industry growth.
Key Players Shaping the Europe Soft Drinks Packaging Industry Market
- CAN-PACK SA
- Ardagh Group SA
- Ball Corporation
- Pacific Can China Holdings Limited
- Graham Packaging Company
- Amcor PLC
- Crown Holdings Incorporated
- CKS Packaging Inc
- Toyo Seikan Group Holdings Ltd
- Tetra Pak Inc
- Owens-Illinois Inc
- Refresco Group NV
Notable Milestones in Europe Soft Drinks Packaging Industry Sector
- February 2021: Tetra Pak introduced certified recycled polymers and became the first company in the food and beverage packaging industry to be awarded the Roundtable on Sustainable Biomaterials (RSB) Advanced Products certification. This significantly boosted the adoption of sustainable packaging solutions.
- June 2021: Amcor launched new machines producing ultra-clear, heat-resistant, and recyclable films. This technological advancement enhanced the performance and sustainability of flexible packaging.
In-Depth Europe Soft Drinks Packaging Industry Market Outlook
The European soft drinks packaging market exhibits strong long-term growth potential driven by the factors outlined above. Strategic opportunities for industry players include focusing on sustainable and innovative packaging solutions, expanding into emerging markets, investing in advanced technologies, and fostering strategic partnerships to enhance market reach and consolidate market share. The market's future is defined by its ability to respond effectively to evolving consumer demands, increasingly stringent regulations, and technological breakthroughs.
Europe Soft Drinks Packaging Industry Segmentation
-
1. Material
- 1.1. Plastic
- 1.2. Metal
- 1.3. Glass
- 1.4. Paper and Paperboard
-
2. Product Type
- 2.1. Bottle
- 2.2. Can
- 2.3. Boxes
- 2.4. Cartons
Europe Soft Drinks Packaging Industry Segmentation By Geography
-
1. Europe
- 1.1. United Kingdom
- 1.2. Sweden
- 1.3. Germany
- 1.4. France
- 1.5. Rest of Europe
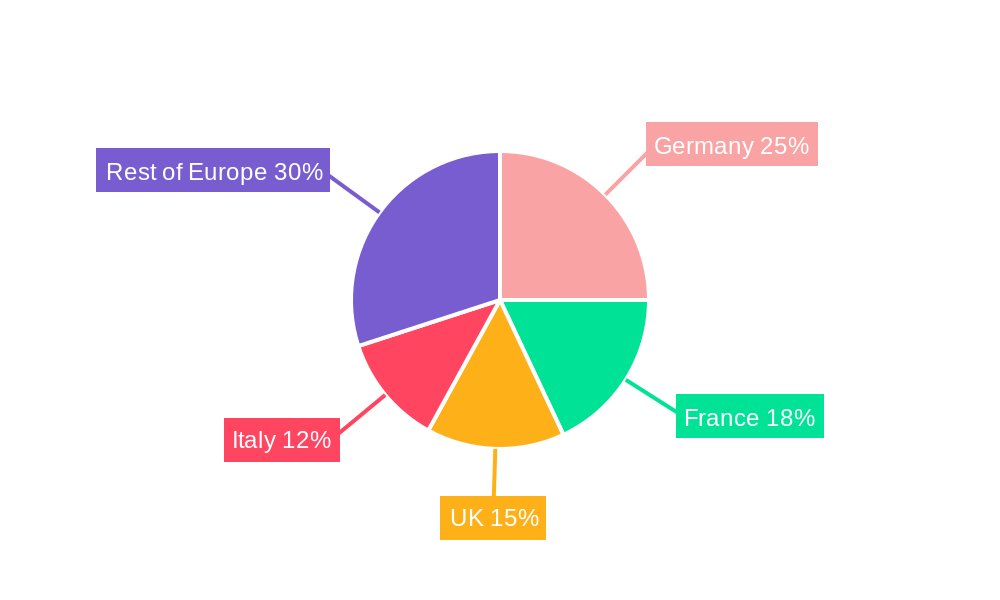
Europe Soft Drinks Packaging Industry Regional Market Share
Geographic Coverage of Europe Soft Drinks Packaging Industry
Europe Soft Drinks Packaging Industry REPORT HIGHLIGHTS
| Aspects | Details |
|---|---|
| Study Period | 2020-2034 |
| Base Year | 2025 |
| Estimated Year | 2026 |
| Forecast Period | 2026-2034 |
| Historical Period | 2020-2025 |
| Growth Rate | CAGR of 12.6% from 2020-2034 |
| Segmentation |
|
Table of Contents
- 1. Introduction
- 1.1. Research Scope
- 1.2. Market Segmentation
- 1.3. Research Objective
- 1.4. Definitions and Assumptions
- 2. Executive Summary
- 2.1. Market Snapshot
- 3. Market Dynamics
- 3.1. Market Drivers
- 3.2. Market Restrains
- 3.3. Market Trends
- 3.4. Market Opportunities
- 4. Market Factor Analysis
- 4.1. Porters Five Forces
- 4.1.1. Bargaining Power of Suppliers
- 4.1.2. Bargaining Power of Buyers
- 4.1.3. Threat of New Entrants
- 4.1.4. Threat of Substitutes
- 4.1.5. Competitive Rivalry
- 4.2. PESTEL analysis
- 4.3. BCG Analysis
- 4.3.1. Stars (High Growth, High Market Share)
- 4.3.2. Cash Cows (Low Growth, High Market Share)
- 4.3.3. Question Mark (High Growth, Low Market Share)
- 4.3.4. Dogs (Low Growth, Low Market Share)
- 4.4. Ansoff Matrix Analysis
- 4.5. Supply Chain Analysis
- 4.6. Regulatory Landscape
- 4.7. Current Market Potential and Opportunity Assessment (TAM–SAM–SOM Framework)
- 4.8. IMR Analyst Note
- 4.1. Porters Five Forces
- 5. Market Analysis, Insights and Forecast 2021-2033
- 5.1. Market Analysis, Insights and Forecast - by Material
- 5.1.1. Plastic
- 5.1.2. Metal
- 5.1.3. Glass
- 5.1.4. Paper and Paperboard
- 5.2. Market Analysis, Insights and Forecast - by Product Type
- 5.2.1. Bottle
- 5.2.2. Can
- 5.2.3. Boxes
- 5.2.4. Cartons
- 5.3. Market Analysis, Insights and Forecast - by Region
- 5.3.1. Europe
- 5.1. Market Analysis, Insights and Forecast - by Material
- 6. Europe Soft Drinks Packaging Industry Analysis, Insights and Forecast, 2021-2033
- 6.1. Market Analysis, Insights and Forecast - by Material
- 6.1.1. Plastic
- 6.1.2. Metal
- 6.1.3. Glass
- 6.1.4. Paper and Paperboard
- 6.2. Market Analysis, Insights and Forecast - by Product Type
- 6.2.1. Bottle
- 6.2.2. Can
- 6.2.3. Boxes
- 6.2.4. Cartons
- 6.1. Market Analysis, Insights and Forecast - by Material
- 7. Competitive Analysis
- 7.1. Company Profiles
- 7.1.1 CAN-PACK SA
- 7.1.1.1. Company Overview
- 7.1.1.2. Products
- 7.1.1.3. Company Financials
- 7.1.1.4. SWOT Analysis
- 7.1.2 Ardagh Group SA*List Not Exhaustive
- 7.1.2.1. Company Overview
- 7.1.2.2. Products
- 7.1.2.3. Company Financials
- 7.1.2.4. SWOT Analysis
- 7.1.3 Ball Corporation
- 7.1.3.1. Company Overview
- 7.1.3.2. Products
- 7.1.3.3. Company Financials
- 7.1.3.4. SWOT Analysis
- 7.1.4 Pacific Can China Holdings Limited
- 7.1.4.1. Company Overview
- 7.1.4.2. Products
- 7.1.4.3. Company Financials
- 7.1.4.4. SWOT Analysis
- 7.1.5 Graham Packaging Company
- 7.1.5.1. Company Overview
- 7.1.5.2. Products
- 7.1.5.3. Company Financials
- 7.1.5.4. SWOT Analysis
- 7.1.6 Amcor PLC
- 7.1.6.1. Company Overview
- 7.1.6.2. Products
- 7.1.6.3. Company Financials
- 7.1.6.4. SWOT Analysis
- 7.1.7 Crown Holdings Incorporated
- 7.1.7.1. Company Overview
- 7.1.7.2. Products
- 7.1.7.3. Company Financials
- 7.1.7.4. SWOT Analysis
- 7.1.8 CKS Packaging Inc
- 7.1.8.1. Company Overview
- 7.1.8.2. Products
- 7.1.8.3. Company Financials
- 7.1.8.4. SWOT Analysis
- 7.1.9 Toyo Seikan Group Holdings Ltd
- 7.1.9.1. Company Overview
- 7.1.9.2. Products
- 7.1.9.3. Company Financials
- 7.1.9.4. SWOT Analysis
- 7.1.10 Tetra Pak Inc
- 7.1.10.1. Company Overview
- 7.1.10.2. Products
- 7.1.10.3. Company Financials
- 7.1.10.4. SWOT Analysis
- 7.1.11 Owens-Illinois Inc
- 7.1.11.1. Company Overview
- 7.1.11.2. Products
- 7.1.11.3. Company Financials
- 7.1.11.4. SWOT Analysis
- 7.1.12 Refresco Group NV
- 7.1.12.1. Company Overview
- 7.1.12.2. Products
- 7.1.12.3. Company Financials
- 7.1.12.4. SWOT Analysis
- 7.1.1 CAN-PACK SA
- 7.2. Market Entropy
- 7.2.1 Company's Key Areas Served
- 7.2.2 Recent Developments
- 7.3. Company Market Share Analysis 2025
- 7.3.1 Top 5 Companies Market Share Analysis
- 7.3.2 Top 3 Companies Market Share Analysis
- 7.4. List of Potential Customers
- 8. Research Methodology
List of Figures
- Figure 1: Europe Soft Drinks Packaging Industry Revenue Breakdown (billion, %) by Product 2025 & 2033
- Figure 2: Europe Soft Drinks Packaging Industry Share (%) by Company 2025
List of Tables
- Table 1: Europe Soft Drinks Packaging Industry Revenue billion Forecast, by Material 2020 & 2033
- Table 2: Europe Soft Drinks Packaging Industry Revenue billion Forecast, by Product Type 2020 & 2033
- Table 3: Europe Soft Drinks Packaging Industry Revenue billion Forecast, by Region 2020 & 2033
- Table 4: Europe Soft Drinks Packaging Industry Revenue billion Forecast, by Material 2020 & 2033
- Table 5: Europe Soft Drinks Packaging Industry Revenue billion Forecast, by Product Type 2020 & 2033
- Table 6: Europe Soft Drinks Packaging Industry Revenue billion Forecast, by Country 2020 & 2033
- Table 7: United Kingdom Europe Soft Drinks Packaging Industry Revenue (billion) Forecast, by Application 2020 & 2033
- Table 8: Sweden Europe Soft Drinks Packaging Industry Revenue (billion) Forecast, by Application 2020 & 2033
- Table 9: Germany Europe Soft Drinks Packaging Industry Revenue (billion) Forecast, by Application 2020 & 2033
- Table 10: France Europe Soft Drinks Packaging Industry Revenue (billion) Forecast, by Application 2020 & 2033
- Table 11: Rest of Europe Europe Soft Drinks Packaging Industry Revenue (billion) Forecast, by Application 2020 & 2033
Frequently Asked Questions
1. What is the projected Compound Annual Growth Rate (CAGR) of the Europe Soft Drinks Packaging Industry?
The projected CAGR is approximately 12.6%.
2. Which companies are prominent players in the Europe Soft Drinks Packaging Industry?
Key companies in the market include CAN-PACK SA, Ardagh Group SA*List Not Exhaustive, Ball Corporation, Pacific Can China Holdings Limited, Graham Packaging Company, Amcor PLC, Crown Holdings Incorporated, CKS Packaging Inc, Toyo Seikan Group Holdings Ltd, Tetra Pak Inc, Owens-Illinois Inc, Refresco Group NV.
3. What are the main segments of the Europe Soft Drinks Packaging Industry?
The market segments include Material, Product Type.
4. Can you provide details about the market size?
The market size is estimated to be USD 44.3 billion as of 2022.
5. What are some drivers contributing to market growth?
Increasing Disposable Income and Growing Economies; Growing Demand for Ready-to-use Drinks.
6. What are the notable trends driving market growth?
Plastic is Expected to Hold the Largest Market Share.
7. Are there any restraints impacting market growth?
Stringent Government Regulations Against Non-biodegradable Products.
8. Can you provide examples of recent developments in the market?
February 2021 - Tetra Pak introduced certified recycled polymers and became the first company in the food and beverage packaging industry to be awarded the Roundtable on Sustainable Biomaterials (RSB) Advanced Products certification. Its carton packages integrating attributed recycled polymers are now available for food and beverage manufacturers.
9. What pricing options are available for accessing the report?
Pricing options include single-user, multi-user, and enterprise licenses priced at USD 4750, USD 4950, and USD 6800 respectively.
10. Is the market size provided in terms of value or volume?
The market size is provided in terms of value, measured in billion.
11. Are there any specific market keywords associated with the report?
Yes, the market keyword associated with the report is "Europe Soft Drinks Packaging Industry," which aids in identifying and referencing the specific market segment covered.
12. How do I determine which pricing option suits my needs best?
The pricing options vary based on user requirements and access needs. Individual users may opt for single-user licenses, while businesses requiring broader access may choose multi-user or enterprise licenses for cost-effective access to the report.
13. Are there any additional resources or data provided in the Europe Soft Drinks Packaging Industry report?
While the report offers comprehensive insights, it's advisable to review the specific contents or supplementary materials provided to ascertain if additional resources or data are available.
14. How can I stay updated on further developments or reports in the Europe Soft Drinks Packaging Industry?
To stay informed about further developments, trends, and reports in the Europe Soft Drinks Packaging Industry, consider subscribing to industry newsletters, following relevant companies and organizations, or regularly checking reputable industry news sources and publications.
Methodology
Step 1 - Identification of Relevant Samples Size from Population Database


Step 2 - Approaches for Defining Global Market Size (Value, Volume* & Price*)

Note*: In applicable scenarios
Step 3 - Data Sources
Primary Research
- Web Analytics
- Survey Reports
- Research Institute
- Latest Research Reports
- Opinion Leaders
Secondary Research
- Annual Reports
- White Paper
- Latest Press Release
- Industry Association
- Paid Database
- Investor Presentations

Step 4 - Data Triangulation
Involves using different sources of information in order to increase the validity of a study
These sources are likely to be stakeholders in a program - participants, other researchers, program staff, other community members, and so on.
Then we put all data in single framework & apply various statistical tools to find out the dynamic on the market.
During the analysis stage, feedback from the stakeholder groups would be compared to determine areas of agreement as well as areas of divergence