

Key Insights
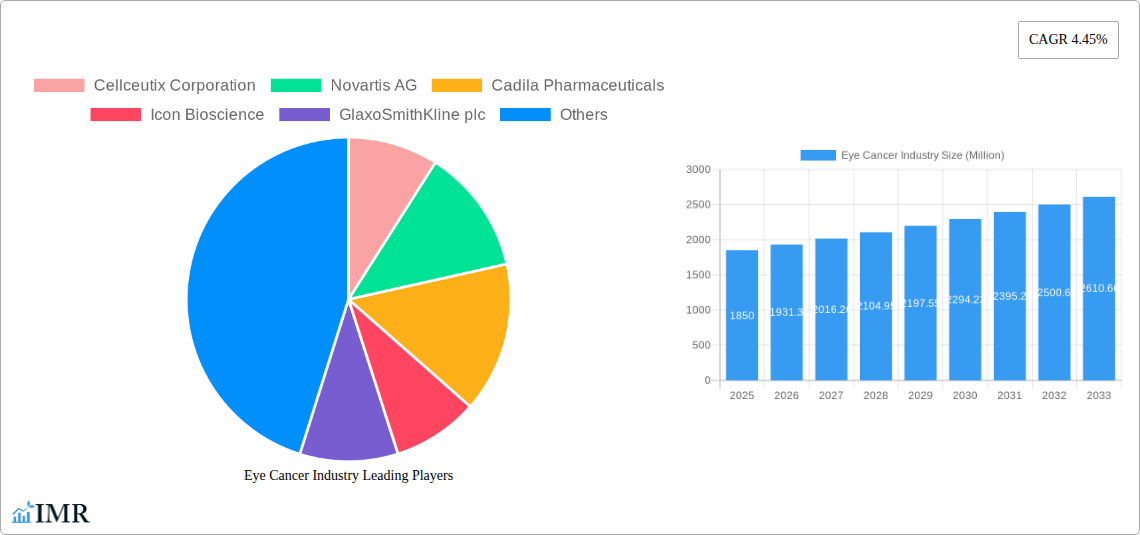
The global eye cancer market, valued at $1.85 billion in 2025, is projected to experience robust growth, driven by several key factors. Increasing prevalence of retinoblastoma, particularly in developing nations with limited access to early diagnosis and treatment, significantly fuels market expansion. Advances in treatment modalities, including targeted therapies, immunotherapy, and minimally invasive surgical techniques, offer improved patient outcomes and contribute to market growth. The rising geriatric population, susceptible to age-related eye cancers like uveal melanoma, further expands the market's addressable patient base. Technological advancements in diagnostic imaging, such as OCT and MRI, enabling earlier and more accurate detection, also positively influence market growth. However, the high cost of treatment, particularly for advanced stages of eye cancer, can limit access for some patients, representing a market restraint. Furthermore, the complexities associated with clinical trials for novel therapies and regulatory approvals can impact market growth trajectory.
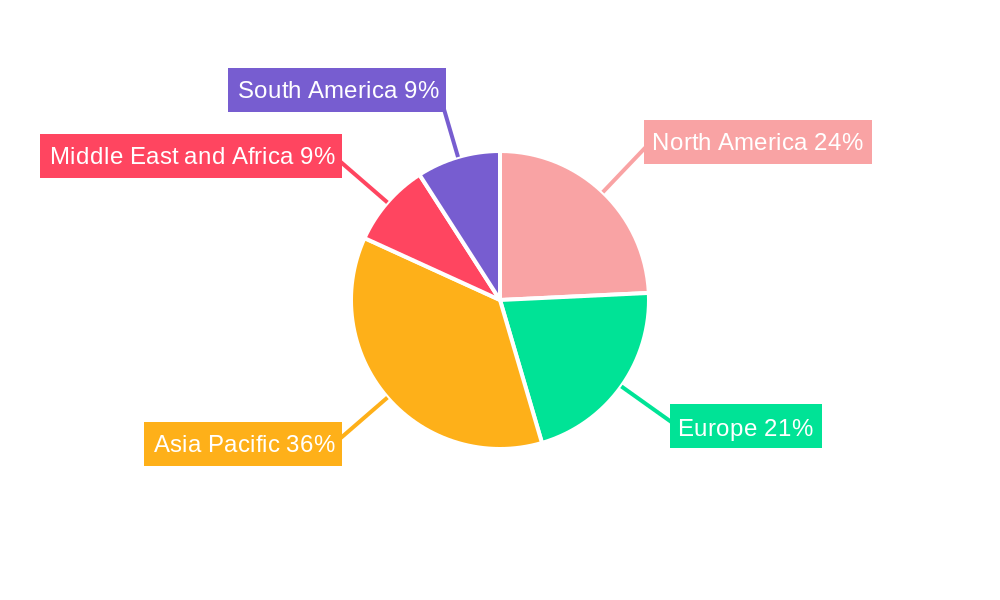
Market segmentation reveals a significant share held by retinoblastoma, particularly intraocular retinoblastoma, reflecting its higher prevalence. Surgery remains a dominant treatment modality, although the adoption of targeted therapies and immunotherapies is gaining momentum. The geographic distribution of the market reveals substantial contributions from North America and Europe due to high healthcare expenditure and advanced healthcare infrastructure. However, Asia Pacific is anticipated to exhibit significant growth potential in the coming years, driven by rising awareness, improved healthcare access, and a growing population. The competitive landscape is characterized by a mix of large multinational pharmaceutical companies and specialized biotechnology firms actively involved in research, development, and commercialization of novel therapies and diagnostic tools for various eye cancers. The continued focus on innovation and the development of personalized treatment approaches will be crucial drivers for market expansion throughout the forecast period (2025-2033).
Eye Cancer Industry Market Report: 2019-2033
This comprehensive report provides an in-depth analysis of the Eye Cancer Industry, encompassing market dynamics, growth trends, regional segmentation, product landscape, key players, and future outlook. With a focus on retinoblastoma (a primary eye cancer in children), this report covers the period 2019-2033, with a base year of 2025 and a forecast period of 2025-2033. The market is segmented by type of staging (Intraocular Retinoblastoma, Extraocular Retinoblastoma), treatment type (Surgery, Radiation therapy, Laser Therapy, Cryotherapy, Chemotherapy, Bone Marrow Transplantation/Stem Cell Transplant), and type of retinoblastoma (Non-hereditary Retinoblastoma, Hereditary Retinoblastoma). The report projects a market size of xx Million by 2033, representing a significant growth opportunity for stakeholders.
Eye Cancer Industry Market Dynamics & Structure
The eye cancer market, particularly focusing on retinoblastoma, is characterized by moderate concentration with several multinational pharmaceutical companies dominating. Technological innovation, driven by advancements in targeted therapies and diagnostic tools, is a key driver. Stringent regulatory frameworks influence market entry and product approval processes. Competitive product substitutes, such as alternative treatment modalities, exert pressure on market share. The end-user demographic primarily comprises children diagnosed with retinoblastoma and adults with other eye cancers. M&A activity remains moderate, with strategic acquisitions aimed at expanding therapeutic portfolios.
- Market Concentration: Moderately concentrated, with top 5 players holding xx% market share (2025).
- Technological Innovation: Advancements in genetic testing, targeted therapies, and minimally invasive surgical techniques.
- Regulatory Landscape: Stringent regulatory approvals impacting market entry and pricing.
- Competitive Landscape: Presence of established pharmaceutical players and emerging biotech companies.
- M&A Activity: xx deals recorded between 2019-2024, focusing on therapeutic pipeline expansion.
- Innovation Barriers: High R&D costs, lengthy clinical trial processes, and regulatory hurdles.
Eye Cancer Industry Growth Trends & Insights
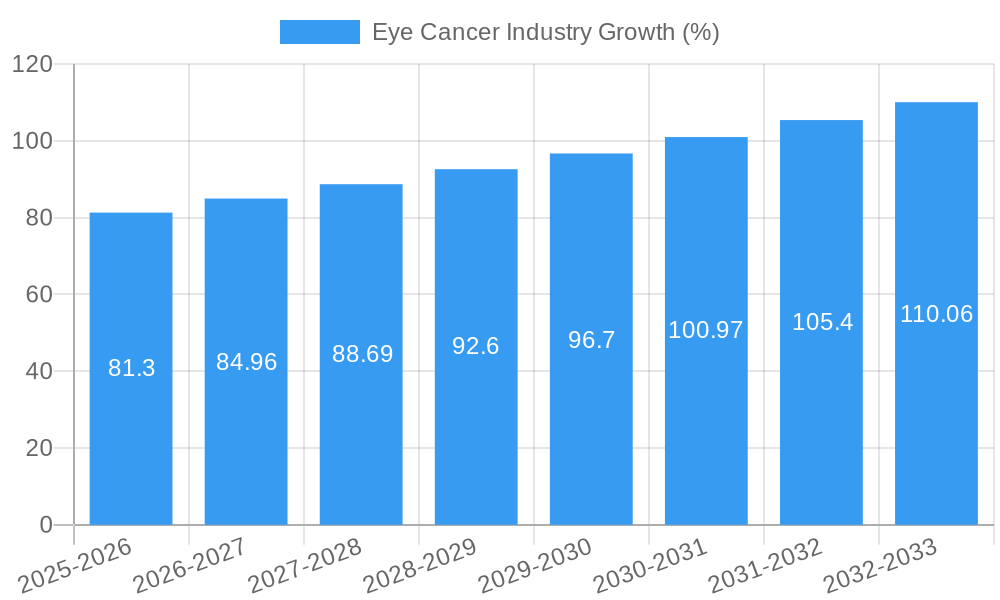
The eye cancer market exhibits a steady growth trajectory, driven by increasing incidence rates, particularly in developing nations, and advancements in treatment modalities. The market experienced a CAGR of xx% during 2019-2024. Technological disruptions, such as the development of novel targeted therapies and improved diagnostic techniques, accelerate market adoption. Shifting consumer preferences towards minimally invasive procedures and personalized medicine further influence growth. We project a CAGR of xx% for 2025-2033, with market penetration expected to reach xx% by 2033.
Dominant Regions, Countries, or Segments in Eye Cancer Industry
North America currently holds the largest market share, driven by advanced healthcare infrastructure, high healthcare expenditure, and early diagnosis rates. Europe follows as a significant market, while Asia-Pacific is expected to witness substantial growth due to rising awareness and improving healthcare access.
By Type of Staging: Intraocular retinoblastoma dominates, representing xx% of the market in 2025. By Treatment Type: Surgery remains the most prevalent treatment modality, followed by chemotherapy and radiation therapy. By Type of Retinoblastoma: Non-hereditary retinoblastoma accounts for the majority of cases.
- Key Drivers: Improved diagnostic capabilities, rising awareness, increasing healthcare expenditure, and advancements in treatment options.
- Dominance Factors: High incidence rates, well-established healthcare infrastructure, and robust research & development activities.
Eye Cancer Industry Product Landscape
The eye cancer product landscape comprises a range of therapeutic agents, including chemotherapy drugs, targeted therapies, and supportive care medications. Innovative diagnostic tools, such as advanced imaging techniques, improve early detection and treatment planning. Product innovation focuses on enhanced efficacy, reduced side effects, and personalized treatment approaches. The unique selling propositions include improved patient outcomes, reduced treatment duration, and enhanced convenience.
Key Drivers, Barriers & Challenges in Eye Cancer Industry
Key Drivers:
- Increasing prevalence of eye cancers, especially retinoblastoma.
- Advancements in targeted therapies and diagnostic technologies.
- Rising healthcare expenditure and health insurance coverage.
Challenges & Restraints:
- High cost of treatment and limited access to advanced therapies in developing countries.
- Stringent regulatory requirements impacting the speed of new drug approvals.
- The presence of side effects associated with certain treatment modalities.
- xx% of patients experience treatment-related complications (2024 estimate).
Emerging Opportunities in Eye Cancer Industry
Emerging opportunities include the development of personalized therapies based on genetic profiling, the exploration of novel drug delivery systems, and the expansion of telemedicine for remote diagnosis and monitoring. Untapped markets in emerging economies present significant growth potential. Increased focus on early detection and preventive strategies also offers promising avenues for market expansion.
Growth Accelerators in the Eye Cancer Industry Industry
Technological breakthroughs in gene therapy and immunotherapy offer significant growth potential. Strategic partnerships between pharmaceutical companies and research institutions accelerate the development of innovative therapies. Market expansion strategies, including geographic expansion into emerging markets and the development of affordable treatment options, contribute to long-term growth.
Key Players Shaping the Eye Cancer Industry Market
- Cellceutix Corporation
- Novartis AG
- Cadila Pharmaceuticals
- Icon Bioscience
- GlaxoSmithKline plc
- Teva Pharmaceutical Industries Ltd
- Johnson & Johnson
- RXi Pharmaceuticals
- Merck & Co
- Baxter International Inc
- Bristol-Myers Squibb Company
- Pfizer Inc
Notable Milestones in Eye Cancer Industry Sector
- May 2022: The UK's National Health Service launched a new prenatal test for retinoblastoma.
- September 2022: Researchers discovered the ESRRG molecule's role in retinoblastoma tumor cell survival. This finding may lead to new therapeutic targets.
In-Depth Eye Cancer Industry Market Outlook
The eye cancer market is poised for robust growth driven by continuous technological advancements, increasing prevalence, and expansion into untapped markets. Strategic partnerships and investments in R&D will fuel further innovation. The long-term outlook for the industry remains optimistic, presenting substantial opportunities for stakeholders involved in diagnosis, treatment, and supportive care.
Eye Cancer Industry Segmentation
-
1. Treatment Type
- 1.1. Surgery
- 1.2. Radiation therapy
- 1.3. Laser Therapy
- 1.4. Cryotherapy
- 1.5. Chemotherapy
- 1.6. Bone Marrow Transplantation/Stem Cell Transplant
-
2. Type of Retinoblastoma
- 2.1. Non-hereditary Retinoblastoma
- 2.2. Hereditary Retinoblastoma
-
3. Type of Staging
- 3.1. Intraocular Retinoblastoma
- 3.2. Extraocular Retinoblastoma
Eye Cancer Industry Segmentation By Geography
-
1. North America
- 1.1. United States
- 1.2. Canada
- 1.3. Mexico
-
2. Europe
- 2.1. Germany
- 2.2. United Kingdom
- 2.3. France
- 2.4. Italy
- 2.5. Spain
- 2.6. Rest of Europe
-
3. Asia Pacific
- 3.1. China
- 3.2. Japan
- 3.3. India
- 3.4. Australia
- 3.5. South Korea
- 3.6. Rest of Asia Pacific
-
4. Middle East and Africa
- 4.1. GCC
- 4.2. South Africa
- 4.3. Rest of Middle East and Africa
-
5. South America
- 5.1. Brazil
- 5.2. Argentina
- 5.3. Rest of South America
Eye Cancer Industry REPORT HIGHLIGHTS
| Aspects | Details |
|---|---|
| Study Period | 2019-2033 |
| Base Year | 2024 |
| Estimated Year | 2025 |
| Forecast Period | 2025-2033 |
| Historical Period | 2019-2024 |
| Growth Rate | CAGR of 4.45% from 2019-2033 |
| Segmentation |
|
Table of Contents
- 1. Introduction
- 1.1. Research Scope
- 1.2. Market Segmentation
- 1.3. Research Methodology
- 1.4. Definitions and Assumptions
- 2. Executive Summary
- 2.1. Introduction
- 3. Market Dynamics
- 3.1. Introduction
- 3.2. Market Drivers
- 3.2.1. Remission and the Chance of Recurrence of Retinoblastoma; Increasing Public Awareness on Retinoblastoma
- 3.3. Market Restrains
- 3.3.1. Side Effects of Retinoblastoma Surgery and High Cost of Treatment in Developing Countries
- 3.4. Market Trends
- 3.4.1. Non-hereditary Retinoblastoma is Expected to hold a Significant Market Share Over the Forecast Period
- 4. Market Factor Analysis
- 4.1. Porters Five Forces
- 4.2. Supply/Value Chain
- 4.3. PESTEL analysis
- 4.4. Market Entropy
- 4.5. Patent/Trademark Analysis
- 5. Global Eye Cancer Industry Analysis, Insights and Forecast, 2019-2031
- 5.1. Market Analysis, Insights and Forecast - by Treatment Type
- 5.1.1. Surgery
- 5.1.2. Radiation therapy
- 5.1.3. Laser Therapy
- 5.1.4. Cryotherapy
- 5.1.5. Chemotherapy
- 5.1.6. Bone Marrow Transplantation/Stem Cell Transplant
- 5.2. Market Analysis, Insights and Forecast - by Type of Retinoblastoma
- 5.2.1. Non-hereditary Retinoblastoma
- 5.2.2. Hereditary Retinoblastoma
- 5.3. Market Analysis, Insights and Forecast - by Type of Staging
- 5.3.1. Intraocular Retinoblastoma
- 5.3.2. Extraocular Retinoblastoma
- 5.4. Market Analysis, Insights and Forecast - by Region
- 5.4.1. North America
- 5.4.2. Europe
- 5.4.3. Asia Pacific
- 5.4.4. Middle East and Africa
- 5.4.5. South America
- 5.1. Market Analysis, Insights and Forecast - by Treatment Type
- 6. North America Eye Cancer Industry Analysis, Insights and Forecast, 2019-2031
- 6.1. Market Analysis, Insights and Forecast - by Treatment Type
- 6.1.1. Surgery
- 6.1.2. Radiation therapy
- 6.1.3. Laser Therapy
- 6.1.4. Cryotherapy
- 6.1.5. Chemotherapy
- 6.1.6. Bone Marrow Transplantation/Stem Cell Transplant
- 6.2. Market Analysis, Insights and Forecast - by Type of Retinoblastoma
- 6.2.1. Non-hereditary Retinoblastoma
- 6.2.2. Hereditary Retinoblastoma
- 6.3. Market Analysis, Insights and Forecast - by Type of Staging
- 6.3.1. Intraocular Retinoblastoma
- 6.3.2. Extraocular Retinoblastoma
- 6.1. Market Analysis, Insights and Forecast - by Treatment Type
- 7. Europe Eye Cancer Industry Analysis, Insights and Forecast, 2019-2031
- 7.1. Market Analysis, Insights and Forecast - by Treatment Type
- 7.1.1. Surgery
- 7.1.2. Radiation therapy
- 7.1.3. Laser Therapy
- 7.1.4. Cryotherapy
- 7.1.5. Chemotherapy
- 7.1.6. Bone Marrow Transplantation/Stem Cell Transplant
- 7.2. Market Analysis, Insights and Forecast - by Type of Retinoblastoma
- 7.2.1. Non-hereditary Retinoblastoma
- 7.2.2. Hereditary Retinoblastoma
- 7.3. Market Analysis, Insights and Forecast - by Type of Staging
- 7.3.1. Intraocular Retinoblastoma
- 7.3.2. Extraocular Retinoblastoma
- 7.1. Market Analysis, Insights and Forecast - by Treatment Type
- 8. Asia Pacific Eye Cancer Industry Analysis, Insights and Forecast, 2019-2031
- 8.1. Market Analysis, Insights and Forecast - by Treatment Type
- 8.1.1. Surgery
- 8.1.2. Radiation therapy
- 8.1.3. Laser Therapy
- 8.1.4. Cryotherapy
- 8.1.5. Chemotherapy
- 8.1.6. Bone Marrow Transplantation/Stem Cell Transplant
- 8.2. Market Analysis, Insights and Forecast - by Type of Retinoblastoma
- 8.2.1. Non-hereditary Retinoblastoma
- 8.2.2. Hereditary Retinoblastoma
- 8.3. Market Analysis, Insights and Forecast - by Type of Staging
- 8.3.1. Intraocular Retinoblastoma
- 8.3.2. Extraocular Retinoblastoma
- 8.1. Market Analysis, Insights and Forecast - by Treatment Type
- 9. Middle East and Africa Eye Cancer Industry Analysis, Insights and Forecast, 2019-2031
- 9.1. Market Analysis, Insights and Forecast - by Treatment Type
- 9.1.1. Surgery
- 9.1.2. Radiation therapy
- 9.1.3. Laser Therapy
- 9.1.4. Cryotherapy
- 9.1.5. Chemotherapy
- 9.1.6. Bone Marrow Transplantation/Stem Cell Transplant
- 9.2. Market Analysis, Insights and Forecast - by Type of Retinoblastoma
- 9.2.1. Non-hereditary Retinoblastoma
- 9.2.2. Hereditary Retinoblastoma
- 9.3. Market Analysis, Insights and Forecast - by Type of Staging
- 9.3.1. Intraocular Retinoblastoma
- 9.3.2. Extraocular Retinoblastoma
- 9.1. Market Analysis, Insights and Forecast - by Treatment Type
- 10. South America Eye Cancer Industry Analysis, Insights and Forecast, 2019-2031
- 10.1. Market Analysis, Insights and Forecast - by Treatment Type
- 10.1.1. Surgery
- 10.1.2. Radiation therapy
- 10.1.3. Laser Therapy
- 10.1.4. Cryotherapy
- 10.1.5. Chemotherapy
- 10.1.6. Bone Marrow Transplantation/Stem Cell Transplant
- 10.2. Market Analysis, Insights and Forecast - by Type of Retinoblastoma
- 10.2.1. Non-hereditary Retinoblastoma
- 10.2.2. Hereditary Retinoblastoma
- 10.3. Market Analysis, Insights and Forecast - by Type of Staging
- 10.3.1. Intraocular Retinoblastoma
- 10.3.2. Extraocular Retinoblastoma
- 10.1. Market Analysis, Insights and Forecast - by Treatment Type
- 11. North America Eye Cancer Industry Analysis, Insights and Forecast, 2019-2031
- 11.1. Market Analysis, Insights and Forecast - By Country/Sub-region
- 11.1.1 United States
- 11.1.2 Canada
- 11.1.3 Mexico
- 12. Europe Eye Cancer Industry Analysis, Insights and Forecast, 2019-2031
- 12.1. Market Analysis, Insights and Forecast - By Country/Sub-region
- 12.1.1 Germany
- 12.1.2 United Kingdom
- 12.1.3 France
- 12.1.4 Italy
- 12.1.5 Spain
- 12.1.6 Rest of Europe
- 13. Asia Pacific Eye Cancer Industry Analysis, Insights and Forecast, 2019-2031
- 13.1. Market Analysis, Insights and Forecast - By Country/Sub-region
- 13.1.1 China
- 13.1.2 Japan
- 13.1.3 India
- 13.1.4 Australia
- 13.1.5 South Korea
- 13.1.6 Rest of Asia Pacific
- 14. Middle East and Africa Eye Cancer Industry Analysis, Insights and Forecast, 2019-2031
- 14.1. Market Analysis, Insights and Forecast - By Country/Sub-region
- 14.1.1 GCC
- 14.1.2 South Africa
- 14.1.3 Rest of Middle East and Africa
- 15. South America Eye Cancer Industry Analysis, Insights and Forecast, 2019-2031
- 15.1. Market Analysis, Insights and Forecast - By Country/Sub-region
- 15.1.1 Brazil
- 15.1.2 Argentina
- 15.1.3 Rest of South America
- 16. Competitive Analysis
- 16.1. Global Market Share Analysis 2024
- 16.2. Company Profiles
- 16.2.1 Cellceutix Corporation
- 16.2.1.1. Overview
- 16.2.1.2. Products
- 16.2.1.3. SWOT Analysis
- 16.2.1.4. Recent Developments
- 16.2.1.5. Financials (Based on Availability)
- 16.2.2 Novartis AG
- 16.2.2.1. Overview
- 16.2.2.2. Products
- 16.2.2.3. SWOT Analysis
- 16.2.2.4. Recent Developments
- 16.2.2.5. Financials (Based on Availability)
- 16.2.3 Cadila Pharmaceuticals
- 16.2.3.1. Overview
- 16.2.3.2. Products
- 16.2.3.3. SWOT Analysis
- 16.2.3.4. Recent Developments
- 16.2.3.5. Financials (Based on Availability)
- 16.2.4 Icon Bioscience
- 16.2.4.1. Overview
- 16.2.4.2. Products
- 16.2.4.3. SWOT Analysis
- 16.2.4.4. Recent Developments
- 16.2.4.5. Financials (Based on Availability)
- 16.2.5 GlaxoSmithKline plc
- 16.2.5.1. Overview
- 16.2.5.2. Products
- 16.2.5.3. SWOT Analysis
- 16.2.5.4. Recent Developments
- 16.2.5.5. Financials (Based on Availability)
- 16.2.6 Teva Pharmaceutical Industries Ltd
- 16.2.6.1. Overview
- 16.2.6.2. Products
- 16.2.6.3. SWOT Analysis
- 16.2.6.4. Recent Developments
- 16.2.6.5. Financials (Based on Availability)
- 16.2.7 Johnson & Johnson
- 16.2.7.1. Overview
- 16.2.7.2. Products
- 16.2.7.3. SWOT Analysis
- 16.2.7.4. Recent Developments
- 16.2.7.5. Financials (Based on Availability)
- 16.2.8 RXi Pharmaceuticals*List Not Exhaustive
- 16.2.8.1. Overview
- 16.2.8.2. Products
- 16.2.8.3. SWOT Analysis
- 16.2.8.4. Recent Developments
- 16.2.8.5. Financials (Based on Availability)
- 16.2.9 Merck & Co
- 16.2.9.1. Overview
- 16.2.9.2. Products
- 16.2.9.3. SWOT Analysis
- 16.2.9.4. Recent Developments
- 16.2.9.5. Financials (Based on Availability)
- 16.2.10 Baxter International Inc
- 16.2.10.1. Overview
- 16.2.10.2. Products
- 16.2.10.3. SWOT Analysis
- 16.2.10.4. Recent Developments
- 16.2.10.5. Financials (Based on Availability)
- 16.2.11 Bristol-Myers Squibb Company
- 16.2.11.1. Overview
- 16.2.11.2. Products
- 16.2.11.3. SWOT Analysis
- 16.2.11.4. Recent Developments
- 16.2.11.5. Financials (Based on Availability)
- 16.2.12 Pfizer Inc
- 16.2.12.1. Overview
- 16.2.12.2. Products
- 16.2.12.3. SWOT Analysis
- 16.2.12.4. Recent Developments
- 16.2.12.5. Financials (Based on Availability)
- 16.2.1 Cellceutix Corporation
List of Figures
- Figure 1: Global Eye Cancer Industry Revenue Breakdown (Million, %) by Region 2024 & 2032
- Figure 2: North America Eye Cancer Industry Revenue (Million), by Country 2024 & 2032
- Figure 3: North America Eye Cancer Industry Revenue Share (%), by Country 2024 & 2032
- Figure 4: Europe Eye Cancer Industry Revenue (Million), by Country 2024 & 2032
- Figure 5: Europe Eye Cancer Industry Revenue Share (%), by Country 2024 & 2032
- Figure 6: Asia Pacific Eye Cancer Industry Revenue (Million), by Country 2024 & 2032
- Figure 7: Asia Pacific Eye Cancer Industry Revenue Share (%), by Country 2024 & 2032
- Figure 8: Middle East and Africa Eye Cancer Industry Revenue (Million), by Country 2024 & 2032
- Figure 9: Middle East and Africa Eye Cancer Industry Revenue Share (%), by Country 2024 & 2032
- Figure 10: South America Eye Cancer Industry Revenue (Million), by Country 2024 & 2032
- Figure 11: South America Eye Cancer Industry Revenue Share (%), by Country 2024 & 2032
- Figure 12: North America Eye Cancer Industry Revenue (Million), by Treatment Type 2024 & 2032
- Figure 13: North America Eye Cancer Industry Revenue Share (%), by Treatment Type 2024 & 2032
- Figure 14: North America Eye Cancer Industry Revenue (Million), by Type of Retinoblastoma 2024 & 2032
- Figure 15: North America Eye Cancer Industry Revenue Share (%), by Type of Retinoblastoma 2024 & 2032
- Figure 16: North America Eye Cancer Industry Revenue (Million), by Type of Staging 2024 & 2032
- Figure 17: North America Eye Cancer Industry Revenue Share (%), by Type of Staging 2024 & 2032
- Figure 18: North America Eye Cancer Industry Revenue (Million), by Country 2024 & 2032
- Figure 19: North America Eye Cancer Industry Revenue Share (%), by Country 2024 & 2032
- Figure 20: Europe Eye Cancer Industry Revenue (Million), by Treatment Type 2024 & 2032
- Figure 21: Europe Eye Cancer Industry Revenue Share (%), by Treatment Type 2024 & 2032
- Figure 22: Europe Eye Cancer Industry Revenue (Million), by Type of Retinoblastoma 2024 & 2032
- Figure 23: Europe Eye Cancer Industry Revenue Share (%), by Type of Retinoblastoma 2024 & 2032
- Figure 24: Europe Eye Cancer Industry Revenue (Million), by Type of Staging 2024 & 2032
- Figure 25: Europe Eye Cancer Industry Revenue Share (%), by Type of Staging 2024 & 2032
- Figure 26: Europe Eye Cancer Industry Revenue (Million), by Country 2024 & 2032
- Figure 27: Europe Eye Cancer Industry Revenue Share (%), by Country 2024 & 2032
- Figure 28: Asia Pacific Eye Cancer Industry Revenue (Million), by Treatment Type 2024 & 2032
- Figure 29: Asia Pacific Eye Cancer Industry Revenue Share (%), by Treatment Type 2024 & 2032
- Figure 30: Asia Pacific Eye Cancer Industry Revenue (Million), by Type of Retinoblastoma 2024 & 2032
- Figure 31: Asia Pacific Eye Cancer Industry Revenue Share (%), by Type of Retinoblastoma 2024 & 2032
- Figure 32: Asia Pacific Eye Cancer Industry Revenue (Million), by Type of Staging 2024 & 2032
- Figure 33: Asia Pacific Eye Cancer Industry Revenue Share (%), by Type of Staging 2024 & 2032
- Figure 34: Asia Pacific Eye Cancer Industry Revenue (Million), by Country 2024 & 2032
- Figure 35: Asia Pacific Eye Cancer Industry Revenue Share (%), by Country 2024 & 2032
- Figure 36: Middle East and Africa Eye Cancer Industry Revenue (Million), by Treatment Type 2024 & 2032
- Figure 37: Middle East and Africa Eye Cancer Industry Revenue Share (%), by Treatment Type 2024 & 2032
- Figure 38: Middle East and Africa Eye Cancer Industry Revenue (Million), by Type of Retinoblastoma 2024 & 2032
- Figure 39: Middle East and Africa Eye Cancer Industry Revenue Share (%), by Type of Retinoblastoma 2024 & 2032
- Figure 40: Middle East and Africa Eye Cancer Industry Revenue (Million), by Type of Staging 2024 & 2032
- Figure 41: Middle East and Africa Eye Cancer Industry Revenue Share (%), by Type of Staging 2024 & 2032
- Figure 42: Middle East and Africa Eye Cancer Industry Revenue (Million), by Country 2024 & 2032
- Figure 43: Middle East and Africa Eye Cancer Industry Revenue Share (%), by Country 2024 & 2032
- Figure 44: South America Eye Cancer Industry Revenue (Million), by Treatment Type 2024 & 2032
- Figure 45: South America Eye Cancer Industry Revenue Share (%), by Treatment Type 2024 & 2032
- Figure 46: South America Eye Cancer Industry Revenue (Million), by Type of Retinoblastoma 2024 & 2032
- Figure 47: South America Eye Cancer Industry Revenue Share (%), by Type of Retinoblastoma 2024 & 2032
- Figure 48: South America Eye Cancer Industry Revenue (Million), by Type of Staging 2024 & 2032
- Figure 49: South America Eye Cancer Industry Revenue Share (%), by Type of Staging 2024 & 2032
- Figure 50: South America Eye Cancer Industry Revenue (Million), by Country 2024 & 2032
- Figure 51: South America Eye Cancer Industry Revenue Share (%), by Country 2024 & 2032
List of Tables
- Table 1: Global Eye Cancer Industry Revenue Million Forecast, by Region 2019 & 2032
- Table 2: Global Eye Cancer Industry Revenue Million Forecast, by Treatment Type 2019 & 2032
- Table 3: Global Eye Cancer Industry Revenue Million Forecast, by Type of Retinoblastoma 2019 & 2032
- Table 4: Global Eye Cancer Industry Revenue Million Forecast, by Type of Staging 2019 & 2032
- Table 5: Global Eye Cancer Industry Revenue Million Forecast, by Region 2019 & 2032
- Table 6: Global Eye Cancer Industry Revenue Million Forecast, by Country 2019 & 2032
- Table 7: United States Eye Cancer Industry Revenue (Million) Forecast, by Application 2019 & 2032
- Table 8: Canada Eye Cancer Industry Revenue (Million) Forecast, by Application 2019 & 2032
- Table 9: Mexico Eye Cancer Industry Revenue (Million) Forecast, by Application 2019 & 2032
- Table 10: Global Eye Cancer Industry Revenue Million Forecast, by Country 2019 & 2032
- Table 11: Germany Eye Cancer Industry Revenue (Million) Forecast, by Application 2019 & 2032
- Table 12: United Kingdom Eye Cancer Industry Revenue (Million) Forecast, by Application 2019 & 2032
- Table 13: France Eye Cancer Industry Revenue (Million) Forecast, by Application 2019 & 2032
- Table 14: Italy Eye Cancer Industry Revenue (Million) Forecast, by Application 2019 & 2032
- Table 15: Spain Eye Cancer Industry Revenue (Million) Forecast, by Application 2019 & 2032
- Table 16: Rest of Europe Eye Cancer Industry Revenue (Million) Forecast, by Application 2019 & 2032
- Table 17: Global Eye Cancer Industry Revenue Million Forecast, by Country 2019 & 2032
- Table 18: China Eye Cancer Industry Revenue (Million) Forecast, by Application 2019 & 2032
- Table 19: Japan Eye Cancer Industry Revenue (Million) Forecast, by Application 2019 & 2032
- Table 20: India Eye Cancer Industry Revenue (Million) Forecast, by Application 2019 & 2032
- Table 21: Australia Eye Cancer Industry Revenue (Million) Forecast, by Application 2019 & 2032
- Table 22: South Korea Eye Cancer Industry Revenue (Million) Forecast, by Application 2019 & 2032
- Table 23: Rest of Asia Pacific Eye Cancer Industry Revenue (Million) Forecast, by Application 2019 & 2032
- Table 24: Global Eye Cancer Industry Revenue Million Forecast, by Country 2019 & 2032
- Table 25: GCC Eye Cancer Industry Revenue (Million) Forecast, by Application 2019 & 2032
- Table 26: South Africa Eye Cancer Industry Revenue (Million) Forecast, by Application 2019 & 2032
- Table 27: Rest of Middle East and Africa Eye Cancer Industry Revenue (Million) Forecast, by Application 2019 & 2032
- Table 28: Global Eye Cancer Industry Revenue Million Forecast, by Country 2019 & 2032
- Table 29: Brazil Eye Cancer Industry Revenue (Million) Forecast, by Application 2019 & 2032
- Table 30: Argentina Eye Cancer Industry Revenue (Million) Forecast, by Application 2019 & 2032
- Table 31: Rest of South America Eye Cancer Industry Revenue (Million) Forecast, by Application 2019 & 2032
- Table 32: Global Eye Cancer Industry Revenue Million Forecast, by Treatment Type 2019 & 2032
- Table 33: Global Eye Cancer Industry Revenue Million Forecast, by Type of Retinoblastoma 2019 & 2032
- Table 34: Global Eye Cancer Industry Revenue Million Forecast, by Type of Staging 2019 & 2032
- Table 35: Global Eye Cancer Industry Revenue Million Forecast, by Country 2019 & 2032
- Table 36: United States Eye Cancer Industry Revenue (Million) Forecast, by Application 2019 & 2032
- Table 37: Canada Eye Cancer Industry Revenue (Million) Forecast, by Application 2019 & 2032
- Table 38: Mexico Eye Cancer Industry Revenue (Million) Forecast, by Application 2019 & 2032
- Table 39: Global Eye Cancer Industry Revenue Million Forecast, by Treatment Type 2019 & 2032
- Table 40: Global Eye Cancer Industry Revenue Million Forecast, by Type of Retinoblastoma 2019 & 2032
- Table 41: Global Eye Cancer Industry Revenue Million Forecast, by Type of Staging 2019 & 2032
- Table 42: Global Eye Cancer Industry Revenue Million Forecast, by Country 2019 & 2032
- Table 43: Germany Eye Cancer Industry Revenue (Million) Forecast, by Application 2019 & 2032
- Table 44: United Kingdom Eye Cancer Industry Revenue (Million) Forecast, by Application 2019 & 2032
- Table 45: France Eye Cancer Industry Revenue (Million) Forecast, by Application 2019 & 2032
- Table 46: Italy Eye Cancer Industry Revenue (Million) Forecast, by Application 2019 & 2032
- Table 47: Spain Eye Cancer Industry Revenue (Million) Forecast, by Application 2019 & 2032
- Table 48: Rest of Europe Eye Cancer Industry Revenue (Million) Forecast, by Application 2019 & 2032
- Table 49: Global Eye Cancer Industry Revenue Million Forecast, by Treatment Type 2019 & 2032
- Table 50: Global Eye Cancer Industry Revenue Million Forecast, by Type of Retinoblastoma 2019 & 2032
- Table 51: Global Eye Cancer Industry Revenue Million Forecast, by Type of Staging 2019 & 2032
- Table 52: Global Eye Cancer Industry Revenue Million Forecast, by Country 2019 & 2032
- Table 53: China Eye Cancer Industry Revenue (Million) Forecast, by Application 2019 & 2032
- Table 54: Japan Eye Cancer Industry Revenue (Million) Forecast, by Application 2019 & 2032
- Table 55: India Eye Cancer Industry Revenue (Million) Forecast, by Application 2019 & 2032
- Table 56: Australia Eye Cancer Industry Revenue (Million) Forecast, by Application 2019 & 2032
- Table 57: South Korea Eye Cancer Industry Revenue (Million) Forecast, by Application 2019 & 2032
- Table 58: Rest of Asia Pacific Eye Cancer Industry Revenue (Million) Forecast, by Application 2019 & 2032
- Table 59: Global Eye Cancer Industry Revenue Million Forecast, by Treatment Type 2019 & 2032
- Table 60: Global Eye Cancer Industry Revenue Million Forecast, by Type of Retinoblastoma 2019 & 2032
- Table 61: Global Eye Cancer Industry Revenue Million Forecast, by Type of Staging 2019 & 2032
- Table 62: Global Eye Cancer Industry Revenue Million Forecast, by Country 2019 & 2032
- Table 63: GCC Eye Cancer Industry Revenue (Million) Forecast, by Application 2019 & 2032
- Table 64: South Africa Eye Cancer Industry Revenue (Million) Forecast, by Application 2019 & 2032
- Table 65: Rest of Middle East and Africa Eye Cancer Industry Revenue (Million) Forecast, by Application 2019 & 2032
- Table 66: Global Eye Cancer Industry Revenue Million Forecast, by Treatment Type 2019 & 2032
- Table 67: Global Eye Cancer Industry Revenue Million Forecast, by Type of Retinoblastoma 2019 & 2032
- Table 68: Global Eye Cancer Industry Revenue Million Forecast, by Type of Staging 2019 & 2032
- Table 69: Global Eye Cancer Industry Revenue Million Forecast, by Country 2019 & 2032
- Table 70: Brazil Eye Cancer Industry Revenue (Million) Forecast, by Application 2019 & 2032
- Table 71: Argentina Eye Cancer Industry Revenue (Million) Forecast, by Application 2019 & 2032
- Table 72: Rest of South America Eye Cancer Industry Revenue (Million) Forecast, by Application 2019 & 2032
Frequently Asked Questions
1. What is the projected Compound Annual Growth Rate (CAGR) of the Eye Cancer Industry?
The projected CAGR is approximately 4.45%.
2. Which companies are prominent players in the Eye Cancer Industry?
Key companies in the market include Cellceutix Corporation, Novartis AG, Cadila Pharmaceuticals, Icon Bioscience, GlaxoSmithKline plc, Teva Pharmaceutical Industries Ltd, Johnson & Johnson, RXi Pharmaceuticals*List Not Exhaustive, Merck & Co, Baxter International Inc, Bristol-Myers Squibb Company, Pfizer Inc.
3. What are the main segments of the Eye Cancer Industry?
The market segments include Treatment Type, Type of Retinoblastoma, Type of Staging.
4. Can you provide details about the market size?
The market size is estimated to be USD 1.85 Million as of 2022.
5. What are some drivers contributing to market growth?
Remission and the Chance of Recurrence of Retinoblastoma; Increasing Public Awareness on Retinoblastoma.
6. What are the notable trends driving market growth?
Non-hereditary Retinoblastoma is Expected to hold a Significant Market Share Over the Forecast Period.
7. Are there any restraints impacting market growth?
Side Effects of Retinoblastoma Surgery and High Cost of Treatment in Developing Countries.
8. Can you provide examples of recent developments in the market?
September 2022: researchers at UT Southwestern and the University of Miami discovered a molecule, estrogen-related receptor gamma, or ESRRG that is hyperactive and promotes tumor cell survival in retinoblastoma. Blocking ESRRG, the team reported in Science Advances, kills retinoblastoma cells.
9. What pricing options are available for accessing the report?
Pricing options include single-user, multi-user, and enterprise licenses priced at USD 4750, USD 5250, and USD 8750 respectively.
10. Is the market size provided in terms of value or volume?
The market size is provided in terms of value, measured in Million.
11. Are there any specific market keywords associated with the report?
Yes, the market keyword associated with the report is "Eye Cancer Industry," which aids in identifying and referencing the specific market segment covered.
12. How do I determine which pricing option suits my needs best?
The pricing options vary based on user requirements and access needs. Individual users may opt for single-user licenses, while businesses requiring broader access may choose multi-user or enterprise licenses for cost-effective access to the report.
13. Are there any additional resources or data provided in the Eye Cancer Industry report?
While the report offers comprehensive insights, it's advisable to review the specific contents or supplementary materials provided to ascertain if additional resources or data are available.
14. How can I stay updated on further developments or reports in the Eye Cancer Industry?
To stay informed about further developments, trends, and reports in the Eye Cancer Industry, consider subscribing to industry newsletters, following relevant companies and organizations, or regularly checking reputable industry news sources and publications.
Methodology
Step 1 - Identification of Relevant Samples Size from Population Database


Step 2 - Approaches for Defining Global Market Size (Value, Volume* & Price*)

Note*: In applicable scenarios
Step 3 - Data Sources
Primary Research
- Web Analytics
- Survey Reports
- Research Institute
- Latest Research Reports
- Opinion Leaders
Secondary Research
- Annual Reports
- White Paper
- Latest Press Release
- Industry Association
- Paid Database
- Investor Presentations

Step 4 - Data Triangulation
Involves using different sources of information in order to increase the validity of a study
These sources are likely to be stakeholders in a program - participants, other researchers, program staff, other community members, and so on.
Then we put all data in single framework & apply various statistical tools to find out the dynamic on the market.
During the analysis stage, feedback from the stakeholder groups would be compared to determine areas of agreement as well as areas of divergence
