

Key Insights
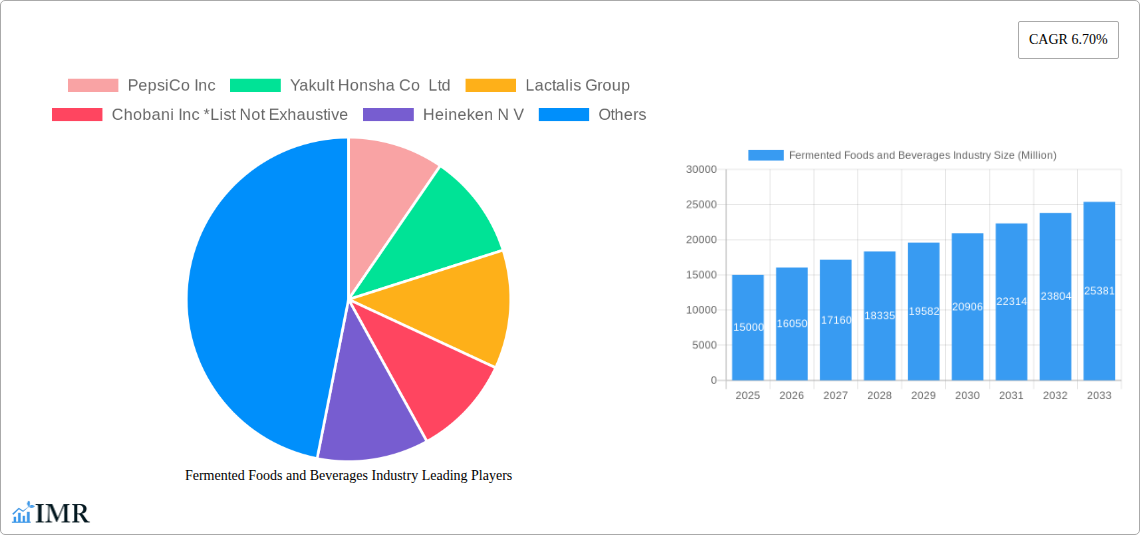
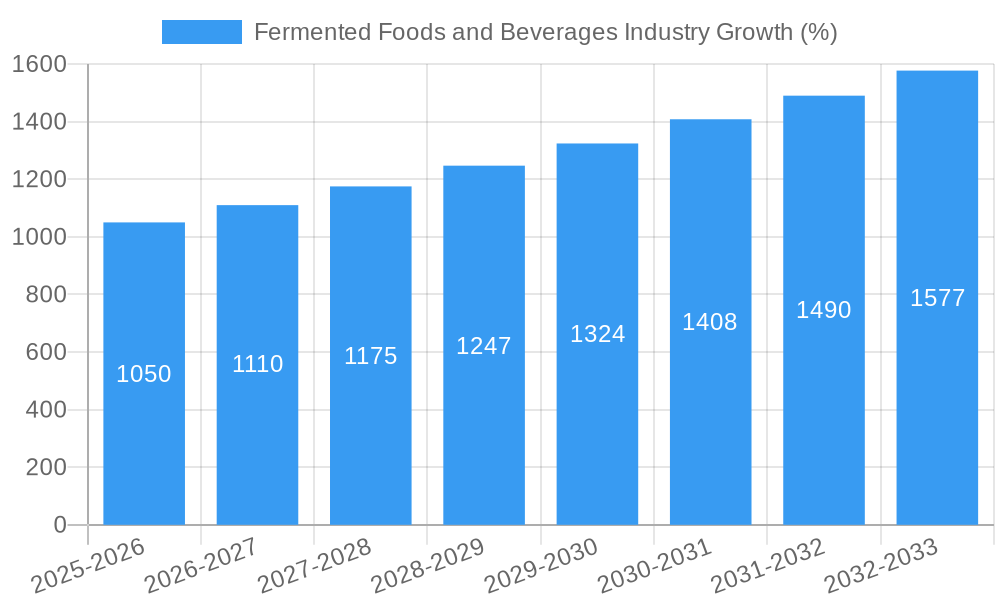
The global fermented foods and beverages market, valued at approximately $XX million in 2025, is projected to experience robust growth, driven by a compound annual growth rate (CAGR) of 6.70% from 2025 to 2033. This expansion is fueled by several key factors. The rising consumer awareness of the health benefits associated with fermented foods and beverages, such as improved gut health and boosted immunity, is a significant driver. Growing demand for probiotic-rich products and functional foods further contributes to market growth. The increasing popularity of plant-based diets and the exploration of innovative fermentation techniques to create unique flavors and textures are also impacting market dynamics. Furthermore, the expansion of online retail channels provides convenient access for consumers, while the diversification of product offerings, including fermented beverages like kombucha and kefir beyond traditional yogurt and sauerkraut, fuels market expansion. The market is segmented by product type (fermented foods, other fermented foods, fermented beverages) and distribution channel (supermarkets/hypermarkets, convenience stores, online retail stores, and others), reflecting diverse consumer preferences and distribution strategies.
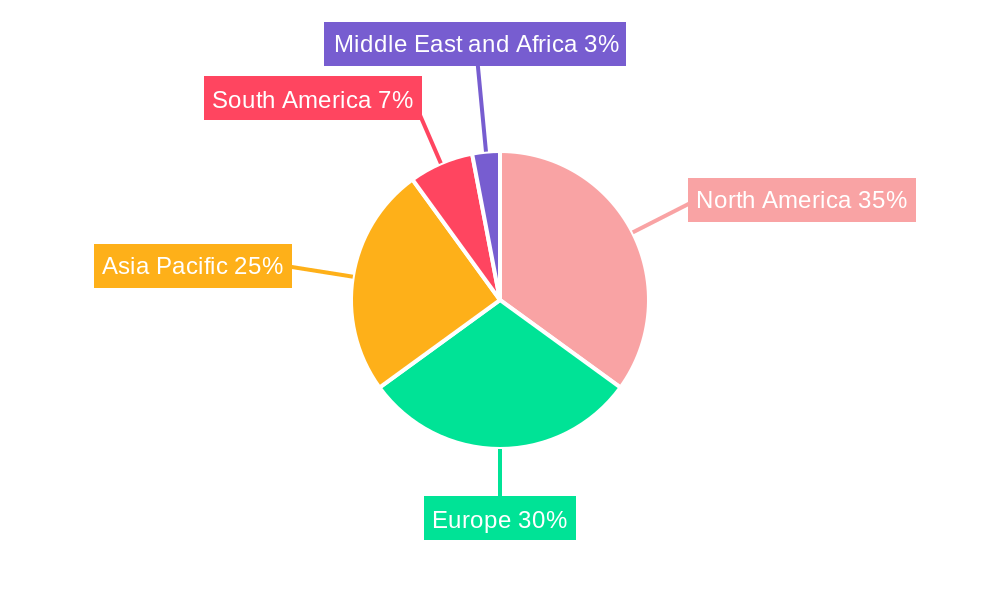
Despite the favorable market trends, certain challenges remain. Competition among established players like PepsiCo, Yakult Honsha, and Danone, along with emerging smaller brands, creates a competitive landscape. Maintaining consistent product quality and addressing consumer concerns regarding potential negative effects from certain fermented products are essential. Fluctuations in raw material costs and regulatory changes related to food safety and labeling also present potential constraints to market growth. Regional variations in consumer preferences and dietary habits influence the market's geographical segmentation, with North America and Europe currently holding significant market shares, while Asia Pacific is projected to experience substantial growth given its expanding middle class and evolving dietary preferences. The market's future trajectory will depend on the successful navigation of these challenges and the continued innovation within the industry.
Fermented Foods and Beverages Industry: A Comprehensive Market Report (2019-2033)
This comprehensive report provides an in-depth analysis of the Fermented Foods and Beverages industry, encompassing market dynamics, growth trends, competitive landscape, and future outlook. The study period covers 2019-2033, with 2025 as the base and estimated year. The report segments the market by Type (Fermented Food, Other Fermented Food, Fermented Beverages) and Distribution Channel (Supermarket/Hypermarket, Convenience Store, Online Retail Stores, Other Distribution Channels). Key players analyzed include PepsiCo Inc, Yakult Honsha Co Ltd, Lactalis Group, Chobani Inc, Heineken N V, Constellation Brands Inc, BioGaia, The Boston Beer Company, Danone S A, Anheuser-Busch InBev SA/NV, Fonterra Co-operative Group Limited, and Nestlé S A. The report's findings offer invaluable insights for industry professionals, investors, and stakeholders seeking to navigate this dynamic market. The global market size is projected to reach xx Million by 2033.
Fermented Foods and Beverages Industry Market Dynamics & Structure
The fermented foods and beverages market is characterized by a moderately concentrated structure, with a few major players holding significant market share. Technological innovation, particularly in probiotic strains and preservation techniques, is a key driver. Stringent regulatory frameworks concerning food safety and labeling influence product development and market access. Competitive substitutes, including non-fermented alternatives, exert pressure on pricing and market penetration. The end-user demographic is expanding, driven by increasing health consciousness and demand for functional foods. M&A activity is relatively frequent, with larger companies acquiring smaller, specialized firms to enhance their product portfolios and expand market reach.
- Market Concentration: The top 5 players hold approximately xx% of the global market share in 2025.
- Technological Innovation: Focus on enhancing probiotic efficacy, shelf life extension, and novel flavor profiles.
- Regulatory Framework: Stringent regulations on labeling, food safety, and health claims impact market entry and product development.
- Competitive Substitutes: Non-fermented alternatives and similar products compete for consumer preference and market share.
- End-User Demographics: Growing demand from health-conscious consumers, particularly millennials and Gen Z, drives market expansion.
- M&A Trends: An average of xx M&A deals were recorded annually during the historical period (2019-2024).
Fermented Foods and Beverages Industry Growth Trends & Insights
The fermented foods and beverages market experienced a CAGR of xx% during the historical period (2019-2024), driven by increasing consumer awareness of the health benefits of probiotics and fermented products. Market penetration is highest in developed regions, with emerging markets showing significant growth potential. Technological disruptions, such as improved fermentation processes and personalized nutrition solutions, are transforming the industry landscape. Consumer behavior is shifting towards healthier, functional foods, favoring fermented products due to their perceived health benefits. This trend, combined with growing demand for convenient, ready-to-consume products, is expected to propel market growth. The market is expected to reach xx Million by 2033 with a projected CAGR of xx% during the forecast period.
Dominant Regions, Countries, or Segments in Fermented Foods and Beverages Industry
North America and Europe currently dominate the market, driven by high consumer awareness of health benefits and established distribution networks. However, Asia-Pacific is expected to witness the fastest growth due to rising disposable incomes, changing lifestyles, and increased adoption of Western dietary habits. Within the segments, fermented beverages show higher growth rates compared to fermented foods due to their convenience and refreshing attributes. Supermarket/Hypermarkets remain the dominant distribution channel, though online retail stores are gaining traction, particularly amongst younger consumers.
- Key Drivers:
- North America & Europe: High consumer awareness, robust distribution infrastructure, and established health-conscious culture.
- Asia-Pacific: Rising disposable incomes, changing lifestyles, and increasing health awareness.
- Supermarket/Hypermarket Channel: Wide reach, established supply chains, and extensive product availability.
- Online Retail Stores: Convenience and growing e-commerce penetration.
Fermented Foods and Beverages Industry Product Landscape
Product innovation is focused on enhancing taste, texture, and nutritional value. New product launches frequently emphasize unique selling propositions, such as improved probiotic strains, added functional ingredients, and convenient formats. Technological advancements in fermentation processes, preservation techniques, and packaging contribute to improved product quality and shelf life. The increasing demand for organic, plant-based, and low-sugar options drives product diversification and caters to evolving consumer preferences.
Key Drivers, Barriers & Challenges in Fermented Foods and Beverages Industry
Key Drivers: Growing health awareness, increasing demand for functional foods, rising disposable incomes, and technological advancements in fermentation processes and packaging. Government support for the food processing industry and favorable regulations are also key drivers.
Key Challenges: Stringent regulatory compliance, concerns regarding food safety and labeling accuracy, fluctuating raw material prices, and intense competition from established players and new entrants. Supply chain disruptions can also impact production and distribution, particularly during periods of economic uncertainty. These factors could significantly influence market growth and profitability.
Emerging Opportunities in Fermented Foods and Beverages Industry
Untapped markets in developing countries, growing demand for personalized nutrition, and the increasing popularity of fermented products in food service applications represent significant opportunities. Innovative applications of fermentation technology in areas such as food preservation and waste reduction also present potential avenues for growth. Evolving consumer preferences toward natural and organic products create opportunities for producers who can cater to these demands.
Growth Accelerators in the Fermented Foods and Beverages Industry Industry
Technological breakthroughs in fermentation technology, such as precision fermentation and advanced probiotic strains, are expected to drive growth. Strategic partnerships between food manufacturers and biotech companies, aimed at developing innovative products and expanding market reach, will accelerate market expansion. Investing in research and development to improve product quality, shelf life, and convenience will also stimulate growth. The expansion into new geographical markets and the development of novel product formats and flavors will also greatly benefit the fermented food and beverage industry.
Key Players Shaping the Fermented Foods and Beverages Industry Market
- PepsiCo Inc
- Yakult Honsha Co Ltd
- Lactalis Group
- Chobani Inc
- Heineken N V
- Constellation Brands Inc
- BioGaia
- The Boston Beer Company
- Danone S A
- Anheuser-Busch InBev SA/NV
- Fonterra Co-operative Group Limited
- Nestlé S A
Notable Milestones in Fermented Foods and Beverages Industry Sector
- May 2022: Nurture (Fonterra) launched cultured milk in Singapore.
- June 2022: Danone launched Activa+ drinkable yogurt.
- September 2022: Garden of Life (Nestlé) launched probiotic drinks for children in China.
In-Depth Fermented Foods and Beverages Industry Market Outlook
The fermented foods and beverages market is poised for robust growth, driven by several factors. The increasing health consciousness among consumers and the rise in demand for functional foods will continue to fuel market expansion. The introduction of innovative products with improved taste and functionality coupled with strategic partnerships will drive market growth. The industry will witness further product diversification with a focus on convenience, natural ingredients, and personalized nutrition, creating ample opportunities for players willing to adapt and innovate.
Fermented Foods and Beverages Industry Segmentation
-
1. Type
-
1.1. Fermented Food
- 1.1.1. Yogurt
- 1.1.2. Tofu
- 1.1.3. Tempeh
- 1.1.4. Sauerkraut / Fermented Veggies and Pickles
- 1.1.5. Cheese
- 1.1.6. Other Fermented Food
-
1.2. Fermented Beverages
- 1.2.1. Yogurt Drink/Smoothies
- 1.2.2. Kombucha
- 1.2.3. Kefir
- 1.2.4. Other Fermented Beverages
-
1.1. Fermented Food
-
2. Distribution Channel
- 2.1. Supermarket/Hypermarket
- 2.2. Convenience Store
- 2.3. Online Retail Stores
- 2.4. Other Distribution Channels
Fermented Foods and Beverages Industry Segmentation By Geography
-
1. North America
- 1.1. United States
- 1.2. Canada
- 1.3. Mexico
- 1.4. Rest of North America
-
2. Europe
- 2.1. Germany
- 2.2. United Kingdom
- 2.3. France
- 2.4. Russia
- 2.5. Italy
- 2.6. Spain
- 2.7. Rest of Europe
-
3. Asia Pacific
- 3.1. India
- 3.2. China
- 3.3. Australia
- 3.4. Japan
- 3.5. Rest of Asia Pacific
-
4. South America
- 4.1. Brazil
- 4.2. Argentina
- 4.3. Rest of South America
-
5. Middle East and Africa
- 5.1. United Arab Emirates
- 5.2. South Africa
- 5.3. Rest of Middle East and Africa
Fermented Foods and Beverages Industry REPORT HIGHLIGHTS
| Aspects | Details |
|---|---|
| Study Period | 2019-2033 |
| Base Year | 2024 |
| Estimated Year | 2025 |
| Forecast Period | 2025-2033 |
| Historical Period | 2019-2024 |
| Growth Rate | CAGR of 6.70% from 2019-2033 |
| Segmentation |
|
Table of Contents
- 1. Introduction
- 1.1. Research Scope
- 1.2. Market Segmentation
- 1.3. Research Methodology
- 1.4. Definitions and Assumptions
- 2. Executive Summary
- 2.1. Introduction
- 3. Market Dynamics
- 3.1. Introduction
- 3.2. Market Drivers
- 3.2.1. Increasing Inclination Towards Health-based Food Products; Increasing Vegan Food Consumption
- 3.3. Market Restrains
- 3.3.1. The Risk of Contamination of Food is High
- 3.4. Market Trends
- 3.4.1. Rising Awareness About the Health Benefits of Fermented Food and Beverages
- 4. Market Factor Analysis
- 4.1. Porters Five Forces
- 4.2. Supply/Value Chain
- 4.3. PESTEL analysis
- 4.4. Market Entropy
- 4.5. Patent/Trademark Analysis
- 5. Global Fermented Foods and Beverages Industry Analysis, Insights and Forecast, 2019-2031
- 5.1. Market Analysis, Insights and Forecast - by Type
- 5.1.1. Fermented Food
- 5.1.1.1. Yogurt
- 5.1.1.2. Tofu
- 5.1.1.3. Tempeh
- 5.1.1.4. Sauerkraut / Fermented Veggies and Pickles
- 5.1.1.5. Cheese
- 5.1.1.6. Other Fermented Food
- 5.1.2. Fermented Beverages
- 5.1.2.1. Yogurt Drink/Smoothies
- 5.1.2.2. Kombucha
- 5.1.2.3. Kefir
- 5.1.2.4. Other Fermented Beverages
- 5.1.1. Fermented Food
- 5.2. Market Analysis, Insights and Forecast - by Distribution Channel
- 5.2.1. Supermarket/Hypermarket
- 5.2.2. Convenience Store
- 5.2.3. Online Retail Stores
- 5.2.4. Other Distribution Channels
- 5.3. Market Analysis, Insights and Forecast - by Region
- 5.3.1. North America
- 5.3.2. Europe
- 5.3.3. Asia Pacific
- 5.3.4. South America
- 5.3.5. Middle East and Africa
- 5.1. Market Analysis, Insights and Forecast - by Type
- 6. North America Fermented Foods and Beverages Industry Analysis, Insights and Forecast, 2019-2031
- 6.1. Market Analysis, Insights and Forecast - by Type
- 6.1.1. Fermented Food
- 6.1.1.1. Yogurt
- 6.1.1.2. Tofu
- 6.1.1.3. Tempeh
- 6.1.1.4. Sauerkraut / Fermented Veggies and Pickles
- 6.1.1.5. Cheese
- 6.1.1.6. Other Fermented Food
- 6.1.2. Fermented Beverages
- 6.1.2.1. Yogurt Drink/Smoothies
- 6.1.2.2. Kombucha
- 6.1.2.3. Kefir
- 6.1.2.4. Other Fermented Beverages
- 6.1.1. Fermented Food
- 6.2. Market Analysis, Insights and Forecast - by Distribution Channel
- 6.2.1. Supermarket/Hypermarket
- 6.2.2. Convenience Store
- 6.2.3. Online Retail Stores
- 6.2.4. Other Distribution Channels
- 6.1. Market Analysis, Insights and Forecast - by Type
- 7. Europe Fermented Foods and Beverages Industry Analysis, Insights and Forecast, 2019-2031
- 7.1. Market Analysis, Insights and Forecast - by Type
- 7.1.1. Fermented Food
- 7.1.1.1. Yogurt
- 7.1.1.2. Tofu
- 7.1.1.3. Tempeh
- 7.1.1.4. Sauerkraut / Fermented Veggies and Pickles
- 7.1.1.5. Cheese
- 7.1.1.6. Other Fermented Food
- 7.1.2. Fermented Beverages
- 7.1.2.1. Yogurt Drink/Smoothies
- 7.1.2.2. Kombucha
- 7.1.2.3. Kefir
- 7.1.2.4. Other Fermented Beverages
- 7.1.1. Fermented Food
- 7.2. Market Analysis, Insights and Forecast - by Distribution Channel
- 7.2.1. Supermarket/Hypermarket
- 7.2.2. Convenience Store
- 7.2.3. Online Retail Stores
- 7.2.4. Other Distribution Channels
- 7.1. Market Analysis, Insights and Forecast - by Type
- 8. Asia Pacific Fermented Foods and Beverages Industry Analysis, Insights and Forecast, 2019-2031
- 8.1. Market Analysis, Insights and Forecast - by Type
- 8.1.1. Fermented Food
- 8.1.1.1. Yogurt
- 8.1.1.2. Tofu
- 8.1.1.3. Tempeh
- 8.1.1.4. Sauerkraut / Fermented Veggies and Pickles
- 8.1.1.5. Cheese
- 8.1.1.6. Other Fermented Food
- 8.1.2. Fermented Beverages
- 8.1.2.1. Yogurt Drink/Smoothies
- 8.1.2.2. Kombucha
- 8.1.2.3. Kefir
- 8.1.2.4. Other Fermented Beverages
- 8.1.1. Fermented Food
- 8.2. Market Analysis, Insights and Forecast - by Distribution Channel
- 8.2.1. Supermarket/Hypermarket
- 8.2.2. Convenience Store
- 8.2.3. Online Retail Stores
- 8.2.4. Other Distribution Channels
- 8.1. Market Analysis, Insights and Forecast - by Type
- 9. South America Fermented Foods and Beverages Industry Analysis, Insights and Forecast, 2019-2031
- 9.1. Market Analysis, Insights and Forecast - by Type
- 9.1.1. Fermented Food
- 9.1.1.1. Yogurt
- 9.1.1.2. Tofu
- 9.1.1.3. Tempeh
- 9.1.1.4. Sauerkraut / Fermented Veggies and Pickles
- 9.1.1.5. Cheese
- 9.1.1.6. Other Fermented Food
- 9.1.2. Fermented Beverages
- 9.1.2.1. Yogurt Drink/Smoothies
- 9.1.2.2. Kombucha
- 9.1.2.3. Kefir
- 9.1.2.4. Other Fermented Beverages
- 9.1.1. Fermented Food
- 9.2. Market Analysis, Insights and Forecast - by Distribution Channel
- 9.2.1. Supermarket/Hypermarket
- 9.2.2. Convenience Store
- 9.2.3. Online Retail Stores
- 9.2.4. Other Distribution Channels
- 9.1. Market Analysis, Insights and Forecast - by Type
- 10. Middle East and Africa Fermented Foods and Beverages Industry Analysis, Insights and Forecast, 2019-2031
- 10.1. Market Analysis, Insights and Forecast - by Type
- 10.1.1. Fermented Food
- 10.1.1.1. Yogurt
- 10.1.1.2. Tofu
- 10.1.1.3. Tempeh
- 10.1.1.4. Sauerkraut / Fermented Veggies and Pickles
- 10.1.1.5. Cheese
- 10.1.1.6. Other Fermented Food
- 10.1.2. Fermented Beverages
- 10.1.2.1. Yogurt Drink/Smoothies
- 10.1.2.2. Kombucha
- 10.1.2.3. Kefir
- 10.1.2.4. Other Fermented Beverages
- 10.1.1. Fermented Food
- 10.2. Market Analysis, Insights and Forecast - by Distribution Channel
- 10.2.1. Supermarket/Hypermarket
- 10.2.2. Convenience Store
- 10.2.3. Online Retail Stores
- 10.2.4. Other Distribution Channels
- 10.1. Market Analysis, Insights and Forecast - by Type
- 11. North America Fermented Foods and Beverages Industry Analysis, Insights and Forecast, 2019-2031
- 11.1. Market Analysis, Insights and Forecast - By Country/Sub-region
- 11.1.1 United States
- 11.1.2 Canada
- 11.1.3 Mexico
- 11.1.4 Rest of North America
- 12. Europe Fermented Foods and Beverages Industry Analysis, Insights and Forecast, 2019-2031
- 12.1. Market Analysis, Insights and Forecast - By Country/Sub-region
- 12.1.1 Germany
- 12.1.2 United Kingdom
- 12.1.3 France
- 12.1.4 Russia
- 12.1.5 Italy
- 12.1.6 Spain
- 12.1.7 Rest of Europe
- 13. Asia Pacific Fermented Foods and Beverages Industry Analysis, Insights and Forecast, 2019-2031
- 13.1. Market Analysis, Insights and Forecast - By Country/Sub-region
- 13.1.1 India
- 13.1.2 China
- 13.1.3 Australia
- 13.1.4 Japan
- 13.1.5 Rest of Asia Pacific
- 14. South America Fermented Foods and Beverages Industry Analysis, Insights and Forecast, 2019-2031
- 14.1. Market Analysis, Insights and Forecast - By Country/Sub-region
- 14.1.1 Brazil
- 14.1.2 Argentina
- 14.1.3 Rest of South America
- 15. Middle East and Africa Fermented Foods and Beverages Industry Analysis, Insights and Forecast, 2019-2031
- 15.1. Market Analysis, Insights and Forecast - By Country/Sub-region
- 15.1.1 United Arab Emirates
- 15.1.2 South Africa
- 15.1.3 Rest of Middle East and Africa
- 16. Competitive Analysis
- 16.1. Global Market Share Analysis 2024
- 16.2. Company Profiles
- 16.2.1 PepsiCo Inc
- 16.2.1.1. Overview
- 16.2.1.2. Products
- 16.2.1.3. SWOT Analysis
- 16.2.1.4. Recent Developments
- 16.2.1.5. Financials (Based on Availability)
- 16.2.2 Yakult Honsha Co Ltd
- 16.2.2.1. Overview
- 16.2.2.2. Products
- 16.2.2.3. SWOT Analysis
- 16.2.2.4. Recent Developments
- 16.2.2.5. Financials (Based on Availability)
- 16.2.3 Lactalis Group
- 16.2.3.1. Overview
- 16.2.3.2. Products
- 16.2.3.3. SWOT Analysis
- 16.2.3.4. Recent Developments
- 16.2.3.5. Financials (Based on Availability)
- 16.2.4 Chobani Inc *List Not Exhaustive
- 16.2.4.1. Overview
- 16.2.4.2. Products
- 16.2.4.3. SWOT Analysis
- 16.2.4.4. Recent Developments
- 16.2.4.5. Financials (Based on Availability)
- 16.2.5 Heineken N V
- 16.2.5.1. Overview
- 16.2.5.2. Products
- 16.2.5.3. SWOT Analysis
- 16.2.5.4. Recent Developments
- 16.2.5.5. Financials (Based on Availability)
- 16.2.6 Constellation Brands Inc
- 16.2.6.1. Overview
- 16.2.6.2. Products
- 16.2.6.3. SWOT Analysis
- 16.2.6.4. Recent Developments
- 16.2.6.5. Financials (Based on Availability)
- 16.2.7 BioGaia
- 16.2.7.1. Overview
- 16.2.7.2. Products
- 16.2.7.3. SWOT Analysis
- 16.2.7.4. Recent Developments
- 16.2.7.5. Financials (Based on Availability)
- 16.2.8 The Boston Beer Company
- 16.2.8.1. Overview
- 16.2.8.2. Products
- 16.2.8.3. SWOT Analysis
- 16.2.8.4. Recent Developments
- 16.2.8.5. Financials (Based on Availability)
- 16.2.9 Danone S A
- 16.2.9.1. Overview
- 16.2.9.2. Products
- 16.2.9.3. SWOT Analysis
- 16.2.9.4. Recent Developments
- 16.2.9.5. Financials (Based on Availability)
- 16.2.10 Anheuser-Busch InBev SA/NV
- 16.2.10.1. Overview
- 16.2.10.2. Products
- 16.2.10.3. SWOT Analysis
- 16.2.10.4. Recent Developments
- 16.2.10.5. Financials (Based on Availability)
- 16.2.11 Fonterra Co-operative Group Limited
- 16.2.11.1. Overview
- 16.2.11.2. Products
- 16.2.11.3. SWOT Analysis
- 16.2.11.4. Recent Developments
- 16.2.11.5. Financials (Based on Availability)
- 16.2.12 Nestlé S A
- 16.2.12.1. Overview
- 16.2.12.2. Products
- 16.2.12.3. SWOT Analysis
- 16.2.12.4. Recent Developments
- 16.2.12.5. Financials (Based on Availability)
- 16.2.1 PepsiCo Inc
List of Figures
- Figure 1: Global Fermented Foods and Beverages Industry Revenue Breakdown (Million, %) by Region 2024 & 2032
- Figure 2: Global Fermented Foods and Beverages Industry Volume Breakdown (K Units, %) by Region 2024 & 2032
- Figure 3: North America Fermented Foods and Beverages Industry Revenue (Million), by Country 2024 & 2032
- Figure 4: North America Fermented Foods and Beverages Industry Volume (K Units), by Country 2024 & 2032
- Figure 5: North America Fermented Foods and Beverages Industry Revenue Share (%), by Country 2024 & 2032
- Figure 6: North America Fermented Foods and Beverages Industry Volume Share (%), by Country 2024 & 2032
- Figure 7: Europe Fermented Foods and Beverages Industry Revenue (Million), by Country 2024 & 2032
- Figure 8: Europe Fermented Foods and Beverages Industry Volume (K Units), by Country 2024 & 2032
- Figure 9: Europe Fermented Foods and Beverages Industry Revenue Share (%), by Country 2024 & 2032
- Figure 10: Europe Fermented Foods and Beverages Industry Volume Share (%), by Country 2024 & 2032
- Figure 11: Asia Pacific Fermented Foods and Beverages Industry Revenue (Million), by Country 2024 & 2032
- Figure 12: Asia Pacific Fermented Foods and Beverages Industry Volume (K Units), by Country 2024 & 2032
- Figure 13: Asia Pacific Fermented Foods and Beverages Industry Revenue Share (%), by Country 2024 & 2032
- Figure 14: Asia Pacific Fermented Foods and Beverages Industry Volume Share (%), by Country 2024 & 2032
- Figure 15: South America Fermented Foods and Beverages Industry Revenue (Million), by Country 2024 & 2032
- Figure 16: South America Fermented Foods and Beverages Industry Volume (K Units), by Country 2024 & 2032
- Figure 17: South America Fermented Foods and Beverages Industry Revenue Share (%), by Country 2024 & 2032
- Figure 18: South America Fermented Foods and Beverages Industry Volume Share (%), by Country 2024 & 2032
- Figure 19: Middle East and Africa Fermented Foods and Beverages Industry Revenue (Million), by Country 2024 & 2032
- Figure 20: Middle East and Africa Fermented Foods and Beverages Industry Volume (K Units), by Country 2024 & 2032
- Figure 21: Middle East and Africa Fermented Foods and Beverages Industry Revenue Share (%), by Country 2024 & 2032
- Figure 22: Middle East and Africa Fermented Foods and Beverages Industry Volume Share (%), by Country 2024 & 2032
- Figure 23: North America Fermented Foods and Beverages Industry Revenue (Million), by Type 2024 & 2032
- Figure 24: North America Fermented Foods and Beverages Industry Volume (K Units), by Type 2024 & 2032
- Figure 25: North America Fermented Foods and Beverages Industry Revenue Share (%), by Type 2024 & 2032
- Figure 26: North America Fermented Foods and Beverages Industry Volume Share (%), by Type 2024 & 2032
- Figure 27: North America Fermented Foods and Beverages Industry Revenue (Million), by Distribution Channel 2024 & 2032
- Figure 28: North America Fermented Foods and Beverages Industry Volume (K Units), by Distribution Channel 2024 & 2032
- Figure 29: North America Fermented Foods and Beverages Industry Revenue Share (%), by Distribution Channel 2024 & 2032
- Figure 30: North America Fermented Foods and Beverages Industry Volume Share (%), by Distribution Channel 2024 & 2032
- Figure 31: North America Fermented Foods and Beverages Industry Revenue (Million), by Country 2024 & 2032
- Figure 32: North America Fermented Foods and Beverages Industry Volume (K Units), by Country 2024 & 2032
- Figure 33: North America Fermented Foods and Beverages Industry Revenue Share (%), by Country 2024 & 2032
- Figure 34: North America Fermented Foods and Beverages Industry Volume Share (%), by Country 2024 & 2032
- Figure 35: Europe Fermented Foods and Beverages Industry Revenue (Million), by Type 2024 & 2032
- Figure 36: Europe Fermented Foods and Beverages Industry Volume (K Units), by Type 2024 & 2032
- Figure 37: Europe Fermented Foods and Beverages Industry Revenue Share (%), by Type 2024 & 2032
- Figure 38: Europe Fermented Foods and Beverages Industry Volume Share (%), by Type 2024 & 2032
- Figure 39: Europe Fermented Foods and Beverages Industry Revenue (Million), by Distribution Channel 2024 & 2032
- Figure 40: Europe Fermented Foods and Beverages Industry Volume (K Units), by Distribution Channel 2024 & 2032
- Figure 41: Europe Fermented Foods and Beverages Industry Revenue Share (%), by Distribution Channel 2024 & 2032
- Figure 42: Europe Fermented Foods and Beverages Industry Volume Share (%), by Distribution Channel 2024 & 2032
- Figure 43: Europe Fermented Foods and Beverages Industry Revenue (Million), by Country 2024 & 2032
- Figure 44: Europe Fermented Foods and Beverages Industry Volume (K Units), by Country 2024 & 2032
- Figure 45: Europe Fermented Foods and Beverages Industry Revenue Share (%), by Country 2024 & 2032
- Figure 46: Europe Fermented Foods and Beverages Industry Volume Share (%), by Country 2024 & 2032
- Figure 47: Asia Pacific Fermented Foods and Beverages Industry Revenue (Million), by Type 2024 & 2032
- Figure 48: Asia Pacific Fermented Foods and Beverages Industry Volume (K Units), by Type 2024 & 2032
- Figure 49: Asia Pacific Fermented Foods and Beverages Industry Revenue Share (%), by Type 2024 & 2032
- Figure 50: Asia Pacific Fermented Foods and Beverages Industry Volume Share (%), by Type 2024 & 2032
- Figure 51: Asia Pacific Fermented Foods and Beverages Industry Revenue (Million), by Distribution Channel 2024 & 2032
- Figure 52: Asia Pacific Fermented Foods and Beverages Industry Volume (K Units), by Distribution Channel 2024 & 2032
- Figure 53: Asia Pacific Fermented Foods and Beverages Industry Revenue Share (%), by Distribution Channel 2024 & 2032
- Figure 54: Asia Pacific Fermented Foods and Beverages Industry Volume Share (%), by Distribution Channel 2024 & 2032
- Figure 55: Asia Pacific Fermented Foods and Beverages Industry Revenue (Million), by Country 2024 & 2032
- Figure 56: Asia Pacific Fermented Foods and Beverages Industry Volume (K Units), by Country 2024 & 2032
- Figure 57: Asia Pacific Fermented Foods and Beverages Industry Revenue Share (%), by Country 2024 & 2032
- Figure 58: Asia Pacific Fermented Foods and Beverages Industry Volume Share (%), by Country 2024 & 2032
- Figure 59: South America Fermented Foods and Beverages Industry Revenue (Million), by Type 2024 & 2032
- Figure 60: South America Fermented Foods and Beverages Industry Volume (K Units), by Type 2024 & 2032
- Figure 61: South America Fermented Foods and Beverages Industry Revenue Share (%), by Type 2024 & 2032
- Figure 62: South America Fermented Foods and Beverages Industry Volume Share (%), by Type 2024 & 2032
- Figure 63: South America Fermented Foods and Beverages Industry Revenue (Million), by Distribution Channel 2024 & 2032
- Figure 64: South America Fermented Foods and Beverages Industry Volume (K Units), by Distribution Channel 2024 & 2032
- Figure 65: South America Fermented Foods and Beverages Industry Revenue Share (%), by Distribution Channel 2024 & 2032
- Figure 66: South America Fermented Foods and Beverages Industry Volume Share (%), by Distribution Channel 2024 & 2032
- Figure 67: South America Fermented Foods and Beverages Industry Revenue (Million), by Country 2024 & 2032
- Figure 68: South America Fermented Foods and Beverages Industry Volume (K Units), by Country 2024 & 2032
- Figure 69: South America Fermented Foods and Beverages Industry Revenue Share (%), by Country 2024 & 2032
- Figure 70: South America Fermented Foods and Beverages Industry Volume Share (%), by Country 2024 & 2032
- Figure 71: Middle East and Africa Fermented Foods and Beverages Industry Revenue (Million), by Type 2024 & 2032
- Figure 72: Middle East and Africa Fermented Foods and Beverages Industry Volume (K Units), by Type 2024 & 2032
- Figure 73: Middle East and Africa Fermented Foods and Beverages Industry Revenue Share (%), by Type 2024 & 2032
- Figure 74: Middle East and Africa Fermented Foods and Beverages Industry Volume Share (%), by Type 2024 & 2032
- Figure 75: Middle East and Africa Fermented Foods and Beverages Industry Revenue (Million), by Distribution Channel 2024 & 2032
- Figure 76: Middle East and Africa Fermented Foods and Beverages Industry Volume (K Units), by Distribution Channel 2024 & 2032
- Figure 77: Middle East and Africa Fermented Foods and Beverages Industry Revenue Share (%), by Distribution Channel 2024 & 2032
- Figure 78: Middle East and Africa Fermented Foods and Beverages Industry Volume Share (%), by Distribution Channel 2024 & 2032
- Figure 79: Middle East and Africa Fermented Foods and Beverages Industry Revenue (Million), by Country 2024 & 2032
- Figure 80: Middle East and Africa Fermented Foods and Beverages Industry Volume (K Units), by Country 2024 & 2032
- Figure 81: Middle East and Africa Fermented Foods and Beverages Industry Revenue Share (%), by Country 2024 & 2032
- Figure 82: Middle East and Africa Fermented Foods and Beverages Industry Volume Share (%), by Country 2024 & 2032
List of Tables
- Table 1: Global Fermented Foods and Beverages Industry Revenue Million Forecast, by Region 2019 & 2032
- Table 2: Global Fermented Foods and Beverages Industry Volume K Units Forecast, by Region 2019 & 2032
- Table 3: Global Fermented Foods and Beverages Industry Revenue Million Forecast, by Type 2019 & 2032
- Table 4: Global Fermented Foods and Beverages Industry Volume K Units Forecast, by Type 2019 & 2032
- Table 5: Global Fermented Foods and Beverages Industry Revenue Million Forecast, by Distribution Channel 2019 & 2032
- Table 6: Global Fermented Foods and Beverages Industry Volume K Units Forecast, by Distribution Channel 2019 & 2032
- Table 7: Global Fermented Foods and Beverages Industry Revenue Million Forecast, by Region 2019 & 2032
- Table 8: Global Fermented Foods and Beverages Industry Volume K Units Forecast, by Region 2019 & 2032
- Table 9: Global Fermented Foods and Beverages Industry Revenue Million Forecast, by Country 2019 & 2032
- Table 10: Global Fermented Foods and Beverages Industry Volume K Units Forecast, by Country 2019 & 2032
- Table 11: United States Fermented Foods and Beverages Industry Revenue (Million) Forecast, by Application 2019 & 2032
- Table 12: United States Fermented Foods and Beverages Industry Volume (K Units) Forecast, by Application 2019 & 2032
- Table 13: Canada Fermented Foods and Beverages Industry Revenue (Million) Forecast, by Application 2019 & 2032
- Table 14: Canada Fermented Foods and Beverages Industry Volume (K Units) Forecast, by Application 2019 & 2032
- Table 15: Mexico Fermented Foods and Beverages Industry Revenue (Million) Forecast, by Application 2019 & 2032
- Table 16: Mexico Fermented Foods and Beverages Industry Volume (K Units) Forecast, by Application 2019 & 2032
- Table 17: Rest of North America Fermented Foods and Beverages Industry Revenue (Million) Forecast, by Application 2019 & 2032
- Table 18: Rest of North America Fermented Foods and Beverages Industry Volume (K Units) Forecast, by Application 2019 & 2032
- Table 19: Global Fermented Foods and Beverages Industry Revenue Million Forecast, by Country 2019 & 2032
- Table 20: Global Fermented Foods and Beverages Industry Volume K Units Forecast, by Country 2019 & 2032
- Table 21: Germany Fermented Foods and Beverages Industry Revenue (Million) Forecast, by Application 2019 & 2032
- Table 22: Germany Fermented Foods and Beverages Industry Volume (K Units) Forecast, by Application 2019 & 2032
- Table 23: United Kingdom Fermented Foods and Beverages Industry Revenue (Million) Forecast, by Application 2019 & 2032
- Table 24: United Kingdom Fermented Foods and Beverages Industry Volume (K Units) Forecast, by Application 2019 & 2032
- Table 25: France Fermented Foods and Beverages Industry Revenue (Million) Forecast, by Application 2019 & 2032
- Table 26: France Fermented Foods and Beverages Industry Volume (K Units) Forecast, by Application 2019 & 2032
- Table 27: Russia Fermented Foods and Beverages Industry Revenue (Million) Forecast, by Application 2019 & 2032
- Table 28: Russia Fermented Foods and Beverages Industry Volume (K Units) Forecast, by Application 2019 & 2032
- Table 29: Italy Fermented Foods and Beverages Industry Revenue (Million) Forecast, by Application 2019 & 2032
- Table 30: Italy Fermented Foods and Beverages Industry Volume (K Units) Forecast, by Application 2019 & 2032
- Table 31: Spain Fermented Foods and Beverages Industry Revenue (Million) Forecast, by Application 2019 & 2032
- Table 32: Spain Fermented Foods and Beverages Industry Volume (K Units) Forecast, by Application 2019 & 2032
- Table 33: Rest of Europe Fermented Foods and Beverages Industry Revenue (Million) Forecast, by Application 2019 & 2032
- Table 34: Rest of Europe Fermented Foods and Beverages Industry Volume (K Units) Forecast, by Application 2019 & 2032
- Table 35: Global Fermented Foods and Beverages Industry Revenue Million Forecast, by Country 2019 & 2032
- Table 36: Global Fermented Foods and Beverages Industry Volume K Units Forecast, by Country 2019 & 2032
- Table 37: India Fermented Foods and Beverages Industry Revenue (Million) Forecast, by Application 2019 & 2032
- Table 38: India Fermented Foods and Beverages Industry Volume (K Units) Forecast, by Application 2019 & 2032
- Table 39: China Fermented Foods and Beverages Industry Revenue (Million) Forecast, by Application 2019 & 2032
- Table 40: China Fermented Foods and Beverages Industry Volume (K Units) Forecast, by Application 2019 & 2032
- Table 41: Australia Fermented Foods and Beverages Industry Revenue (Million) Forecast, by Application 2019 & 2032
- Table 42: Australia Fermented Foods and Beverages Industry Volume (K Units) Forecast, by Application 2019 & 2032
- Table 43: Japan Fermented Foods and Beverages Industry Revenue (Million) Forecast, by Application 2019 & 2032
- Table 44: Japan Fermented Foods and Beverages Industry Volume (K Units) Forecast, by Application 2019 & 2032
- Table 45: Rest of Asia Pacific Fermented Foods and Beverages Industry Revenue (Million) Forecast, by Application 2019 & 2032
- Table 46: Rest of Asia Pacific Fermented Foods and Beverages Industry Volume (K Units) Forecast, by Application 2019 & 2032
- Table 47: Global Fermented Foods and Beverages Industry Revenue Million Forecast, by Country 2019 & 2032
- Table 48: Global Fermented Foods and Beverages Industry Volume K Units Forecast, by Country 2019 & 2032
- Table 49: Brazil Fermented Foods and Beverages Industry Revenue (Million) Forecast, by Application 2019 & 2032
- Table 50: Brazil Fermented Foods and Beverages Industry Volume (K Units) Forecast, by Application 2019 & 2032
- Table 51: Argentina Fermented Foods and Beverages Industry Revenue (Million) Forecast, by Application 2019 & 2032
- Table 52: Argentina Fermented Foods and Beverages Industry Volume (K Units) Forecast, by Application 2019 & 2032
- Table 53: Rest of South America Fermented Foods and Beverages Industry Revenue (Million) Forecast, by Application 2019 & 2032
- Table 54: Rest of South America Fermented Foods and Beverages Industry Volume (K Units) Forecast, by Application 2019 & 2032
- Table 55: Global Fermented Foods and Beverages Industry Revenue Million Forecast, by Country 2019 & 2032
- Table 56: Global Fermented Foods and Beverages Industry Volume K Units Forecast, by Country 2019 & 2032
- Table 57: United Arab Emirates Fermented Foods and Beverages Industry Revenue (Million) Forecast, by Application 2019 & 2032
- Table 58: United Arab Emirates Fermented Foods and Beverages Industry Volume (K Units) Forecast, by Application 2019 & 2032
- Table 59: South Africa Fermented Foods and Beverages Industry Revenue (Million) Forecast, by Application 2019 & 2032
- Table 60: South Africa Fermented Foods and Beverages Industry Volume (K Units) Forecast, by Application 2019 & 2032
- Table 61: Rest of Middle East and Africa Fermented Foods and Beverages Industry Revenue (Million) Forecast, by Application 2019 & 2032
- Table 62: Rest of Middle East and Africa Fermented Foods and Beverages Industry Volume (K Units) Forecast, by Application 2019 & 2032
- Table 63: Global Fermented Foods and Beverages Industry Revenue Million Forecast, by Type 2019 & 2032
- Table 64: Global Fermented Foods and Beverages Industry Volume K Units Forecast, by Type 2019 & 2032
- Table 65: Global Fermented Foods and Beverages Industry Revenue Million Forecast, by Distribution Channel 2019 & 2032
- Table 66: Global Fermented Foods and Beverages Industry Volume K Units Forecast, by Distribution Channel 2019 & 2032
- Table 67: Global Fermented Foods and Beverages Industry Revenue Million Forecast, by Country 2019 & 2032
- Table 68: Global Fermented Foods and Beverages Industry Volume K Units Forecast, by Country 2019 & 2032
- Table 69: United States Fermented Foods and Beverages Industry Revenue (Million) Forecast, by Application 2019 & 2032
- Table 70: United States Fermented Foods and Beverages Industry Volume (K Units) Forecast, by Application 2019 & 2032
- Table 71: Canada Fermented Foods and Beverages Industry Revenue (Million) Forecast, by Application 2019 & 2032
- Table 72: Canada Fermented Foods and Beverages Industry Volume (K Units) Forecast, by Application 2019 & 2032
- Table 73: Mexico Fermented Foods and Beverages Industry Revenue (Million) Forecast, by Application 2019 & 2032
- Table 74: Mexico Fermented Foods and Beverages Industry Volume (K Units) Forecast, by Application 2019 & 2032
- Table 75: Rest of North America Fermented Foods and Beverages Industry Revenue (Million) Forecast, by Application 2019 & 2032
- Table 76: Rest of North America Fermented Foods and Beverages Industry Volume (K Units) Forecast, by Application 2019 & 2032
- Table 77: Global Fermented Foods and Beverages Industry Revenue Million Forecast, by Type 2019 & 2032
- Table 78: Global Fermented Foods and Beverages Industry Volume K Units Forecast, by Type 2019 & 2032
- Table 79: Global Fermented Foods and Beverages Industry Revenue Million Forecast, by Distribution Channel 2019 & 2032
- Table 80: Global Fermented Foods and Beverages Industry Volume K Units Forecast, by Distribution Channel 2019 & 2032
- Table 81: Global Fermented Foods and Beverages Industry Revenue Million Forecast, by Country 2019 & 2032
- Table 82: Global Fermented Foods and Beverages Industry Volume K Units Forecast, by Country 2019 & 2032
- Table 83: Germany Fermented Foods and Beverages Industry Revenue (Million) Forecast, by Application 2019 & 2032
- Table 84: Germany Fermented Foods and Beverages Industry Volume (K Units) Forecast, by Application 2019 & 2032
- Table 85: United Kingdom Fermented Foods and Beverages Industry Revenue (Million) Forecast, by Application 2019 & 2032
- Table 86: United Kingdom Fermented Foods and Beverages Industry Volume (K Units) Forecast, by Application 2019 & 2032
- Table 87: France Fermented Foods and Beverages Industry Revenue (Million) Forecast, by Application 2019 & 2032
- Table 88: France Fermented Foods and Beverages Industry Volume (K Units) Forecast, by Application 2019 & 2032
- Table 89: Russia Fermented Foods and Beverages Industry Revenue (Million) Forecast, by Application 2019 & 2032
- Table 90: Russia Fermented Foods and Beverages Industry Volume (K Units) Forecast, by Application 2019 & 2032
- Table 91: Italy Fermented Foods and Beverages Industry Revenue (Million) Forecast, by Application 2019 & 2032
- Table 92: Italy Fermented Foods and Beverages Industry Volume (K Units) Forecast, by Application 2019 & 2032
- Table 93: Spain Fermented Foods and Beverages Industry Revenue (Million) Forecast, by Application 2019 & 2032
- Table 94: Spain Fermented Foods and Beverages Industry Volume (K Units) Forecast, by Application 2019 & 2032
- Table 95: Rest of Europe Fermented Foods and Beverages Industry Revenue (Million) Forecast, by Application 2019 & 2032
- Table 96: Rest of Europe Fermented Foods and Beverages Industry Volume (K Units) Forecast, by Application 2019 & 2032
- Table 97: Global Fermented Foods and Beverages Industry Revenue Million Forecast, by Type 2019 & 2032
- Table 98: Global Fermented Foods and Beverages Industry Volume K Units Forecast, by Type 2019 & 2032
- Table 99: Global Fermented Foods and Beverages Industry Revenue Million Forecast, by Distribution Channel 2019 & 2032
- Table 100: Global Fermented Foods and Beverages Industry Volume K Units Forecast, by Distribution Channel 2019 & 2032
- Table 101: Global Fermented Foods and Beverages Industry Revenue Million Forecast, by Country 2019 & 2032
- Table 102: Global Fermented Foods and Beverages Industry Volume K Units Forecast, by Country 2019 & 2032
- Table 103: India Fermented Foods and Beverages Industry Revenue (Million) Forecast, by Application 2019 & 2032
- Table 104: India Fermented Foods and Beverages Industry Volume (K Units) Forecast, by Application 2019 & 2032
- Table 105: China Fermented Foods and Beverages Industry Revenue (Million) Forecast, by Application 2019 & 2032
- Table 106: China Fermented Foods and Beverages Industry Volume (K Units) Forecast, by Application 2019 & 2032
- Table 107: Australia Fermented Foods and Beverages Industry Revenue (Million) Forecast, by Application 2019 & 2032
- Table 108: Australia Fermented Foods and Beverages Industry Volume (K Units) Forecast, by Application 2019 & 2032
- Table 109: Japan Fermented Foods and Beverages Industry Revenue (Million) Forecast, by Application 2019 & 2032
- Table 110: Japan Fermented Foods and Beverages Industry Volume (K Units) Forecast, by Application 2019 & 2032
- Table 111: Rest of Asia Pacific Fermented Foods and Beverages Industry Revenue (Million) Forecast, by Application 2019 & 2032
- Table 112: Rest of Asia Pacific Fermented Foods and Beverages Industry Volume (K Units) Forecast, by Application 2019 & 2032
- Table 113: Global Fermented Foods and Beverages Industry Revenue Million Forecast, by Type 2019 & 2032
- Table 114: Global Fermented Foods and Beverages Industry Volume K Units Forecast, by Type 2019 & 2032
- Table 115: Global Fermented Foods and Beverages Industry Revenue Million Forecast, by Distribution Channel 2019 & 2032
- Table 116: Global Fermented Foods and Beverages Industry Volume K Units Forecast, by Distribution Channel 2019 & 2032
- Table 117: Global Fermented Foods and Beverages Industry Revenue Million Forecast, by Country 2019 & 2032
- Table 118: Global Fermented Foods and Beverages Industry Volume K Units Forecast, by Country 2019 & 2032
- Table 119: Brazil Fermented Foods and Beverages Industry Revenue (Million) Forecast, by Application 2019 & 2032
- Table 120: Brazil Fermented Foods and Beverages Industry Volume (K Units) Forecast, by Application 2019 & 2032
- Table 121: Argentina Fermented Foods and Beverages Industry Revenue (Million) Forecast, by Application 2019 & 2032
- Table 122: Argentina Fermented Foods and Beverages Industry Volume (K Units) Forecast, by Application 2019 & 2032
- Table 123: Rest of South America Fermented Foods and Beverages Industry Revenue (Million) Forecast, by Application 2019 & 2032
- Table 124: Rest of South America Fermented Foods and Beverages Industry Volume (K Units) Forecast, by Application 2019 & 2032
- Table 125: Global Fermented Foods and Beverages Industry Revenue Million Forecast, by Type 2019 & 2032
- Table 126: Global Fermented Foods and Beverages Industry Volume K Units Forecast, by Type 2019 & 2032
- Table 127: Global Fermented Foods and Beverages Industry Revenue Million Forecast, by Distribution Channel 2019 & 2032
- Table 128: Global Fermented Foods and Beverages Industry Volume K Units Forecast, by Distribution Channel 2019 & 2032
- Table 129: Global Fermented Foods and Beverages Industry Revenue Million Forecast, by Country 2019 & 2032
- Table 130: Global Fermented Foods and Beverages Industry Volume K Units Forecast, by Country 2019 & 2032
- Table 131: United Arab Emirates Fermented Foods and Beverages Industry Revenue (Million) Forecast, by Application 2019 & 2032
- Table 132: United Arab Emirates Fermented Foods and Beverages Industry Volume (K Units) Forecast, by Application 2019 & 2032
- Table 133: South Africa Fermented Foods and Beverages Industry Revenue (Million) Forecast, by Application 2019 & 2032
- Table 134: South Africa Fermented Foods and Beverages Industry Volume (K Units) Forecast, by Application 2019 & 2032
- Table 135: Rest of Middle East and Africa Fermented Foods and Beverages Industry Revenue (Million) Forecast, by Application 2019 & 2032
- Table 136: Rest of Middle East and Africa Fermented Foods and Beverages Industry Volume (K Units) Forecast, by Application 2019 & 2032
Frequently Asked Questions
1. What is the projected Compound Annual Growth Rate (CAGR) of the Fermented Foods and Beverages Industry?
The projected CAGR is approximately 6.70%.
2. Which companies are prominent players in the Fermented Foods and Beverages Industry?
Key companies in the market include PepsiCo Inc, Yakult Honsha Co Ltd, Lactalis Group, Chobani Inc *List Not Exhaustive, Heineken N V, Constellation Brands Inc, BioGaia, The Boston Beer Company, Danone S A, Anheuser-Busch InBev SA/NV, Fonterra Co-operative Group Limited, Nestlé S A.
3. What are the main segments of the Fermented Foods and Beverages Industry?
The market segments include Type, Distribution Channel.
4. Can you provide details about the market size?
The market size is estimated to be USD XX Million as of 2022.
5. What are some drivers contributing to market growth?
Increasing Inclination Towards Health-based Food Products; Increasing Vegan Food Consumption.
6. What are the notable trends driving market growth?
Rising Awareness About the Health Benefits of Fermented Food and Beverages.
7. Are there any restraints impacting market growth?
The Risk of Contamination of Food is High.
8. Can you provide examples of recent developments in the market?
September 2022: Garden of Life, a Nestle brand, launched two new probiotics for kids' growth and immune health in China. Both products come in the form of solid beverages. The products contain a higher number of live bacteria, probiotics, and vitamin C.
9. What pricing options are available for accessing the report?
Pricing options include single-user, multi-user, and enterprise licenses priced at USD 4750, USD 5250, and USD 8750 respectively.
10. Is the market size provided in terms of value or volume?
The market size is provided in terms of value, measured in Million and volume, measured in K Units.
11. Are there any specific market keywords associated with the report?
Yes, the market keyword associated with the report is "Fermented Foods and Beverages Industry," which aids in identifying and referencing the specific market segment covered.
12. How do I determine which pricing option suits my needs best?
The pricing options vary based on user requirements and access needs. Individual users may opt for single-user licenses, while businesses requiring broader access may choose multi-user or enterprise licenses for cost-effective access to the report.
13. Are there any additional resources or data provided in the Fermented Foods and Beverages Industry report?
While the report offers comprehensive insights, it's advisable to review the specific contents or supplementary materials provided to ascertain if additional resources or data are available.
14. How can I stay updated on further developments or reports in the Fermented Foods and Beverages Industry?
To stay informed about further developments, trends, and reports in the Fermented Foods and Beverages Industry, consider subscribing to industry newsletters, following relevant companies and organizations, or regularly checking reputable industry news sources and publications.
Methodology
Step 1 - Identification of Relevant Samples Size from Population Database


Step 2 - Approaches for Defining Global Market Size (Value, Volume* & Price*)

Note*: In applicable scenarios
Step 3 - Data Sources
Primary Research
- Web Analytics
- Survey Reports
- Research Institute
- Latest Research Reports
- Opinion Leaders
Secondary Research
- Annual Reports
- White Paper
- Latest Press Release
- Industry Association
- Paid Database
- Investor Presentations

Step 4 - Data Triangulation
Involves using different sources of information in order to increase the validity of a study
These sources are likely to be stakeholders in a program - participants, other researchers, program staff, other community members, and so on.
Then we put all data in single framework & apply various statistical tools to find out the dynamic on the market.
During the analysis stage, feedback from the stakeholder groups would be compared to determine areas of agreement as well as areas of divergence
