

Key Insights
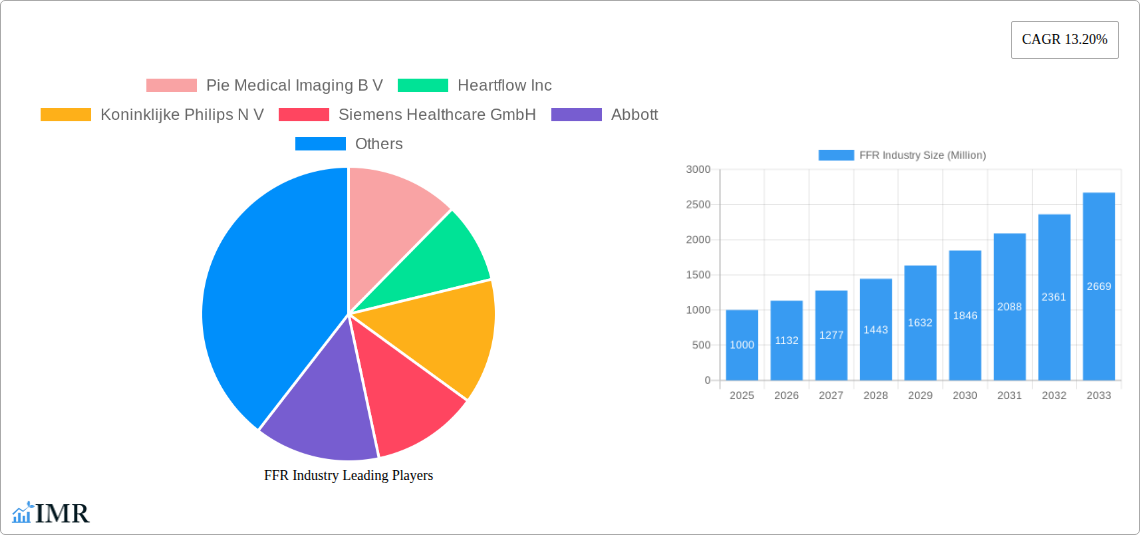
The Fractional Flow Reserve (FFR) market, valued at approximately $XX million in 2025, is experiencing robust growth, projected to expand at a Compound Annual Growth Rate (CAGR) of 13.20% from 2025 to 2033. This significant growth is fueled by several key drivers. Firstly, the increasing prevalence of coronary artery disease (CAD) globally necessitates more accurate and less invasive diagnostic procedures, leading to higher demand for FFR technology. Secondly, advancements in FFR technology, such as the development of more precise and less invasive techniques, are contributing significantly to market expansion. The shift towards minimally invasive procedures, coupled with improved image quality and faster procedure times, is attracting a larger patient base. Furthermore, the rising adoption of FFR in guiding percutaneous coronary intervention (PCI) decisions is a critical growth catalyst. This enables physicians to make more informed decisions, leading to better patient outcomes and reduced healthcare costs in the long run. Finally, increasing healthcare expenditure and technological advancements in related fields like imaging and interventional cardiology are supporting the market's expansion.
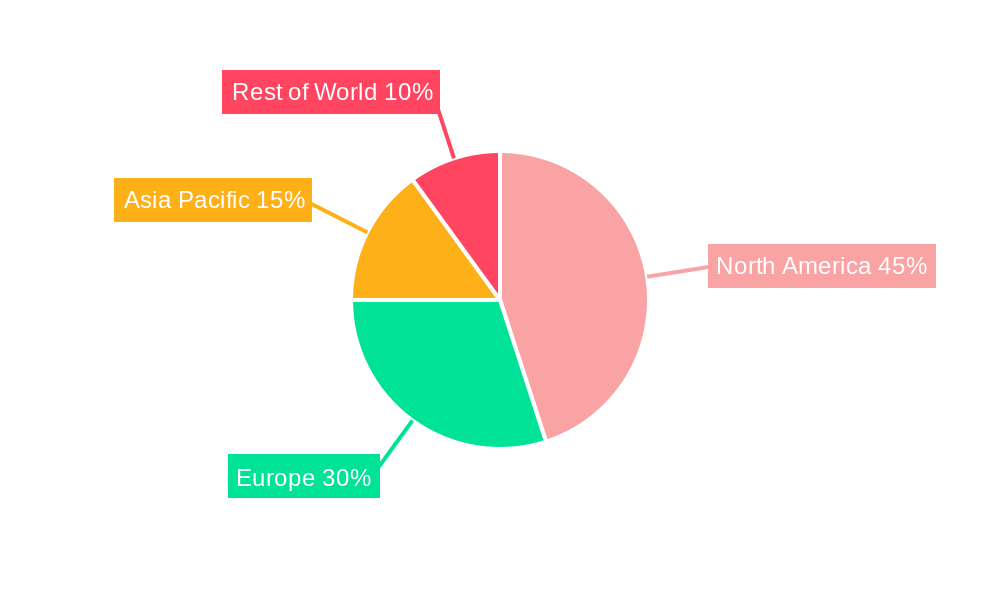
However, certain restraints are impacting market growth. The relatively high cost of FFR systems, along with the need for specialized training and expertise to operate them, can limit adoption in resource-constrained settings. Additionally, the emergence of alternative diagnostic methods, such as computed tomography angiography (CTA), presents some competitive pressure. Nevertheless, the benefits of FFR in improving patient outcomes and reducing complications are expected to outweigh these limitations, fostering market growth over the forecast period. The market segmentation reveals significant opportunities within both invasive and non-invasive FFR technologies, with the invasive segment currently dominating but the non-invasive segment poised for substantial growth driven by technological innovations and reduced procedural complexity. Key players such as Pie Medical Imaging B.V., HeartFlow Inc., Philips, Siemens Healthineers, Abbott, GE Healthcare, Boston Scientific, Medis Medical Imaging Systems B.V., Cathworks, and OpSens Medical are actively shaping the market landscape through technological innovation and strategic partnerships. Geographic analysis shows North America currently holds the largest market share, followed by Europe and Asia Pacific, reflecting higher healthcare spending and technological advancements in these regions.
Fractional Flow Reserve (FFR) Industry Market Report: 2019-2033
This comprehensive report provides a detailed analysis of the FFR industry, encompassing market dynamics, growth trends, key players, and future outlook. The study period covers 2019-2033, with a base year of 2025 and a forecast period of 2025-2033. This in-depth analysis is crucial for investors, industry professionals, and stakeholders seeking to understand and capitalize on the opportunities within the rapidly evolving FFR market, including the parent market of Cardiovascular Devices and the child market of Interventional Cardiology. The report utilizes data in Million units.
FFR Industry Market Dynamics & Structure
The FFR market is characterized by moderate concentration, with key players like Koninklijke Philips N V, Siemens Healthcare GmbH, and Abbott holding significant market share (xx%). Technological innovation, particularly in non-invasive FFR techniques, is a primary growth driver. Stringent regulatory frameworks, especially concerning medical device approvals, influence market entry and product adoption. Competitive substitutes, such as pressure wire-based methods, exert pressure on pricing and market penetration. The end-user demographic primarily comprises cardiology departments in hospitals and specialized cardiac centers. Significant M&A activity, exemplified by Medtronic's investment in CathWorks (USD 75 million in 2022), reflects the industry's consolidation trend.
- Market Concentration: Moderately concentrated, with top 5 players holding xx% market share in 2025.
- Technological Innovation: Driven by advancements in non-invasive FFR and image processing.
- Regulatory Landscape: Stringent regulatory approvals influence market access.
- Competitive Substitutes: Pressure wire methods pose competitive challenges.
- End-User Demographics: Primarily hospitals and specialized cardiac centers.
- M&A Activity: Significant activity, with xx deals recorded between 2019 and 2024.
FFR Industry Growth Trends & Insights
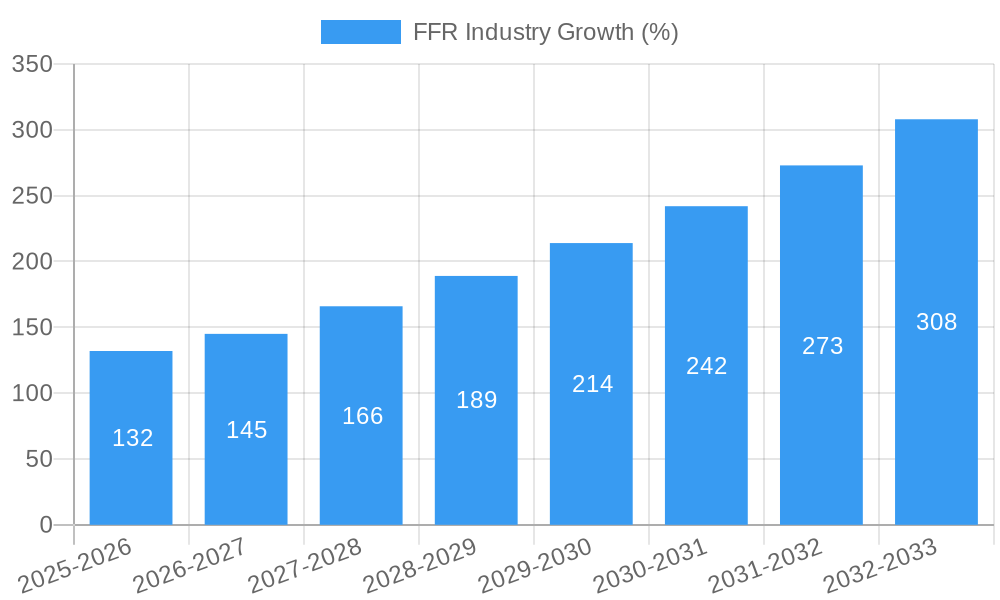
The FFR market witnessed robust growth during the historical period (2019-2024), expanding at a CAGR of xx%. This growth is attributed to increasing prevalence of coronary artery disease, rising adoption of minimally invasive procedures, and technological advancements leading to improved diagnostic accuracy. The market is projected to continue its expansion during the forecast period (2025-2033), with a forecasted CAGR of xx%, driven by factors such as growing awareness of FFR technology amongst clinicians, increasing demand for accurate and efficient diagnostics, and the continued development of innovative FFR solutions. Market penetration is expected to increase from xx% in 2025 to xx% by 2033. Technological disruptions, such as the introduction of non-invasive FFR methods, are accelerating adoption rates and expanding market reach. Consumer behavior is shifting towards a preference for less invasive and more accurate diagnostic techniques.
Dominant Regions, Countries, or Segments in FFR Industry
North America currently dominates the FFR market, driven by high healthcare expenditure, advanced medical infrastructure, and early adoption of new technologies. Europe and Asia-Pacific are also experiencing significant growth, fueled by increasing awareness of cardiovascular diseases and rising healthcare investments. Within product types, the FFR system segment holds the largest market share (xx% in 2025), followed by guidewires. Invasive FFR technology accounts for the majority of the market, although non-invasive methods are gaining traction, promising substantial growth in the coming years.
- Key Drivers (North America):
- High healthcare expenditure
- Advanced medical infrastructure
- Early adoption of new technologies
- Key Drivers (Europe & Asia-Pacific):
- Increasing awareness of cardiovascular diseases
- Rising healthcare investments
- Dominant Product Type: FFR System (xx% market share in 2025)
- Dominant Technology: Invasive FFR (xx% market share in 2025)
FFR Industry Product Landscape
The FFR market offers a range of products, including invasive and non-invasive FFR systems, along with specialized guidewires. Recent innovations focus on improving image quality, reducing procedural time, and enhancing overall accuracy. Non-invasive FFR technologies are gaining prominence due to their reduced invasiveness and potential cost-effectiveness. Key selling propositions include improved diagnostic accuracy, reduced procedural complications, and enhanced patient outcomes. Technological advancements include AI-powered image analysis and improved sensor technology for enhanced data capture and analysis.
Key Drivers, Barriers & Challenges in FFR Industry
Key Drivers:
- Increasing prevalence of coronary artery disease.
- Technological advancements leading to improved accuracy and efficiency.
- Rising demand for minimally invasive procedures.
- Government initiatives promoting early detection and treatment of cardiovascular diseases.
Challenges:
- High initial investment costs for FFR systems.
- Stringent regulatory requirements and approval processes for new devices.
- Competition from alternative diagnostic methods.
- Limited reimbursement coverage in certain regions, impacting market accessibility (estimated xx million units affected in 2025).
Emerging Opportunities in FFR Industry
- Expansion into emerging markets with growing healthcare infrastructure.
- Development of more cost-effective and portable FFR devices.
- Integration of FFR with other imaging modalities for comprehensive cardiac assessment.
- Exploration of novel applications of FFR technology in other cardiac conditions.
Growth Accelerators in the FFR Industry
Technological advancements, particularly in non-invasive FFR and AI-driven image analysis, are major growth catalysts. Strategic partnerships, such as the Medtronic-CathWorks collaboration, accelerate market penetration and broaden product reach. Expanding into untapped markets and addressing unmet clinical needs will further drive market growth.
Key Players Shaping the FFR Industry Market
- Pie Medical Imaging B V
- Heartflow Inc
- Koninklijke Philips N V
- Siemens Healthcare GmbH
- Abbott
- General Electric Company (GE Healthcare)
- Boston Scientific Corporation
- Medis Medical Imaging Systems B V
- Cathworks
- OpSens Medical
Notable Milestones in FFR Industry Sector
- July 2022: Medtronic's USD 75 million investment in and co-promotion of CathWorks' FFRangio System expands market reach.
- February 2022: Siemens Healthineers launches Artis Icono Biplane with integrated vFFR, enhancing workflow and efficiency.
In-Depth FFR Industry Market Outlook
The FFR market is poised for continued growth, driven by technological advancements, strategic partnerships, and expanding applications. The focus on non-invasive techniques, AI-powered diagnostics, and improved data integration promises to expand market accessibility and enhance patient outcomes. Strategic investments in research and development, coupled with effective market expansion strategies, will further propel the market's trajectory, creating substantial opportunities for key players.
FFR Industry Segmentation
-
1. Product Type
- 1.1. FFR System
- 1.2. Guidewire
-
2. Technology
- 2.1. Invasive
- 2.2. Non-invasive
FFR Industry Segmentation By Geography
-
1. North America
- 1.1. United States
- 1.2. Canada
- 1.3. Mexico
-
2. Europe
- 2.1. Germany
- 2.2. United Kingdom
- 2.3. France
- 2.4. Italy
- 2.5. Spain
- 2.6. Rest of Europe
-
3. Asia Pacific
- 3.1. China
- 3.2. Japan
- 3.3. India
- 3.4. Australia
- 3.5. South Korea
- 3.6. Rest of Asia Pacific
-
4. Middle East and Africa
- 4.1. GCC
- 4.2. South Africa
- 4.3. Rest of Middle East and Africa
-
5. South America
- 5.1. Brazil
- 5.2. Argentina
- 5.3. Rest of South America
FFR Industry REPORT HIGHLIGHTS
| Aspects | Details |
|---|---|
| Study Period | 2019-2033 |
| Base Year | 2024 |
| Estimated Year | 2025 |
| Forecast Period | 2025-2033 |
| Historical Period | 2019-2024 |
| Growth Rate | CAGR of 13.20% from 2019-2033 |
| Segmentation |
|
Table of Contents
- 1. Introduction
- 1.1. Research Scope
- 1.2. Market Segmentation
- 1.3. Research Methodology
- 1.4. Definitions and Assumptions
- 2. Executive Summary
- 2.1. Introduction
- 3. Market Dynamics
- 3.1. Introduction
- 3.2. Market Drivers
- 3.2.1. Growing Burden of Cardiovascular Diseases; Advancements in Products
- 3.3. Market Restrains
- 3.3.1. Stringent Regulatory Framework
- 3.4. Market Trends
- 3.4.1. Guidewires Segment is Expected to Hold a Major Market Share in the Fractional Flow Reserve Market
- 4. Market Factor Analysis
- 4.1. Porters Five Forces
- 4.2. Supply/Value Chain
- 4.3. PESTEL analysis
- 4.4. Market Entropy
- 4.5. Patent/Trademark Analysis
- 5. Global FFR Industry Analysis, Insights and Forecast, 2019-2031
- 5.1. Market Analysis, Insights and Forecast - by Product Type
- 5.1.1. FFR System
- 5.1.2. Guidewire
- 5.2. Market Analysis, Insights and Forecast - by Technology
- 5.2.1. Invasive
- 5.2.2. Non-invasive
- 5.3. Market Analysis, Insights and Forecast - by Region
- 5.3.1. North America
- 5.3.2. Europe
- 5.3.3. Asia Pacific
- 5.3.4. Middle East and Africa
- 5.3.5. South America
- 5.1. Market Analysis, Insights and Forecast - by Product Type
- 6. North America FFR Industry Analysis, Insights and Forecast, 2019-2031
- 6.1. Market Analysis, Insights and Forecast - by Product Type
- 6.1.1. FFR System
- 6.1.2. Guidewire
- 6.2. Market Analysis, Insights and Forecast - by Technology
- 6.2.1. Invasive
- 6.2.2. Non-invasive
- 6.1. Market Analysis, Insights and Forecast - by Product Type
- 7. Europe FFR Industry Analysis, Insights and Forecast, 2019-2031
- 7.1. Market Analysis, Insights and Forecast - by Product Type
- 7.1.1. FFR System
- 7.1.2. Guidewire
- 7.2. Market Analysis, Insights and Forecast - by Technology
- 7.2.1. Invasive
- 7.2.2. Non-invasive
- 7.1. Market Analysis, Insights and Forecast - by Product Type
- 8. Asia Pacific FFR Industry Analysis, Insights and Forecast, 2019-2031
- 8.1. Market Analysis, Insights and Forecast - by Product Type
- 8.1.1. FFR System
- 8.1.2. Guidewire
- 8.2. Market Analysis, Insights and Forecast - by Technology
- 8.2.1. Invasive
- 8.2.2. Non-invasive
- 8.1. Market Analysis, Insights and Forecast - by Product Type
- 9. Middle East and Africa FFR Industry Analysis, Insights and Forecast, 2019-2031
- 9.1. Market Analysis, Insights and Forecast - by Product Type
- 9.1.1. FFR System
- 9.1.2. Guidewire
- 9.2. Market Analysis, Insights and Forecast - by Technology
- 9.2.1. Invasive
- 9.2.2. Non-invasive
- 9.1. Market Analysis, Insights and Forecast - by Product Type
- 10. South America FFR Industry Analysis, Insights and Forecast, 2019-2031
- 10.1. Market Analysis, Insights and Forecast - by Product Type
- 10.1.1. FFR System
- 10.1.2. Guidewire
- 10.2. Market Analysis, Insights and Forecast - by Technology
- 10.2.1. Invasive
- 10.2.2. Non-invasive
- 10.1. Market Analysis, Insights and Forecast - by Product Type
- 11. North Americ FFR Industry Analysis, Insights and Forecast, 2019-2031
- 11.1. Market Analysis, Insights and Forecast - By Country/Sub-region
- 11.1.1 United States
- 11.1.2 Canada
- 11.1.3 Mexico
- 12. South America FFR Industry Analysis, Insights and Forecast, 2019-2031
- 12.1. Market Analysis, Insights and Forecast - By Country/Sub-region
- 12.1.1 Brazil
- 12.1.2 Mexico
- 12.1.3 Rest of South America
- 13. Europe FFR Industry Analysis, Insights and Forecast, 2019-2031
- 13.1. Market Analysis, Insights and Forecast - By Country/Sub-region
- 13.1.1 Germany
- 13.1.2 United Kingdom
- 13.1.3 France
- 13.1.4 Italy
- 13.1.5 Spain
- 13.1.6 Rest of Europe
- 14. Asia Pacific FFR Industry Analysis, Insights and Forecast, 2019-2031
- 14.1. Market Analysis, Insights and Forecast - By Country/Sub-region
- 14.1.1 China
- 14.1.2 Japan
- 14.1.3 India
- 14.1.4 South Korea
- 14.1.5 Taiwan
- 14.1.6 Australia
- 14.1.7 Rest of Asia-Pacific
- 15. MEA FFR Industry Analysis, Insights and Forecast, 2019-2031
- 15.1. Market Analysis, Insights and Forecast - By Country/Sub-region
- 15.1.1 Middle East
- 15.1.2 Africa
- 16. Competitive Analysis
- 16.1. Global Market Share Analysis 2024
- 16.2. Company Profiles
- 16.2.1 Pie Medical Imaging B V
- 16.2.1.1. Overview
- 16.2.1.2. Products
- 16.2.1.3. SWOT Analysis
- 16.2.1.4. Recent Developments
- 16.2.1.5. Financials (Based on Availability)
- 16.2.2 Heartflow Inc
- 16.2.2.1. Overview
- 16.2.2.2. Products
- 16.2.2.3. SWOT Analysis
- 16.2.2.4. Recent Developments
- 16.2.2.5. Financials (Based on Availability)
- 16.2.3 Koninklijke Philips N V
- 16.2.3.1. Overview
- 16.2.3.2. Products
- 16.2.3.3. SWOT Analysis
- 16.2.3.4. Recent Developments
- 16.2.3.5. Financials (Based on Availability)
- 16.2.4 Siemens Healthcare GmbH
- 16.2.4.1. Overview
- 16.2.4.2. Products
- 16.2.4.3. SWOT Analysis
- 16.2.4.4. Recent Developments
- 16.2.4.5. Financials (Based on Availability)
- 16.2.5 Abbott
- 16.2.5.1. Overview
- 16.2.5.2. Products
- 16.2.5.3. SWOT Analysis
- 16.2.5.4. Recent Developments
- 16.2.5.5. Financials (Based on Availability)
- 16.2.6 General Electric Company (GE Healthcare)
- 16.2.6.1. Overview
- 16.2.6.2. Products
- 16.2.6.3. SWOT Analysis
- 16.2.6.4. Recent Developments
- 16.2.6.5. Financials (Based on Availability)
- 16.2.7 Boston Scientific Corporation
- 16.2.7.1. Overview
- 16.2.7.2. Products
- 16.2.7.3. SWOT Analysis
- 16.2.7.4. Recent Developments
- 16.2.7.5. Financials (Based on Availability)
- 16.2.8 Medis Medical Imaging Systems B V
- 16.2.8.1. Overview
- 16.2.8.2. Products
- 16.2.8.3. SWOT Analysis
- 16.2.8.4. Recent Developments
- 16.2.8.5. Financials (Based on Availability)
- 16.2.9 Cathworks
- 16.2.9.1. Overview
- 16.2.9.2. Products
- 16.2.9.3. SWOT Analysis
- 16.2.9.4. Recent Developments
- 16.2.9.5. Financials (Based on Availability)
- 16.2.10 OpSens Medical
- 16.2.10.1. Overview
- 16.2.10.2. Products
- 16.2.10.3. SWOT Analysis
- 16.2.10.4. Recent Developments
- 16.2.10.5. Financials (Based on Availability)
- 16.2.1 Pie Medical Imaging B V
List of Figures
- Figure 1: Global FFR Industry Revenue Breakdown (Million, %) by Region 2024 & 2032
- Figure 2: Global FFR Industry Volume Breakdown (K Unit, %) by Region 2024 & 2032
- Figure 3: North Americ FFR Industry Revenue (Million), by Country 2024 & 2032
- Figure 4: North Americ FFR Industry Volume (K Unit), by Country 2024 & 2032
- Figure 5: North Americ FFR Industry Revenue Share (%), by Country 2024 & 2032
- Figure 6: North Americ FFR Industry Volume Share (%), by Country 2024 & 2032
- Figure 7: South America FFR Industry Revenue (Million), by Country 2024 & 2032
- Figure 8: South America FFR Industry Volume (K Unit), by Country 2024 & 2032
- Figure 9: South America FFR Industry Revenue Share (%), by Country 2024 & 2032
- Figure 10: South America FFR Industry Volume Share (%), by Country 2024 & 2032
- Figure 11: Europe FFR Industry Revenue (Million), by Country 2024 & 2032
- Figure 12: Europe FFR Industry Volume (K Unit), by Country 2024 & 2032
- Figure 13: Europe FFR Industry Revenue Share (%), by Country 2024 & 2032
- Figure 14: Europe FFR Industry Volume Share (%), by Country 2024 & 2032
- Figure 15: Asia Pacific FFR Industry Revenue (Million), by Country 2024 & 2032
- Figure 16: Asia Pacific FFR Industry Volume (K Unit), by Country 2024 & 2032
- Figure 17: Asia Pacific FFR Industry Revenue Share (%), by Country 2024 & 2032
- Figure 18: Asia Pacific FFR Industry Volume Share (%), by Country 2024 & 2032
- Figure 19: MEA FFR Industry Revenue (Million), by Country 2024 & 2032
- Figure 20: MEA FFR Industry Volume (K Unit), by Country 2024 & 2032
- Figure 21: MEA FFR Industry Revenue Share (%), by Country 2024 & 2032
- Figure 22: MEA FFR Industry Volume Share (%), by Country 2024 & 2032
- Figure 23: North America FFR Industry Revenue (Million), by Product Type 2024 & 2032
- Figure 24: North America FFR Industry Volume (K Unit), by Product Type 2024 & 2032
- Figure 25: North America FFR Industry Revenue Share (%), by Product Type 2024 & 2032
- Figure 26: North America FFR Industry Volume Share (%), by Product Type 2024 & 2032
- Figure 27: North America FFR Industry Revenue (Million), by Technology 2024 & 2032
- Figure 28: North America FFR Industry Volume (K Unit), by Technology 2024 & 2032
- Figure 29: North America FFR Industry Revenue Share (%), by Technology 2024 & 2032
- Figure 30: North America FFR Industry Volume Share (%), by Technology 2024 & 2032
- Figure 31: North America FFR Industry Revenue (Million), by Country 2024 & 2032
- Figure 32: North America FFR Industry Volume (K Unit), by Country 2024 & 2032
- Figure 33: North America FFR Industry Revenue Share (%), by Country 2024 & 2032
- Figure 34: North America FFR Industry Volume Share (%), by Country 2024 & 2032
- Figure 35: Europe FFR Industry Revenue (Million), by Product Type 2024 & 2032
- Figure 36: Europe FFR Industry Volume (K Unit), by Product Type 2024 & 2032
- Figure 37: Europe FFR Industry Revenue Share (%), by Product Type 2024 & 2032
- Figure 38: Europe FFR Industry Volume Share (%), by Product Type 2024 & 2032
- Figure 39: Europe FFR Industry Revenue (Million), by Technology 2024 & 2032
- Figure 40: Europe FFR Industry Volume (K Unit), by Technology 2024 & 2032
- Figure 41: Europe FFR Industry Revenue Share (%), by Technology 2024 & 2032
- Figure 42: Europe FFR Industry Volume Share (%), by Technology 2024 & 2032
- Figure 43: Europe FFR Industry Revenue (Million), by Country 2024 & 2032
- Figure 44: Europe FFR Industry Volume (K Unit), by Country 2024 & 2032
- Figure 45: Europe FFR Industry Revenue Share (%), by Country 2024 & 2032
- Figure 46: Europe FFR Industry Volume Share (%), by Country 2024 & 2032
- Figure 47: Asia Pacific FFR Industry Revenue (Million), by Product Type 2024 & 2032
- Figure 48: Asia Pacific FFR Industry Volume (K Unit), by Product Type 2024 & 2032
- Figure 49: Asia Pacific FFR Industry Revenue Share (%), by Product Type 2024 & 2032
- Figure 50: Asia Pacific FFR Industry Volume Share (%), by Product Type 2024 & 2032
- Figure 51: Asia Pacific FFR Industry Revenue (Million), by Technology 2024 & 2032
- Figure 52: Asia Pacific FFR Industry Volume (K Unit), by Technology 2024 & 2032
- Figure 53: Asia Pacific FFR Industry Revenue Share (%), by Technology 2024 & 2032
- Figure 54: Asia Pacific FFR Industry Volume Share (%), by Technology 2024 & 2032
- Figure 55: Asia Pacific FFR Industry Revenue (Million), by Country 2024 & 2032
- Figure 56: Asia Pacific FFR Industry Volume (K Unit), by Country 2024 & 2032
- Figure 57: Asia Pacific FFR Industry Revenue Share (%), by Country 2024 & 2032
- Figure 58: Asia Pacific FFR Industry Volume Share (%), by Country 2024 & 2032
- Figure 59: Middle East and Africa FFR Industry Revenue (Million), by Product Type 2024 & 2032
- Figure 60: Middle East and Africa FFR Industry Volume (K Unit), by Product Type 2024 & 2032
- Figure 61: Middle East and Africa FFR Industry Revenue Share (%), by Product Type 2024 & 2032
- Figure 62: Middle East and Africa FFR Industry Volume Share (%), by Product Type 2024 & 2032
- Figure 63: Middle East and Africa FFR Industry Revenue (Million), by Technology 2024 & 2032
- Figure 64: Middle East and Africa FFR Industry Volume (K Unit), by Technology 2024 & 2032
- Figure 65: Middle East and Africa FFR Industry Revenue Share (%), by Technology 2024 & 2032
- Figure 66: Middle East and Africa FFR Industry Volume Share (%), by Technology 2024 & 2032
- Figure 67: Middle East and Africa FFR Industry Revenue (Million), by Country 2024 & 2032
- Figure 68: Middle East and Africa FFR Industry Volume (K Unit), by Country 2024 & 2032
- Figure 69: Middle East and Africa FFR Industry Revenue Share (%), by Country 2024 & 2032
- Figure 70: Middle East and Africa FFR Industry Volume Share (%), by Country 2024 & 2032
- Figure 71: South America FFR Industry Revenue (Million), by Product Type 2024 & 2032
- Figure 72: South America FFR Industry Volume (K Unit), by Product Type 2024 & 2032
- Figure 73: South America FFR Industry Revenue Share (%), by Product Type 2024 & 2032
- Figure 74: South America FFR Industry Volume Share (%), by Product Type 2024 & 2032
- Figure 75: South America FFR Industry Revenue (Million), by Technology 2024 & 2032
- Figure 76: South America FFR Industry Volume (K Unit), by Technology 2024 & 2032
- Figure 77: South America FFR Industry Revenue Share (%), by Technology 2024 & 2032
- Figure 78: South America FFR Industry Volume Share (%), by Technology 2024 & 2032
- Figure 79: South America FFR Industry Revenue (Million), by Country 2024 & 2032
- Figure 80: South America FFR Industry Volume (K Unit), by Country 2024 & 2032
- Figure 81: South America FFR Industry Revenue Share (%), by Country 2024 & 2032
- Figure 82: South America FFR Industry Volume Share (%), by Country 2024 & 2032
List of Tables
- Table 1: Global FFR Industry Revenue Million Forecast, by Region 2019 & 2032
- Table 2: Global FFR Industry Volume K Unit Forecast, by Region 2019 & 2032
- Table 3: Global FFR Industry Revenue Million Forecast, by Product Type 2019 & 2032
- Table 4: Global FFR Industry Volume K Unit Forecast, by Product Type 2019 & 2032
- Table 5: Global FFR Industry Revenue Million Forecast, by Technology 2019 & 2032
- Table 6: Global FFR Industry Volume K Unit Forecast, by Technology 2019 & 2032
- Table 7: Global FFR Industry Revenue Million Forecast, by Region 2019 & 2032
- Table 8: Global FFR Industry Volume K Unit Forecast, by Region 2019 & 2032
- Table 9: Global FFR Industry Revenue Million Forecast, by Country 2019 & 2032
- Table 10: Global FFR Industry Volume K Unit Forecast, by Country 2019 & 2032
- Table 11: United States FFR Industry Revenue (Million) Forecast, by Application 2019 & 2032
- Table 12: United States FFR Industry Volume (K Unit) Forecast, by Application 2019 & 2032
- Table 13: Canada FFR Industry Revenue (Million) Forecast, by Application 2019 & 2032
- Table 14: Canada FFR Industry Volume (K Unit) Forecast, by Application 2019 & 2032
- Table 15: Mexico FFR Industry Revenue (Million) Forecast, by Application 2019 & 2032
- Table 16: Mexico FFR Industry Volume (K Unit) Forecast, by Application 2019 & 2032
- Table 17: Global FFR Industry Revenue Million Forecast, by Country 2019 & 2032
- Table 18: Global FFR Industry Volume K Unit Forecast, by Country 2019 & 2032
- Table 19: Brazil FFR Industry Revenue (Million) Forecast, by Application 2019 & 2032
- Table 20: Brazil FFR Industry Volume (K Unit) Forecast, by Application 2019 & 2032
- Table 21: Mexico FFR Industry Revenue (Million) Forecast, by Application 2019 & 2032
- Table 22: Mexico FFR Industry Volume (K Unit) Forecast, by Application 2019 & 2032
- Table 23: Rest of South America FFR Industry Revenue (Million) Forecast, by Application 2019 & 2032
- Table 24: Rest of South America FFR Industry Volume (K Unit) Forecast, by Application 2019 & 2032
- Table 25: Global FFR Industry Revenue Million Forecast, by Country 2019 & 2032
- Table 26: Global FFR Industry Volume K Unit Forecast, by Country 2019 & 2032
- Table 27: Germany FFR Industry Revenue (Million) Forecast, by Application 2019 & 2032
- Table 28: Germany FFR Industry Volume (K Unit) Forecast, by Application 2019 & 2032
- Table 29: United Kingdom FFR Industry Revenue (Million) Forecast, by Application 2019 & 2032
- Table 30: United Kingdom FFR Industry Volume (K Unit) Forecast, by Application 2019 & 2032
- Table 31: France FFR Industry Revenue (Million) Forecast, by Application 2019 & 2032
- Table 32: France FFR Industry Volume (K Unit) Forecast, by Application 2019 & 2032
- Table 33: Italy FFR Industry Revenue (Million) Forecast, by Application 2019 & 2032
- Table 34: Italy FFR Industry Volume (K Unit) Forecast, by Application 2019 & 2032
- Table 35: Spain FFR Industry Revenue (Million) Forecast, by Application 2019 & 2032
- Table 36: Spain FFR Industry Volume (K Unit) Forecast, by Application 2019 & 2032
- Table 37: Rest of Europe FFR Industry Revenue (Million) Forecast, by Application 2019 & 2032
- Table 38: Rest of Europe FFR Industry Volume (K Unit) Forecast, by Application 2019 & 2032
- Table 39: Global FFR Industry Revenue Million Forecast, by Country 2019 & 2032
- Table 40: Global FFR Industry Volume K Unit Forecast, by Country 2019 & 2032
- Table 41: China FFR Industry Revenue (Million) Forecast, by Application 2019 & 2032
- Table 42: China FFR Industry Volume (K Unit) Forecast, by Application 2019 & 2032
- Table 43: Japan FFR Industry Revenue (Million) Forecast, by Application 2019 & 2032
- Table 44: Japan FFR Industry Volume (K Unit) Forecast, by Application 2019 & 2032
- Table 45: India FFR Industry Revenue (Million) Forecast, by Application 2019 & 2032
- Table 46: India FFR Industry Volume (K Unit) Forecast, by Application 2019 & 2032
- Table 47: South Korea FFR Industry Revenue (Million) Forecast, by Application 2019 & 2032
- Table 48: South Korea FFR Industry Volume (K Unit) Forecast, by Application 2019 & 2032
- Table 49: Taiwan FFR Industry Revenue (Million) Forecast, by Application 2019 & 2032
- Table 50: Taiwan FFR Industry Volume (K Unit) Forecast, by Application 2019 & 2032
- Table 51: Australia FFR Industry Revenue (Million) Forecast, by Application 2019 & 2032
- Table 52: Australia FFR Industry Volume (K Unit) Forecast, by Application 2019 & 2032
- Table 53: Rest of Asia-Pacific FFR Industry Revenue (Million) Forecast, by Application 2019 & 2032
- Table 54: Rest of Asia-Pacific FFR Industry Volume (K Unit) Forecast, by Application 2019 & 2032
- Table 55: Global FFR Industry Revenue Million Forecast, by Country 2019 & 2032
- Table 56: Global FFR Industry Volume K Unit Forecast, by Country 2019 & 2032
- Table 57: Middle East FFR Industry Revenue (Million) Forecast, by Application 2019 & 2032
- Table 58: Middle East FFR Industry Volume (K Unit) Forecast, by Application 2019 & 2032
- Table 59: Africa FFR Industry Revenue (Million) Forecast, by Application 2019 & 2032
- Table 60: Africa FFR Industry Volume (K Unit) Forecast, by Application 2019 & 2032
- Table 61: Global FFR Industry Revenue Million Forecast, by Product Type 2019 & 2032
- Table 62: Global FFR Industry Volume K Unit Forecast, by Product Type 2019 & 2032
- Table 63: Global FFR Industry Revenue Million Forecast, by Technology 2019 & 2032
- Table 64: Global FFR Industry Volume K Unit Forecast, by Technology 2019 & 2032
- Table 65: Global FFR Industry Revenue Million Forecast, by Country 2019 & 2032
- Table 66: Global FFR Industry Volume K Unit Forecast, by Country 2019 & 2032
- Table 67: United States FFR Industry Revenue (Million) Forecast, by Application 2019 & 2032
- Table 68: United States FFR Industry Volume (K Unit) Forecast, by Application 2019 & 2032
- Table 69: Canada FFR Industry Revenue (Million) Forecast, by Application 2019 & 2032
- Table 70: Canada FFR Industry Volume (K Unit) Forecast, by Application 2019 & 2032
- Table 71: Mexico FFR Industry Revenue (Million) Forecast, by Application 2019 & 2032
- Table 72: Mexico FFR Industry Volume (K Unit) Forecast, by Application 2019 & 2032
- Table 73: Global FFR Industry Revenue Million Forecast, by Product Type 2019 & 2032
- Table 74: Global FFR Industry Volume K Unit Forecast, by Product Type 2019 & 2032
- Table 75: Global FFR Industry Revenue Million Forecast, by Technology 2019 & 2032
- Table 76: Global FFR Industry Volume K Unit Forecast, by Technology 2019 & 2032
- Table 77: Global FFR Industry Revenue Million Forecast, by Country 2019 & 2032
- Table 78: Global FFR Industry Volume K Unit Forecast, by Country 2019 & 2032
- Table 79: Germany FFR Industry Revenue (Million) Forecast, by Application 2019 & 2032
- Table 80: Germany FFR Industry Volume (K Unit) Forecast, by Application 2019 & 2032
- Table 81: United Kingdom FFR Industry Revenue (Million) Forecast, by Application 2019 & 2032
- Table 82: United Kingdom FFR Industry Volume (K Unit) Forecast, by Application 2019 & 2032
- Table 83: France FFR Industry Revenue (Million) Forecast, by Application 2019 & 2032
- Table 84: France FFR Industry Volume (K Unit) Forecast, by Application 2019 & 2032
- Table 85: Italy FFR Industry Revenue (Million) Forecast, by Application 2019 & 2032
- Table 86: Italy FFR Industry Volume (K Unit) Forecast, by Application 2019 & 2032
- Table 87: Spain FFR Industry Revenue (Million) Forecast, by Application 2019 & 2032
- Table 88: Spain FFR Industry Volume (K Unit) Forecast, by Application 2019 & 2032
- Table 89: Rest of Europe FFR Industry Revenue (Million) Forecast, by Application 2019 & 2032
- Table 90: Rest of Europe FFR Industry Volume (K Unit) Forecast, by Application 2019 & 2032
- Table 91: Global FFR Industry Revenue Million Forecast, by Product Type 2019 & 2032
- Table 92: Global FFR Industry Volume K Unit Forecast, by Product Type 2019 & 2032
- Table 93: Global FFR Industry Revenue Million Forecast, by Technology 2019 & 2032
- Table 94: Global FFR Industry Volume K Unit Forecast, by Technology 2019 & 2032
- Table 95: Global FFR Industry Revenue Million Forecast, by Country 2019 & 2032
- Table 96: Global FFR Industry Volume K Unit Forecast, by Country 2019 & 2032
- Table 97: China FFR Industry Revenue (Million) Forecast, by Application 2019 & 2032
- Table 98: China FFR Industry Volume (K Unit) Forecast, by Application 2019 & 2032
- Table 99: Japan FFR Industry Revenue (Million) Forecast, by Application 2019 & 2032
- Table 100: Japan FFR Industry Volume (K Unit) Forecast, by Application 2019 & 2032
- Table 101: India FFR Industry Revenue (Million) Forecast, by Application 2019 & 2032
- Table 102: India FFR Industry Volume (K Unit) Forecast, by Application 2019 & 2032
- Table 103: Australia FFR Industry Revenue (Million) Forecast, by Application 2019 & 2032
- Table 104: Australia FFR Industry Volume (K Unit) Forecast, by Application 2019 & 2032
- Table 105: South Korea FFR Industry Revenue (Million) Forecast, by Application 2019 & 2032
- Table 106: South Korea FFR Industry Volume (K Unit) Forecast, by Application 2019 & 2032
- Table 107: Rest of Asia Pacific FFR Industry Revenue (Million) Forecast, by Application 2019 & 2032
- Table 108: Rest of Asia Pacific FFR Industry Volume (K Unit) Forecast, by Application 2019 & 2032
- Table 109: Global FFR Industry Revenue Million Forecast, by Product Type 2019 & 2032
- Table 110: Global FFR Industry Volume K Unit Forecast, by Product Type 2019 & 2032
- Table 111: Global FFR Industry Revenue Million Forecast, by Technology 2019 & 2032
- Table 112: Global FFR Industry Volume K Unit Forecast, by Technology 2019 & 2032
- Table 113: Global FFR Industry Revenue Million Forecast, by Country 2019 & 2032
- Table 114: Global FFR Industry Volume K Unit Forecast, by Country 2019 & 2032
- Table 115: GCC FFR Industry Revenue (Million) Forecast, by Application 2019 & 2032
- Table 116: GCC FFR Industry Volume (K Unit) Forecast, by Application 2019 & 2032
- Table 117: South Africa FFR Industry Revenue (Million) Forecast, by Application 2019 & 2032
- Table 118: South Africa FFR Industry Volume (K Unit) Forecast, by Application 2019 & 2032
- Table 119: Rest of Middle East and Africa FFR Industry Revenue (Million) Forecast, by Application 2019 & 2032
- Table 120: Rest of Middle East and Africa FFR Industry Volume (K Unit) Forecast, by Application 2019 & 2032
- Table 121: Global FFR Industry Revenue Million Forecast, by Product Type 2019 & 2032
- Table 122: Global FFR Industry Volume K Unit Forecast, by Product Type 2019 & 2032
- Table 123: Global FFR Industry Revenue Million Forecast, by Technology 2019 & 2032
- Table 124: Global FFR Industry Volume K Unit Forecast, by Technology 2019 & 2032
- Table 125: Global FFR Industry Revenue Million Forecast, by Country 2019 & 2032
- Table 126: Global FFR Industry Volume K Unit Forecast, by Country 2019 & 2032
- Table 127: Brazil FFR Industry Revenue (Million) Forecast, by Application 2019 & 2032
- Table 128: Brazil FFR Industry Volume (K Unit) Forecast, by Application 2019 & 2032
- Table 129: Argentina FFR Industry Revenue (Million) Forecast, by Application 2019 & 2032
- Table 130: Argentina FFR Industry Volume (K Unit) Forecast, by Application 2019 & 2032
- Table 131: Rest of South America FFR Industry Revenue (Million) Forecast, by Application 2019 & 2032
- Table 132: Rest of South America FFR Industry Volume (K Unit) Forecast, by Application 2019 & 2032
Frequently Asked Questions
1. What is the projected Compound Annual Growth Rate (CAGR) of the FFR Industry?
The projected CAGR is approximately 13.20%.
2. Which companies are prominent players in the FFR Industry?
Key companies in the market include Pie Medical Imaging B V, Heartflow Inc, Koninklijke Philips N V, Siemens Healthcare GmbH, Abbott, General Electric Company (GE Healthcare), Boston Scientific Corporation, Medis Medical Imaging Systems B V, Cathworks, OpSens Medical.
3. What are the main segments of the FFR Industry?
The market segments include Product Type, Technology.
4. Can you provide details about the market size?
The market size is estimated to be USD XX Million as of 2022.
5. What are some drivers contributing to market growth?
Growing Burden of Cardiovascular Diseases; Advancements in Products.
6. What are the notable trends driving market growth?
Guidewires Segment is Expected to Hold a Major Market Share in the Fractional Flow Reserve Market.
7. Are there any restraints impacting market growth?
Stringent Regulatory Framework.
8. Can you provide examples of recent developments in the market?
July 2022: Medtronic entered into a strategic partnership agreement with CathWorks, a privately held company headquartered in Kefar Sava, Israel, which developed the FFRangio System. As part of the agreement, Medtronic invested up to USD 75 million and immediately began co-promotion of CathWorks' FFRangio System in the United States, Europe, and Japan.
9. What pricing options are available for accessing the report?
Pricing options include single-user, multi-user, and enterprise licenses priced at USD 4750, USD 5250, and USD 8750 respectively.
10. Is the market size provided in terms of value or volume?
The market size is provided in terms of value, measured in Million and volume, measured in K Unit.
11. Are there any specific market keywords associated with the report?
Yes, the market keyword associated with the report is "FFR Industry," which aids in identifying and referencing the specific market segment covered.
12. How do I determine which pricing option suits my needs best?
The pricing options vary based on user requirements and access needs. Individual users may opt for single-user licenses, while businesses requiring broader access may choose multi-user or enterprise licenses for cost-effective access to the report.
13. Are there any additional resources or data provided in the FFR Industry report?
While the report offers comprehensive insights, it's advisable to review the specific contents or supplementary materials provided to ascertain if additional resources or data are available.
14. How can I stay updated on further developments or reports in the FFR Industry?
To stay informed about further developments, trends, and reports in the FFR Industry, consider subscribing to industry newsletters, following relevant companies and organizations, or regularly checking reputable industry news sources and publications.
Methodology
Step 1 - Identification of Relevant Samples Size from Population Database


Step 2 - Approaches for Defining Global Market Size (Value, Volume* & Price*)

Note*: In applicable scenarios
Step 3 - Data Sources
Primary Research
- Web Analytics
- Survey Reports
- Research Institute
- Latest Research Reports
- Opinion Leaders
Secondary Research
- Annual Reports
- White Paper
- Latest Press Release
- Industry Association
- Paid Database
- Investor Presentations

Step 4 - Data Triangulation
Involves using different sources of information in order to increase the validity of a study
These sources are likely to be stakeholders in a program - participants, other researchers, program staff, other community members, and so on.
Then we put all data in single framework & apply various statistical tools to find out the dynamic on the market.
During the analysis stage, feedback from the stakeholder groups would be compared to determine areas of agreement as well as areas of divergence
