

Key Insights
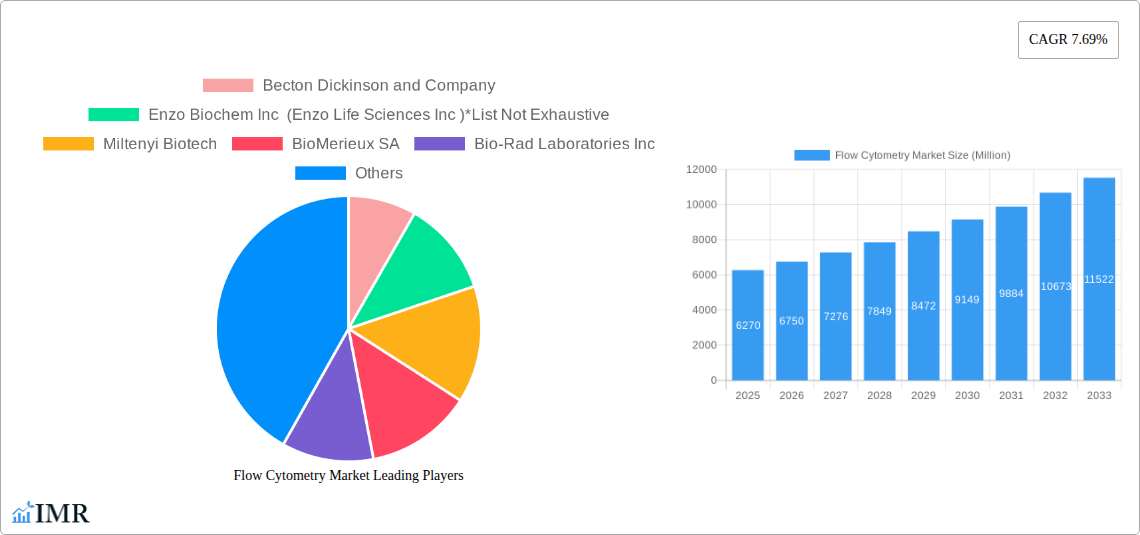
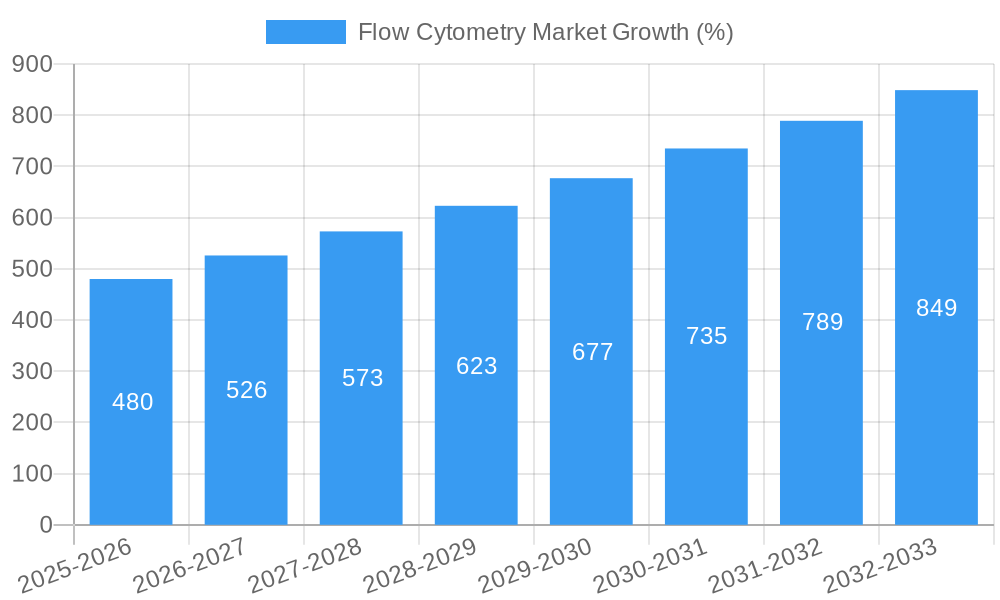
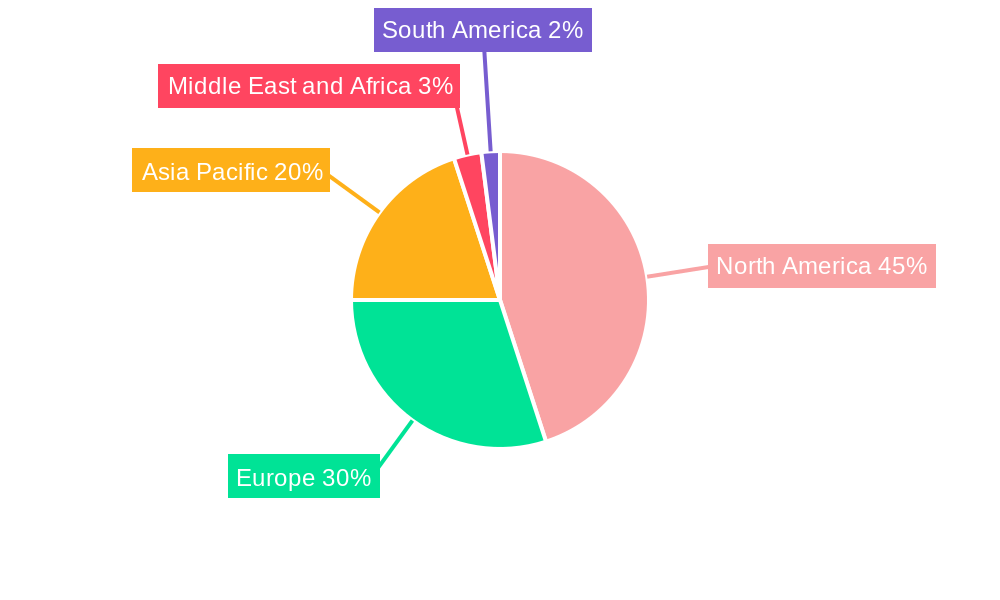
The global flow cytometry market, valued at $6.27 billion in 2025, is projected to experience robust growth, driven by a Compound Annual Growth Rate (CAGR) of 7.69% from 2025 to 2033. This expansion is fueled by several key factors. The increasing prevalence of chronic diseases like cancer necessitates advanced diagnostic tools, significantly boosting demand for flow cytometry in oncology research and clinical applications. Furthermore, the rising adoption of personalized medicine and targeted therapies relies heavily on flow cytometry's ability to analyze individual cells, thereby driving market growth. Technological advancements, such as the development of high-throughput systems and improved software for data analysis, are further enhancing the capabilities and efficiency of flow cytometry, making it increasingly attractive to researchers and clinicians. The market is segmented by end-user (hospitals, research institutes, pharmaceutical companies), product type (instruments, kits, software), technology (cell-based, bead-based), and application (oncology, drug discovery, immunology). The North American region currently holds a significant market share due to well-established healthcare infrastructure and substantial investment in research and development. However, emerging economies in Asia-Pacific are expected to witness rapid growth due to increasing healthcare spending and rising awareness of advanced diagnostic techniques. Competition in the market is intense, with major players including Becton Dickinson, Thermo Fisher Scientific, and Danaher Corporation continuously innovating and expanding their product portfolios to maintain market leadership.
The continued growth of the flow cytometry market is projected to be influenced by several factors. The rising demand for accurate and rapid diagnostic tools in infectious disease research is expected to fuel market expansion. Moreover, advancements in multiplexing capabilities, allowing simultaneous analysis of multiple cell markers, will further enhance the technology's utility. Regulatory approvals for novel flow cytometry-based assays and therapies will also play a significant role in shaping market trajectory. However, high initial investment costs associated with acquiring and maintaining flow cytometry equipment might pose a challenge for smaller laboratories and clinics in developing countries. Despite this, the overall market outlook remains positive, with continued innovation and increasing global adoption expected to propel significant growth in the coming years. The market’s future trajectory will be shaped by collaborations between technology providers and research institutions, leading to the development of more sophisticated and accessible flow cytometry systems.
Flow Cytometry Market: A Comprehensive Report (2019-2033)
This in-depth report provides a comprehensive analysis of the Flow Cytometry Market, encompassing market dynamics, growth trends, regional dominance, product landscape, key players, and future outlook. The study period covers 2019-2033, with 2025 as the base and estimated year, and a forecast period of 2025-2033. The report segments the market by end-user (Hospitals and Clinics, Academia and Research Institutes, Pharmaceutical and Biotechnology Companies, Other End-Users), product type (Instrument, Kit and Reagent, Software and Services), technology (Cell-based Flow Cytometry, Bead-based Flow Cytometry), and application (Oncology, Drug Discovery, Stem Cell Therapy, Organ Transplantation, Hematology, Other Applications). The total market value in 2025 is estimated at XX Million.
Flow Cytometry Market Dynamics & Structure
The Flow Cytometry market is characterized by moderate concentration, with key players holding significant market share. Technological innovation, particularly in software and cloud-based solutions, is a major driver. Stringent regulatory frameworks, especially concerning medical device approvals, influence market growth. Competitive pressures exist from substitute technologies and the emergence of novel analytical methods. The market witnesses consistent M&A activity, reflecting consolidation and expansion strategies.
- Market Concentration: Moderately concentrated, with top 5 players holding approximately xx% market share in 2025.
- Technological Innovation: Cloud-based data analysis, automation, and miniaturization are key innovation drivers.
- Regulatory Landscape: Stringent regulatory approvals for medical devices in key markets impact market entry and expansion.
- Competitive Landscape: Competition from alternative technologies like mass cytometry and microfluidics presents challenges.
- M&A Activity: A moderate number of M&A deals (xx in the last 5 years) indicate consolidation and expansion within the market.
- End-User Demographics: Research institutions and pharmaceutical companies are key drivers of instrument demand, while hospitals and clinics drive reagent and service demand.
Flow Cytometry Market Growth Trends & Insights
The Flow Cytometry market exhibits consistent growth, driven by increasing research activities, advancements in drug discovery and development, and the rising prevalence of diseases requiring advanced diagnostic tools. The market experienced a CAGR of xx% during the historical period (2019-2024), with a projected CAGR of xx% during the forecast period (2025-2033). Increased adoption of flow cytometry in various applications such as oncology, immunology, and stem cell research fuels market expansion. Technological advancements, such as high-throughput screening and automation, are further accelerating market growth. Consumer behavior shifts towards adopting advanced, cost-effective, and high-throughput technologies, coupled with rising healthcare spending, are boosting the market. Market penetration is high in developed regions but still has substantial untapped potential in emerging economies.
Dominant Regions, Countries, or Segments in Flow Cytometry Market
North America currently holds the largest market share, driven by robust research infrastructure, high healthcare expenditure, and early adoption of advanced technologies. Europe follows closely, with strong pharmaceutical and biotechnology sectors. The Asia-Pacific region exhibits significant growth potential, fueled by rising healthcare spending and increasing disease prevalence.
- By End-User: Pharmaceutical and Biotechnology companies drive the highest revenue, followed by Academia and Research Institutes.
- By Product Type: Instruments dominate the market share, followed by kits and reagents, with software and services demonstrating faster growth.
- By Technology: Cell-based flow cytometry holds the largest market share due to its established application and versatility.
- By Application: Oncology is the dominant application area, followed by immunology and hematology, driven by increasing disease prevalence and targeted therapies.
- Key Drivers: Increasing government funding for research, rising prevalence of chronic diseases, and technological advancements.
Flow Cytometry Market Product Landscape
The Flow Cytometry market showcases continuous product innovation, with manufacturers focusing on improving instrument performance, expanding software capabilities, and developing user-friendly kits and reagents. Recent advancements include higher throughput capabilities, improved sensitivity, and automation to streamline workflows. Unique selling propositions include advanced analytical software, improved data visualization, and simplified operational interfaces.
Key Drivers, Barriers & Challenges in Flow Cytometry Market
Key Drivers: Growing demand for advanced diagnostic and research tools, rising prevalence of chronic diseases, technological advancements leading to enhanced instrument sensitivity and throughput, and increased government funding for research initiatives.
Key Barriers & Challenges: High initial investment costs for instruments, complex operational procedures requiring specialized training, the emergence of competing technologies, and stringent regulatory requirements for medical devices. The impact of these challenges is estimated to slightly slow market growth by xx% annually.
Emerging Opportunities in Flow Cytometry Market
Emerging opportunities lie in the development of point-of-care testing devices, integration of flow cytometry with other technologies (e.g., AI and machine learning), and expansion into emerging markets with increasing healthcare infrastructure development. There is also potential for growth in new application areas, such as personalized medicine and environmental monitoring.
Growth Accelerators in the Flow Cytometry Market Industry
Strategic partnerships between instrument manufacturers and software developers, along with expanding applications of flow cytometry in personalized medicine and immunotherapy, accelerate market growth. Continuous technological breakthroughs, especially in high-throughput screening and automation, further enhance market expansion.
Key Players Shaping the Flow Cytometry Market Market
- Becton Dickinson and Company
- Enzo Biochem Inc (Enzo Life Sciences Inc)
- Miltenyi Biotech
- BioMerieux SA
- Bio-Rad Laboratories Inc
- Stratedigm Inc
- Sony Biotechnology Inc (Sony Corporation of America)
- Agilent Technologies Inc
- Sysmex Corporation
- Danaher corporation (Beckman Coulter Inc)
- Luminex Corporation
- ThermoFisher Scientific Inc
Notable Milestones in Flow Cytometry Market Sector
- September 2022: Becton, Dickinson, and Company released BD Research Cloud, a cloud-based software solution streamlining flow cytometry workflows.
- November 2022: Sony Corporation released SFA-Life Sciences Cloud Platform, a cloud-based solution for analyzing flow cytometry data, enhancing rare cell identification.
In-Depth Flow Cytometry Market Outlook
The Flow Cytometry market is poised for sustained growth, driven by technological advancements, expanding applications, and increasing healthcare investment. Strategic partnerships and market expansion into emerging economies present significant opportunities for market players. The market is expected to reach XX Million by 2033, representing substantial growth potential.
Flow Cytometry Market Segmentation
-
1. Product Type
- 1.1. Instrument
- 1.2. Kit and Reagent
- 1.3. Software and Services
-
2. Technology
- 2.1. Cell-based Flow Cytometry
- 2.2. Bead-based Flow Cytometry
-
3. Application
- 3.1. Oncology
- 3.2. Drug Discovery
- 3.3. Stem Cell Therapy
- 3.4. Organ Transplantation
- 3.5. Hematology
- 3.6. Other Applications
-
4. End-User
- 4.1. Hospitals and Clinics
- 4.2. Academia and Research Institutes
- 4.3. Pharmaceutical and Biotechnology Companies
- 4.4. Other End-Users
Flow Cytometry Market Segmentation By Geography
-
1. North America
- 1.1. United States
- 1.2. Canada
- 1.3. Mexico
-
2. Europe
- 2.1. Germany
- 2.2. United Kingdom
- 2.3. France
- 2.4. Italy
- 2.5. Spain
- 2.6. Rest of Europe
-
3. Asia Pacific
- 3.1. China
- 3.2. Japan
- 3.3. India
- 3.4. Australia
- 3.5. South Korea
- 3.6. Rest of Asia Pacific
-
4. Middle East and Africa
- 4.1. GCC
- 4.2. South Africa
- 4.3. Rest of Middle East and Africa
-
5. South America
- 5.1. Brazil
- 5.2. Argentina
- 5.3. Rest of South America
Flow Cytometry Market REPORT HIGHLIGHTS
| Aspects | Details |
|---|---|
| Study Period | 2019-2033 |
| Base Year | 2024 |
| Estimated Year | 2025 |
| Forecast Period | 2025-2033 |
| Historical Period | 2019-2024 |
| Growth Rate | CAGR of 7.69% from 2019-2033 |
| Segmentation |
|
Table of Contents
- 1. Introduction
- 1.1. Research Scope
- 1.2. Market Segmentation
- 1.3. Research Methodology
- 1.4. Definitions and Assumptions
- 2. Executive Summary
- 2.1. Introduction
- 3. Market Dynamics
- 3.1. Introduction
- 3.2. Market Drivers
- 3.2.1. Growing Adoption of Flow Cytometry in Stem Cell Research; Increasing Applications of Flow Cytometry in Clinical Research
- 3.3. Market Restrains
- 3.3.1. Lack of Awareness about the Potential Benefits of Flow Cytometry Techniques; High Cost of the Equipment
- 3.4. Market Trends
- 3.4.1. Stem Cell Therapy Segment is Expected to Witness a Significant Growth Over the Forecast Period.
- 4. Market Factor Analysis
- 4.1. Porters Five Forces
- 4.2. Supply/Value Chain
- 4.3. PESTEL analysis
- 4.4. Market Entropy
- 4.5. Patent/Trademark Analysis
- 5. Global Flow Cytometry Market Analysis, Insights and Forecast, 2019-2031
- 5.1. Market Analysis, Insights and Forecast - by Product Type
- 5.1.1. Instrument
- 5.1.2. Kit and Reagent
- 5.1.3. Software and Services
- 5.2. Market Analysis, Insights and Forecast - by Technology
- 5.2.1. Cell-based Flow Cytometry
- 5.2.2. Bead-based Flow Cytometry
- 5.3. Market Analysis, Insights and Forecast - by Application
- 5.3.1. Oncology
- 5.3.2. Drug Discovery
- 5.3.3. Stem Cell Therapy
- 5.3.4. Organ Transplantation
- 5.3.5. Hematology
- 5.3.6. Other Applications
- 5.4. Market Analysis, Insights and Forecast - by End-User
- 5.4.1. Hospitals and Clinics
- 5.4.2. Academia and Research Institutes
- 5.4.3. Pharmaceutical and Biotechnology Companies
- 5.4.4. Other End-Users
- 5.5. Market Analysis, Insights and Forecast - by Region
- 5.5.1. North America
- 5.5.2. Europe
- 5.5.3. Asia Pacific
- 5.5.4. Middle East and Africa
- 5.5.5. South America
- 5.1. Market Analysis, Insights and Forecast - by Product Type
- 6. North America Flow Cytometry Market Analysis, Insights and Forecast, 2019-2031
- 6.1. Market Analysis, Insights and Forecast - by Product Type
- 6.1.1. Instrument
- 6.1.2. Kit and Reagent
- 6.1.3. Software and Services
- 6.2. Market Analysis, Insights and Forecast - by Technology
- 6.2.1. Cell-based Flow Cytometry
- 6.2.2. Bead-based Flow Cytometry
- 6.3. Market Analysis, Insights and Forecast - by Application
- 6.3.1. Oncology
- 6.3.2. Drug Discovery
- 6.3.3. Stem Cell Therapy
- 6.3.4. Organ Transplantation
- 6.3.5. Hematology
- 6.3.6. Other Applications
- 6.4. Market Analysis, Insights and Forecast - by End-User
- 6.4.1. Hospitals and Clinics
- 6.4.2. Academia and Research Institutes
- 6.4.3. Pharmaceutical and Biotechnology Companies
- 6.4.4. Other End-Users
- 6.1. Market Analysis, Insights and Forecast - by Product Type
- 7. Europe Flow Cytometry Market Analysis, Insights and Forecast, 2019-2031
- 7.1. Market Analysis, Insights and Forecast - by Product Type
- 7.1.1. Instrument
- 7.1.2. Kit and Reagent
- 7.1.3. Software and Services
- 7.2. Market Analysis, Insights and Forecast - by Technology
- 7.2.1. Cell-based Flow Cytometry
- 7.2.2. Bead-based Flow Cytometry
- 7.3. Market Analysis, Insights and Forecast - by Application
- 7.3.1. Oncology
- 7.3.2. Drug Discovery
- 7.3.3. Stem Cell Therapy
- 7.3.4. Organ Transplantation
- 7.3.5. Hematology
- 7.3.6. Other Applications
- 7.4. Market Analysis, Insights and Forecast - by End-User
- 7.4.1. Hospitals and Clinics
- 7.4.2. Academia and Research Institutes
- 7.4.3. Pharmaceutical and Biotechnology Companies
- 7.4.4. Other End-Users
- 7.1. Market Analysis, Insights and Forecast - by Product Type
- 8. Asia Pacific Flow Cytometry Market Analysis, Insights and Forecast, 2019-2031
- 8.1. Market Analysis, Insights and Forecast - by Product Type
- 8.1.1. Instrument
- 8.1.2. Kit and Reagent
- 8.1.3. Software and Services
- 8.2. Market Analysis, Insights and Forecast - by Technology
- 8.2.1. Cell-based Flow Cytometry
- 8.2.2. Bead-based Flow Cytometry
- 8.3. Market Analysis, Insights and Forecast - by Application
- 8.3.1. Oncology
- 8.3.2. Drug Discovery
- 8.3.3. Stem Cell Therapy
- 8.3.4. Organ Transplantation
- 8.3.5. Hematology
- 8.3.6. Other Applications
- 8.4. Market Analysis, Insights and Forecast - by End-User
- 8.4.1. Hospitals and Clinics
- 8.4.2. Academia and Research Institutes
- 8.4.3. Pharmaceutical and Biotechnology Companies
- 8.4.4. Other End-Users
- 8.1. Market Analysis, Insights and Forecast - by Product Type
- 9. Middle East and Africa Flow Cytometry Market Analysis, Insights and Forecast, 2019-2031
- 9.1. Market Analysis, Insights and Forecast - by Product Type
- 9.1.1. Instrument
- 9.1.2. Kit and Reagent
- 9.1.3. Software and Services
- 9.2. Market Analysis, Insights and Forecast - by Technology
- 9.2.1. Cell-based Flow Cytometry
- 9.2.2. Bead-based Flow Cytometry
- 9.3. Market Analysis, Insights and Forecast - by Application
- 9.3.1. Oncology
- 9.3.2. Drug Discovery
- 9.3.3. Stem Cell Therapy
- 9.3.4. Organ Transplantation
- 9.3.5. Hematology
- 9.3.6. Other Applications
- 9.4. Market Analysis, Insights and Forecast - by End-User
- 9.4.1. Hospitals and Clinics
- 9.4.2. Academia and Research Institutes
- 9.4.3. Pharmaceutical and Biotechnology Companies
- 9.4.4. Other End-Users
- 9.1. Market Analysis, Insights and Forecast - by Product Type
- 10. South America Flow Cytometry Market Analysis, Insights and Forecast, 2019-2031
- 10.1. Market Analysis, Insights and Forecast - by Product Type
- 10.1.1. Instrument
- 10.1.2. Kit and Reagent
- 10.1.3. Software and Services
- 10.2. Market Analysis, Insights and Forecast - by Technology
- 10.2.1. Cell-based Flow Cytometry
- 10.2.2. Bead-based Flow Cytometry
- 10.3. Market Analysis, Insights and Forecast - by Application
- 10.3.1. Oncology
- 10.3.2. Drug Discovery
- 10.3.3. Stem Cell Therapy
- 10.3.4. Organ Transplantation
- 10.3.5. Hematology
- 10.3.6. Other Applications
- 10.4. Market Analysis, Insights and Forecast - by End-User
- 10.4.1. Hospitals and Clinics
- 10.4.2. Academia and Research Institutes
- 10.4.3. Pharmaceutical and Biotechnology Companies
- 10.4.4. Other End-Users
- 10.1. Market Analysis, Insights and Forecast - by Product Type
- 11. North America Flow Cytometry Market Analysis, Insights and Forecast, 2019-2031
- 11.1. Market Analysis, Insights and Forecast - By Country/Sub-region
- 11.1.1 United States
- 11.1.2 Canada
- 11.1.3 Mexico
- 12. Europe Flow Cytometry Market Analysis, Insights and Forecast, 2019-2031
- 12.1. Market Analysis, Insights and Forecast - By Country/Sub-region
- 12.1.1 Germany
- 12.1.2 United Kingdom
- 12.1.3 France
- 12.1.4 Italy
- 12.1.5 Spain
- 12.1.6 Rest of Europe
- 13. Asia Pacific Flow Cytometry Market Analysis, Insights and Forecast, 2019-2031
- 13.1. Market Analysis, Insights and Forecast - By Country/Sub-region
- 13.1.1 China
- 13.1.2 Japan
- 13.1.3 India
- 13.1.4 Australia
- 13.1.5 South Korea
- 13.1.6 Rest of Asia Pacific
- 14. Middle East and Africa Flow Cytometry Market Analysis, Insights and Forecast, 2019-2031
- 14.1. Market Analysis, Insights and Forecast - By Country/Sub-region
- 14.1.1 GCC
- 14.1.2 South Africa
- 14.1.3 Rest of Middle East and Africa
- 15. South America Flow Cytometry Market Analysis, Insights and Forecast, 2019-2031
- 15.1. Market Analysis, Insights and Forecast - By Country/Sub-region
- 15.1.1 Brazil
- 15.1.2 Argentina
- 15.1.3 Rest of South America
- 16. Competitive Analysis
- 16.1. Global Market Share Analysis 2024
- 16.2. Company Profiles
- 16.2.1 Becton Dickinson and Company
- 16.2.1.1. Overview
- 16.2.1.2. Products
- 16.2.1.3. SWOT Analysis
- 16.2.1.4. Recent Developments
- 16.2.1.5. Financials (Based on Availability)
- 16.2.2 Enzo Biochem Inc (Enzo Life Sciences Inc )*List Not Exhaustive
- 16.2.2.1. Overview
- 16.2.2.2. Products
- 16.2.2.3. SWOT Analysis
- 16.2.2.4. Recent Developments
- 16.2.2.5. Financials (Based on Availability)
- 16.2.3 Miltenyi Biotech
- 16.2.3.1. Overview
- 16.2.3.2. Products
- 16.2.3.3. SWOT Analysis
- 16.2.3.4. Recent Developments
- 16.2.3.5. Financials (Based on Availability)
- 16.2.4 BioMerieux SA
- 16.2.4.1. Overview
- 16.2.4.2. Products
- 16.2.4.3. SWOT Analysis
- 16.2.4.4. Recent Developments
- 16.2.4.5. Financials (Based on Availability)
- 16.2.5 Bio-Rad Laboratories Inc
- 16.2.5.1. Overview
- 16.2.5.2. Products
- 16.2.5.3. SWOT Analysis
- 16.2.5.4. Recent Developments
- 16.2.5.5. Financials (Based on Availability)
- 16.2.6 Stratedigm Inc
- 16.2.6.1. Overview
- 16.2.6.2. Products
- 16.2.6.3. SWOT Analysis
- 16.2.6.4. Recent Developments
- 16.2.6.5. Financials (Based on Availability)
- 16.2.7 Sony Biotechnology Inc (Sony Corporation of America)
- 16.2.7.1. Overview
- 16.2.7.2. Products
- 16.2.7.3. SWOT Analysis
- 16.2.7.4. Recent Developments
- 16.2.7.5. Financials (Based on Availability)
- 16.2.8 Agilent Technologies Inc
- 16.2.8.1. Overview
- 16.2.8.2. Products
- 16.2.8.3. SWOT Analysis
- 16.2.8.4. Recent Developments
- 16.2.8.5. Financials (Based on Availability)
- 16.2.9 Sysmex Corporation
- 16.2.9.1. Overview
- 16.2.9.2. Products
- 16.2.9.3. SWOT Analysis
- 16.2.9.4. Recent Developments
- 16.2.9.5. Financials (Based on Availability)
- 16.2.10 Danaher corporation (Beckman Coulter Inc )
- 16.2.10.1. Overview
- 16.2.10.2. Products
- 16.2.10.3. SWOT Analysis
- 16.2.10.4. Recent Developments
- 16.2.10.5. Financials (Based on Availability)
- 16.2.11 Luminex Corporation
- 16.2.11.1. Overview
- 16.2.11.2. Products
- 16.2.11.3. SWOT Analysis
- 16.2.11.4. Recent Developments
- 16.2.11.5. Financials (Based on Availability)
- 16.2.12 ThermoFisher Scientific Inc
- 16.2.12.1. Overview
- 16.2.12.2. Products
- 16.2.12.3. SWOT Analysis
- 16.2.12.4. Recent Developments
- 16.2.12.5. Financials (Based on Availability)
- 16.2.1 Becton Dickinson and Company
List of Figures
- Figure 1: Global Flow Cytometry Market Revenue Breakdown (Million, %) by Region 2024 & 2032
- Figure 2: North America Flow Cytometry Market Revenue (Million), by Country 2024 & 2032
- Figure 3: North America Flow Cytometry Market Revenue Share (%), by Country 2024 & 2032
- Figure 4: Europe Flow Cytometry Market Revenue (Million), by Country 2024 & 2032
- Figure 5: Europe Flow Cytometry Market Revenue Share (%), by Country 2024 & 2032
- Figure 6: Asia Pacific Flow Cytometry Market Revenue (Million), by Country 2024 & 2032
- Figure 7: Asia Pacific Flow Cytometry Market Revenue Share (%), by Country 2024 & 2032
- Figure 8: Middle East and Africa Flow Cytometry Market Revenue (Million), by Country 2024 & 2032
- Figure 9: Middle East and Africa Flow Cytometry Market Revenue Share (%), by Country 2024 & 2032
- Figure 10: South America Flow Cytometry Market Revenue (Million), by Country 2024 & 2032
- Figure 11: South America Flow Cytometry Market Revenue Share (%), by Country 2024 & 2032
- Figure 12: North America Flow Cytometry Market Revenue (Million), by Product Type 2024 & 2032
- Figure 13: North America Flow Cytometry Market Revenue Share (%), by Product Type 2024 & 2032
- Figure 14: North America Flow Cytometry Market Revenue (Million), by Technology 2024 & 2032
- Figure 15: North America Flow Cytometry Market Revenue Share (%), by Technology 2024 & 2032
- Figure 16: North America Flow Cytometry Market Revenue (Million), by Application 2024 & 2032
- Figure 17: North America Flow Cytometry Market Revenue Share (%), by Application 2024 & 2032
- Figure 18: North America Flow Cytometry Market Revenue (Million), by End-User 2024 & 2032
- Figure 19: North America Flow Cytometry Market Revenue Share (%), by End-User 2024 & 2032
- Figure 20: North America Flow Cytometry Market Revenue (Million), by Country 2024 & 2032
- Figure 21: North America Flow Cytometry Market Revenue Share (%), by Country 2024 & 2032
- Figure 22: Europe Flow Cytometry Market Revenue (Million), by Product Type 2024 & 2032
- Figure 23: Europe Flow Cytometry Market Revenue Share (%), by Product Type 2024 & 2032
- Figure 24: Europe Flow Cytometry Market Revenue (Million), by Technology 2024 & 2032
- Figure 25: Europe Flow Cytometry Market Revenue Share (%), by Technology 2024 & 2032
- Figure 26: Europe Flow Cytometry Market Revenue (Million), by Application 2024 & 2032
- Figure 27: Europe Flow Cytometry Market Revenue Share (%), by Application 2024 & 2032
- Figure 28: Europe Flow Cytometry Market Revenue (Million), by End-User 2024 & 2032
- Figure 29: Europe Flow Cytometry Market Revenue Share (%), by End-User 2024 & 2032
- Figure 30: Europe Flow Cytometry Market Revenue (Million), by Country 2024 & 2032
- Figure 31: Europe Flow Cytometry Market Revenue Share (%), by Country 2024 & 2032
- Figure 32: Asia Pacific Flow Cytometry Market Revenue (Million), by Product Type 2024 & 2032
- Figure 33: Asia Pacific Flow Cytometry Market Revenue Share (%), by Product Type 2024 & 2032
- Figure 34: Asia Pacific Flow Cytometry Market Revenue (Million), by Technology 2024 & 2032
- Figure 35: Asia Pacific Flow Cytometry Market Revenue Share (%), by Technology 2024 & 2032
- Figure 36: Asia Pacific Flow Cytometry Market Revenue (Million), by Application 2024 & 2032
- Figure 37: Asia Pacific Flow Cytometry Market Revenue Share (%), by Application 2024 & 2032
- Figure 38: Asia Pacific Flow Cytometry Market Revenue (Million), by End-User 2024 & 2032
- Figure 39: Asia Pacific Flow Cytometry Market Revenue Share (%), by End-User 2024 & 2032
- Figure 40: Asia Pacific Flow Cytometry Market Revenue (Million), by Country 2024 & 2032
- Figure 41: Asia Pacific Flow Cytometry Market Revenue Share (%), by Country 2024 & 2032
- Figure 42: Middle East and Africa Flow Cytometry Market Revenue (Million), by Product Type 2024 & 2032
- Figure 43: Middle East and Africa Flow Cytometry Market Revenue Share (%), by Product Type 2024 & 2032
- Figure 44: Middle East and Africa Flow Cytometry Market Revenue (Million), by Technology 2024 & 2032
- Figure 45: Middle East and Africa Flow Cytometry Market Revenue Share (%), by Technology 2024 & 2032
- Figure 46: Middle East and Africa Flow Cytometry Market Revenue (Million), by Application 2024 & 2032
- Figure 47: Middle East and Africa Flow Cytometry Market Revenue Share (%), by Application 2024 & 2032
- Figure 48: Middle East and Africa Flow Cytometry Market Revenue (Million), by End-User 2024 & 2032
- Figure 49: Middle East and Africa Flow Cytometry Market Revenue Share (%), by End-User 2024 & 2032
- Figure 50: Middle East and Africa Flow Cytometry Market Revenue (Million), by Country 2024 & 2032
- Figure 51: Middle East and Africa Flow Cytometry Market Revenue Share (%), by Country 2024 & 2032
- Figure 52: South America Flow Cytometry Market Revenue (Million), by Product Type 2024 & 2032
- Figure 53: South America Flow Cytometry Market Revenue Share (%), by Product Type 2024 & 2032
- Figure 54: South America Flow Cytometry Market Revenue (Million), by Technology 2024 & 2032
- Figure 55: South America Flow Cytometry Market Revenue Share (%), by Technology 2024 & 2032
- Figure 56: South America Flow Cytometry Market Revenue (Million), by Application 2024 & 2032
- Figure 57: South America Flow Cytometry Market Revenue Share (%), by Application 2024 & 2032
- Figure 58: South America Flow Cytometry Market Revenue (Million), by End-User 2024 & 2032
- Figure 59: South America Flow Cytometry Market Revenue Share (%), by End-User 2024 & 2032
- Figure 60: South America Flow Cytometry Market Revenue (Million), by Country 2024 & 2032
- Figure 61: South America Flow Cytometry Market Revenue Share (%), by Country 2024 & 2032
List of Tables
- Table 1: Global Flow Cytometry Market Revenue Million Forecast, by Region 2019 & 2032
- Table 2: Global Flow Cytometry Market Revenue Million Forecast, by Product Type 2019 & 2032
- Table 3: Global Flow Cytometry Market Revenue Million Forecast, by Technology 2019 & 2032
- Table 4: Global Flow Cytometry Market Revenue Million Forecast, by Application 2019 & 2032
- Table 5: Global Flow Cytometry Market Revenue Million Forecast, by End-User 2019 & 2032
- Table 6: Global Flow Cytometry Market Revenue Million Forecast, by Region 2019 & 2032
- Table 7: Global Flow Cytometry Market Revenue Million Forecast, by Country 2019 & 2032
- Table 8: United States Flow Cytometry Market Revenue (Million) Forecast, by Application 2019 & 2032
- Table 9: Canada Flow Cytometry Market Revenue (Million) Forecast, by Application 2019 & 2032
- Table 10: Mexico Flow Cytometry Market Revenue (Million) Forecast, by Application 2019 & 2032
- Table 11: Global Flow Cytometry Market Revenue Million Forecast, by Country 2019 & 2032
- Table 12: Germany Flow Cytometry Market Revenue (Million) Forecast, by Application 2019 & 2032
- Table 13: United Kingdom Flow Cytometry Market Revenue (Million) Forecast, by Application 2019 & 2032
- Table 14: France Flow Cytometry Market Revenue (Million) Forecast, by Application 2019 & 2032
- Table 15: Italy Flow Cytometry Market Revenue (Million) Forecast, by Application 2019 & 2032
- Table 16: Spain Flow Cytometry Market Revenue (Million) Forecast, by Application 2019 & 2032
- Table 17: Rest of Europe Flow Cytometry Market Revenue (Million) Forecast, by Application 2019 & 2032
- Table 18: Global Flow Cytometry Market Revenue Million Forecast, by Country 2019 & 2032
- Table 19: China Flow Cytometry Market Revenue (Million) Forecast, by Application 2019 & 2032
- Table 20: Japan Flow Cytometry Market Revenue (Million) Forecast, by Application 2019 & 2032
- Table 21: India Flow Cytometry Market Revenue (Million) Forecast, by Application 2019 & 2032
- Table 22: Australia Flow Cytometry Market Revenue (Million) Forecast, by Application 2019 & 2032
- Table 23: South Korea Flow Cytometry Market Revenue (Million) Forecast, by Application 2019 & 2032
- Table 24: Rest of Asia Pacific Flow Cytometry Market Revenue (Million) Forecast, by Application 2019 & 2032
- Table 25: Global Flow Cytometry Market Revenue Million Forecast, by Country 2019 & 2032
- Table 26: GCC Flow Cytometry Market Revenue (Million) Forecast, by Application 2019 & 2032
- Table 27: South Africa Flow Cytometry Market Revenue (Million) Forecast, by Application 2019 & 2032
- Table 28: Rest of Middle East and Africa Flow Cytometry Market Revenue (Million) Forecast, by Application 2019 & 2032
- Table 29: Global Flow Cytometry Market Revenue Million Forecast, by Country 2019 & 2032
- Table 30: Brazil Flow Cytometry Market Revenue (Million) Forecast, by Application 2019 & 2032
- Table 31: Argentina Flow Cytometry Market Revenue (Million) Forecast, by Application 2019 & 2032
- Table 32: Rest of South America Flow Cytometry Market Revenue (Million) Forecast, by Application 2019 & 2032
- Table 33: Global Flow Cytometry Market Revenue Million Forecast, by Product Type 2019 & 2032
- Table 34: Global Flow Cytometry Market Revenue Million Forecast, by Technology 2019 & 2032
- Table 35: Global Flow Cytometry Market Revenue Million Forecast, by Application 2019 & 2032
- Table 36: Global Flow Cytometry Market Revenue Million Forecast, by End-User 2019 & 2032
- Table 37: Global Flow Cytometry Market Revenue Million Forecast, by Country 2019 & 2032
- Table 38: United States Flow Cytometry Market Revenue (Million) Forecast, by Application 2019 & 2032
- Table 39: Canada Flow Cytometry Market Revenue (Million) Forecast, by Application 2019 & 2032
- Table 40: Mexico Flow Cytometry Market Revenue (Million) Forecast, by Application 2019 & 2032
- Table 41: Global Flow Cytometry Market Revenue Million Forecast, by Product Type 2019 & 2032
- Table 42: Global Flow Cytometry Market Revenue Million Forecast, by Technology 2019 & 2032
- Table 43: Global Flow Cytometry Market Revenue Million Forecast, by Application 2019 & 2032
- Table 44: Global Flow Cytometry Market Revenue Million Forecast, by End-User 2019 & 2032
- Table 45: Global Flow Cytometry Market Revenue Million Forecast, by Country 2019 & 2032
- Table 46: Germany Flow Cytometry Market Revenue (Million) Forecast, by Application 2019 & 2032
- Table 47: United Kingdom Flow Cytometry Market Revenue (Million) Forecast, by Application 2019 & 2032
- Table 48: France Flow Cytometry Market Revenue (Million) Forecast, by Application 2019 & 2032
- Table 49: Italy Flow Cytometry Market Revenue (Million) Forecast, by Application 2019 & 2032
- Table 50: Spain Flow Cytometry Market Revenue (Million) Forecast, by Application 2019 & 2032
- Table 51: Rest of Europe Flow Cytometry Market Revenue (Million) Forecast, by Application 2019 & 2032
- Table 52: Global Flow Cytometry Market Revenue Million Forecast, by Product Type 2019 & 2032
- Table 53: Global Flow Cytometry Market Revenue Million Forecast, by Technology 2019 & 2032
- Table 54: Global Flow Cytometry Market Revenue Million Forecast, by Application 2019 & 2032
- Table 55: Global Flow Cytometry Market Revenue Million Forecast, by End-User 2019 & 2032
- Table 56: Global Flow Cytometry Market Revenue Million Forecast, by Country 2019 & 2032
- Table 57: China Flow Cytometry Market Revenue (Million) Forecast, by Application 2019 & 2032
- Table 58: Japan Flow Cytometry Market Revenue (Million) Forecast, by Application 2019 & 2032
- Table 59: India Flow Cytometry Market Revenue (Million) Forecast, by Application 2019 & 2032
- Table 60: Australia Flow Cytometry Market Revenue (Million) Forecast, by Application 2019 & 2032
- Table 61: South Korea Flow Cytometry Market Revenue (Million) Forecast, by Application 2019 & 2032
- Table 62: Rest of Asia Pacific Flow Cytometry Market Revenue (Million) Forecast, by Application 2019 & 2032
- Table 63: Global Flow Cytometry Market Revenue Million Forecast, by Product Type 2019 & 2032
- Table 64: Global Flow Cytometry Market Revenue Million Forecast, by Technology 2019 & 2032
- Table 65: Global Flow Cytometry Market Revenue Million Forecast, by Application 2019 & 2032
- Table 66: Global Flow Cytometry Market Revenue Million Forecast, by End-User 2019 & 2032
- Table 67: Global Flow Cytometry Market Revenue Million Forecast, by Country 2019 & 2032
- Table 68: GCC Flow Cytometry Market Revenue (Million) Forecast, by Application 2019 & 2032
- Table 69: South Africa Flow Cytometry Market Revenue (Million) Forecast, by Application 2019 & 2032
- Table 70: Rest of Middle East and Africa Flow Cytometry Market Revenue (Million) Forecast, by Application 2019 & 2032
- Table 71: Global Flow Cytometry Market Revenue Million Forecast, by Product Type 2019 & 2032
- Table 72: Global Flow Cytometry Market Revenue Million Forecast, by Technology 2019 & 2032
- Table 73: Global Flow Cytometry Market Revenue Million Forecast, by Application 2019 & 2032
- Table 74: Global Flow Cytometry Market Revenue Million Forecast, by End-User 2019 & 2032
- Table 75: Global Flow Cytometry Market Revenue Million Forecast, by Country 2019 & 2032
- Table 76: Brazil Flow Cytometry Market Revenue (Million) Forecast, by Application 2019 & 2032
- Table 77: Argentina Flow Cytometry Market Revenue (Million) Forecast, by Application 2019 & 2032
- Table 78: Rest of South America Flow Cytometry Market Revenue (Million) Forecast, by Application 2019 & 2032
Frequently Asked Questions
1. What is the projected Compound Annual Growth Rate (CAGR) of the Flow Cytometry Market?
The projected CAGR is approximately 7.69%.
2. Which companies are prominent players in the Flow Cytometry Market?
Key companies in the market include Becton Dickinson and Company, Enzo Biochem Inc (Enzo Life Sciences Inc )*List Not Exhaustive, Miltenyi Biotech, BioMerieux SA, Bio-Rad Laboratories Inc, Stratedigm Inc, Sony Biotechnology Inc (Sony Corporation of America), Agilent Technologies Inc, Sysmex Corporation, Danaher corporation (Beckman Coulter Inc ), Luminex Corporation, ThermoFisher Scientific Inc.
3. What are the main segments of the Flow Cytometry Market?
The market segments include Product Type, Technology, Application, End-User.
4. Can you provide details about the market size?
The market size is estimated to be USD 6.27 Million as of 2022.
5. What are some drivers contributing to market growth?
Growing Adoption of Flow Cytometry in Stem Cell Research; Increasing Applications of Flow Cytometry in Clinical Research.
6. What are the notable trends driving market growth?
Stem Cell Therapy Segment is Expected to Witness a Significant Growth Over the Forecast Period..
7. Are there any restraints impacting market growth?
Lack of Awareness about the Potential Benefits of Flow Cytometry Techniques; High Cost of the Equipment.
8. Can you provide examples of recent developments in the market?
November 2022: Sony Corporation released SFA-Life Sciences Cloud Platform, a cloud-based solution for analyzing flow cytometry data that makes it easy to find rare cells like cancer cells and stem cells in a large number of cell populations. The solution uses data from flow cytometers to do this.
9. What pricing options are available for accessing the report?
Pricing options include single-user, multi-user, and enterprise licenses priced at USD 4750, USD 5250, and USD 8750 respectively.
10. Is the market size provided in terms of value or volume?
The market size is provided in terms of value, measured in Million.
11. Are there any specific market keywords associated with the report?
Yes, the market keyword associated with the report is "Flow Cytometry Market," which aids in identifying and referencing the specific market segment covered.
12. How do I determine which pricing option suits my needs best?
The pricing options vary based on user requirements and access needs. Individual users may opt for single-user licenses, while businesses requiring broader access may choose multi-user or enterprise licenses for cost-effective access to the report.
13. Are there any additional resources or data provided in the Flow Cytometry Market report?
While the report offers comprehensive insights, it's advisable to review the specific contents or supplementary materials provided to ascertain if additional resources or data are available.
14. How can I stay updated on further developments or reports in the Flow Cytometry Market?
To stay informed about further developments, trends, and reports in the Flow Cytometry Market, consider subscribing to industry newsletters, following relevant companies and organizations, or regularly checking reputable industry news sources and publications.
Methodology
Step 1 - Identification of Relevant Samples Size from Population Database


Step 2 - Approaches for Defining Global Market Size (Value, Volume* & Price*)

Note*: In applicable scenarios
Step 3 - Data Sources
Primary Research
- Web Analytics
- Survey Reports
- Research Institute
- Latest Research Reports
- Opinion Leaders
Secondary Research
- Annual Reports
- White Paper
- Latest Press Release
- Industry Association
- Paid Database
- Investor Presentations

Step 4 - Data Triangulation
Involves using different sources of information in order to increase the validity of a study
These sources are likely to be stakeholders in a program - participants, other researchers, program staff, other community members, and so on.
Then we put all data in single framework & apply various statistical tools to find out the dynamic on the market.
During the analysis stage, feedback from the stakeholder groups would be compared to determine areas of agreement as well as areas of divergence
