

Key Insights
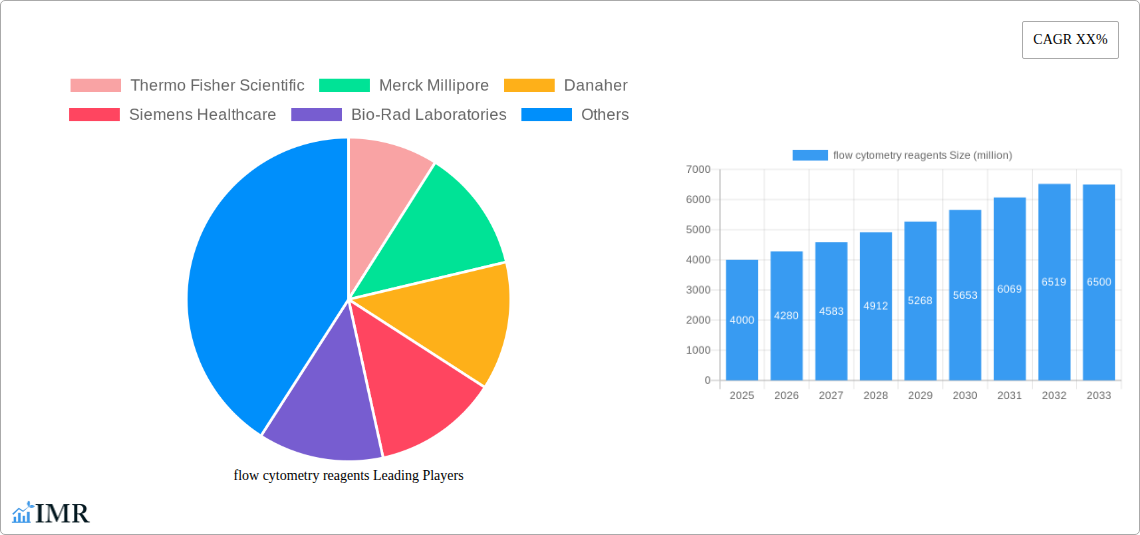
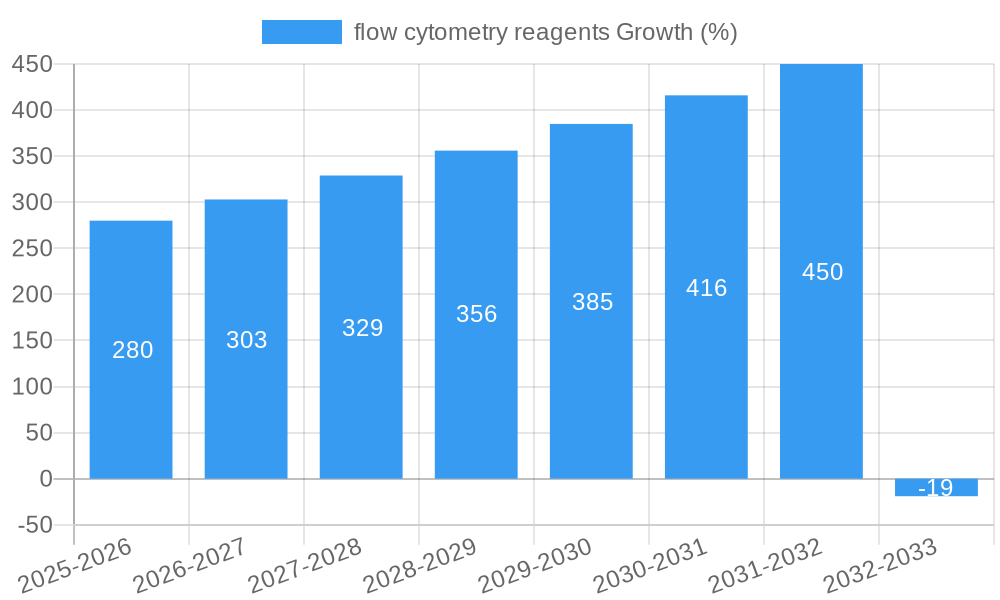
The global flow cytometry reagents market is experiencing robust growth, driven by the increasing prevalence of chronic diseases, rising demand for personalized medicine, and advancements in flow cytometry technology. The market, estimated at $4 billion in 2025, is projected to exhibit a Compound Annual Growth Rate (CAGR) of approximately 7% from 2025 to 2033, reaching an estimated value of $6.5 billion by 2033. This expansion is fueled by several key factors. Firstly, the rising incidence of cancer, autoimmune disorders, and infectious diseases necessitates advanced diagnostic tools, significantly boosting the demand for flow cytometry reagents for research, diagnosis, and monitoring disease progression. Secondly, the increasing adoption of high-throughput screening and multiplex assays in drug discovery and development further contributes to market growth. Finally, continuous technological advancements leading to improved sensitivity, specificity, and automation of flow cytometry instruments are enhancing the efficiency and efficacy of these reagents, driving market expansion. Competition is fierce, with major players such as Thermo Fisher Scientific, Merck Millipore, and Danaher holding significant market share. However, smaller companies specializing in niche reagents or innovative technologies are also emerging as key competitors.
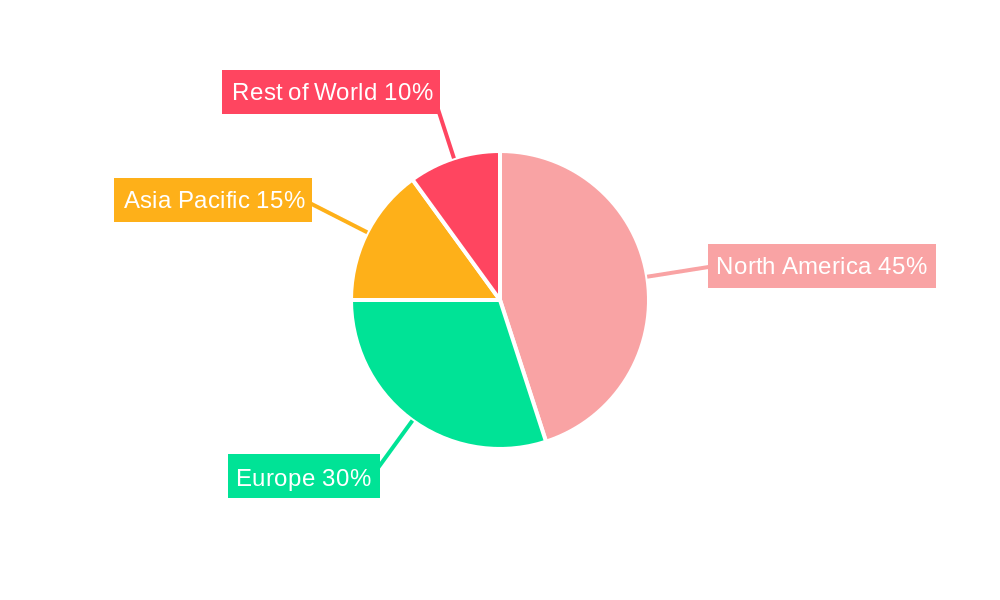
Despite the promising outlook, the market faces certain challenges. High costs associated with flow cytometry instruments and reagents can limit accessibility, particularly in resource-constrained settings. Furthermore, stringent regulatory approvals and evolving reimbursement policies can impact market growth. However, ongoing technological advancements focused on cost reduction and the increasing availability of affordable instruments are expected to alleviate these constraints. The market is segmented by reagent type (fluorescent antibodies, isotype controls, etc.), application (immunology, hematology, oncology, etc.), and end-user (research institutions, hospitals, pharmaceutical companies). Geographic regions such as North America and Europe currently dominate the market, driven by well-established healthcare infrastructure and robust research funding. However, emerging economies in Asia-Pacific are exhibiting strong growth potential due to rising healthcare expenditure and increasing awareness of advanced diagnostic techniques.
Flow Cytometry Reagents Market Report: 2019-2033
This comprehensive report provides a detailed analysis of the flow cytometry reagents market, encompassing market dynamics, growth trends, regional dominance, product landscape, key players, and future outlook. The report covers the period 2019-2033, with a focus on the forecast period 2025-2033 and a base year of 2025. The market is segmented by type of reagent, application, and end-user, with a granular analysis of major geographic regions. The total market value is projected to reach xx million units by 2033.
Flow Cytometry Reagents Market Dynamics & Structure
The flow cytometry reagents market is characterized by a moderately concentrated landscape, with key players such as Thermo Fisher Scientific, Merck Millipore, Danaher, and BD holding significant market share. Market concentration is estimated at xx% in 2025, with the top 5 players accounting for approximately xx million units. Technological innovation, particularly in areas like multiplex assays and high-throughput screening, is a major driver. Regulatory frameworks, including those related to in-vitro diagnostics (IVD) and clinical trials, significantly impact market growth. Competitive pressures arise from the emergence of alternative technologies and the presence of substitute products. The end-user demographics are diverse, including research institutions, pharmaceutical companies, hospitals, and clinical diagnostic laboratories. M&A activity in the sector is moderate, with an average of xx deals annually during the historical period (2019-2024).
- Market Concentration: xx% in 2025 (Top 5 players)
- Key Innovation Drivers: Multiplex assays, high-throughput screening, automation
- Regulatory Landscape: Stringent IVD regulations, impacting product development and approval timelines.
- Competitive Substitutes: Emerging technologies like mass cytometry and microfluidics
- M&A Activity: Average of xx deals annually (2019-2024)
- Innovation Barriers: High R&D costs, regulatory hurdles, and intellectual property protection.
Flow Cytometry Reagents Growth Trends & Insights
The global flow cytometry reagents market experienced steady growth during the historical period (2019-2024), expanding at a CAGR of xx%. This growth is primarily fueled by increasing demand from research and clinical diagnostic applications. Rising prevalence of chronic diseases, growing investment in life sciences research, and the development of more sophisticated flow cytometry techniques all contribute to market expansion. Technological advancements, such as the introduction of improved fluorochromes and advanced detection systems, further drive adoption rates. Shifts in consumer behavior toward personalized medicine and point-of-care diagnostics are also impacting market dynamics. The market is expected to continue its growth trajectory, with a projected CAGR of xx% from 2025 to 2033, reaching a projected market size of xx million units by 2033. Market penetration in key regions is steadily increasing, driven by factors such as increasing healthcare spending and improved healthcare infrastructure.
Dominant Regions, Countries, or Segments in Flow Cytometry Reagents
North America currently holds the largest market share in the flow cytometry reagents market, followed by Europe. This dominance is attributed to the high concentration of research institutions, pharmaceutical companies, and well-established healthcare infrastructure in these regions. The strong regulatory environment and high healthcare expenditure further contribute to market growth. Asia-Pacific is experiencing rapid growth, driven by increasing healthcare investment, rising prevalence of infectious diseases, and expanding research activities.
- North America: Strong research base, high healthcare spending, established regulatory framework.
- Europe: Mature market with substantial research funding and advanced healthcare infrastructure.
- Asia-Pacific: Rapid growth driven by increasing healthcare spending and expanding research base.
- Other Regions: Steady growth, but comparatively smaller market size.
Flow Cytometry Reagents Product Landscape
The flow cytometry reagents market offers a wide array of products, including antibodies, dyes, and other reagents optimized for various applications. Significant advancements have been made in the development of highly specific and sensitive reagents, enabling improved detection and analysis of various cell populations. Unique selling propositions often focus on superior performance metrics, including high signal-to-noise ratios, low background fluorescence, and extended shelf life. Recent technological advancements have led to the development of novel reagents suitable for multiplex assays, enabling the simultaneous detection of multiple cellular markers, improving the efficiency and depth of analysis.
Key Drivers, Barriers & Challenges in Flow Cytometry Reagents
Key Drivers:
- Increasing prevalence of chronic diseases.
- Rising investment in life science research.
- Technological advancements in flow cytometry instrumentation and reagents.
- Growing demand for personalized medicine.
Challenges & Restraints:
- High cost of reagents and instrumentation.
- Stringent regulatory requirements for IVD reagents.
- Potential for technical complexities in multi-color flow cytometry assays.
- Competition from alternative technologies. The impact of these challenges is estimated to reduce market growth by approximately xx% during the forecast period.
Emerging Opportunities in Flow Cytometry Reagents
Emerging opportunities lie in the development of novel reagents for next-generation flow cytometry techniques and their application in new areas, including cancer immunotherapy, regenerative medicine, and infectious disease research. Untapped markets in developing countries with high infectious disease burdens also represent significant growth potential. The integration of flow cytometry with other technologies, such as single-cell genomics and proteomics, will lead to more comprehensive insights and new applications. Evolving consumer preferences toward faster and more user-friendly assays also present opportunities for new product development and commercialization strategies.
Growth Accelerators in the flow cytometry reagents Industry
Long-term growth will be fueled by continued technological innovation, specifically the development of novel reagents for advanced applications such as single-cell analysis and immune profiling. Strategic partnerships between reagent manufacturers and instrumentation companies will accelerate market expansion. Expansion into emerging markets, driven by increasing healthcare infrastructure and rising awareness of the clinical utility of flow cytometry, will also contribute to long-term growth.
Key Players Shaping the flow cytometry reagents Market
- Thermo Fisher Scientific
- Merck Millipore
- Danaher
- Siemens Healthcare
- Bio-Rad Laboratories
- Roche
- Sysmex
- PerkinElmer
- Abcam
- BD
- Agilent Technologies
Notable Milestones in flow cytometry reagents Sector
- 2020: Launch of novel fluorescent antibodies with improved sensitivity by Thermo Fisher Scientific.
- 2021: Acquisition of a smaller reagent company by BD, expanding its product portfolio.
- 2022: FDA approval of a new flow cytometry reagent for a specific cancer diagnosis.
- 2023: Introduction of a high-throughput screening platform by Merck Millipore.
- 2024: Publication of significant research findings using advanced flow cytometry reagents.
In-Depth Flow Cytometry Reagents Market Outlook
The flow cytometry reagents market is poised for sustained growth over the forecast period, driven by technological advancements, increasing research funding, and expanding applications in various healthcare settings. Strategic partnerships and mergers and acquisitions will continue to shape the market landscape, leading to increased competition and innovation. The market is expected to witness a gradual shift toward more sophisticated reagents, such as those designed for single-cell analysis and multiplex assays. This shift will generate significant opportunities for companies with robust R&D capabilities and a strong focus on innovation. The market's long-term potential is substantial, driven by the growing demand for improved diagnostic and therapeutic tools, which underscores the growing significance of flow cytometry across a multitude of scientific disciplines.
flow cytometry reagents Segmentation
-
1. Application
- 1.1. Pharmaceutical & Biotechnological Companies
- 1.2. Academic & Research Institutes
- 1.3. Contract Research Organizations
- 1.4. Others
-
2. Types
- 2.1. Single-color Reagent
- 2.2. Two-color Reagent
- 2.3. Multicolor Reagent
flow cytometry reagents Segmentation By Geography
-
1. North America
- 1.1. United States
- 1.2. Canada
- 1.3. Mexico
-
2. South America
- 2.1. Brazil
- 2.2. Argentina
- 2.3. Rest of South America
-
3. Europe
- 3.1. United Kingdom
- 3.2. Germany
- 3.3. France
- 3.4. Italy
- 3.5. Spain
- 3.6. Russia
- 3.7. Benelux
- 3.8. Nordics
- 3.9. Rest of Europe
-
4. Middle East & Africa
- 4.1. Turkey
- 4.2. Israel
- 4.3. GCC
- 4.4. North Africa
- 4.5. South Africa
- 4.6. Rest of Middle East & Africa
-
5. Asia Pacific
- 5.1. China
- 5.2. India
- 5.3. Japan
- 5.4. South Korea
- 5.5. ASEAN
- 5.6. Oceania
- 5.7. Rest of Asia Pacific
flow cytometry reagents REPORT HIGHLIGHTS
| Aspects | Details |
|---|---|
| Study Period | 2019-2033 |
| Base Year | 2024 |
| Estimated Year | 2025 |
| Forecast Period | 2025-2033 |
| Historical Period | 2019-2024 |
| Growth Rate | CAGR of XX% from 2019-2033 |
| Segmentation |
|
Table of Contents
- 1. Introduction
- 1.1. Research Scope
- 1.2. Market Segmentation
- 1.3. Research Methodology
- 1.4. Definitions and Assumptions
- 2. Executive Summary
- 2.1. Introduction
- 3. Market Dynamics
- 3.1. Introduction
- 3.2. Market Drivers
- 3.3. Market Restrains
- 3.4. Market Trends
- 4. Market Factor Analysis
- 4.1. Porters Five Forces
- 4.2. Supply/Value Chain
- 4.3. PESTEL analysis
- 4.4. Market Entropy
- 4.5. Patent/Trademark Analysis
- 5. Global flow cytometry reagents Analysis, Insights and Forecast, 2019-2031
- 5.1. Market Analysis, Insights and Forecast - by Application
- 5.1.1. Pharmaceutical & Biotechnological Companies
- 5.1.2. Academic & Research Institutes
- 5.1.3. Contract Research Organizations
- 5.1.4. Others
- 5.2. Market Analysis, Insights and Forecast - by Types
- 5.2.1. Single-color Reagent
- 5.2.2. Two-color Reagent
- 5.2.3. Multicolor Reagent
- 5.3. Market Analysis, Insights and Forecast - by Region
- 5.3.1. North America
- 5.3.2. South America
- 5.3.3. Europe
- 5.3.4. Middle East & Africa
- 5.3.5. Asia Pacific
- 5.1. Market Analysis, Insights and Forecast - by Application
- 6. North America flow cytometry reagents Analysis, Insights and Forecast, 2019-2031
- 6.1. Market Analysis, Insights and Forecast - by Application
- 6.1.1. Pharmaceutical & Biotechnological Companies
- 6.1.2. Academic & Research Institutes
- 6.1.3. Contract Research Organizations
- 6.1.4. Others
- 6.2. Market Analysis, Insights and Forecast - by Types
- 6.2.1. Single-color Reagent
- 6.2.2. Two-color Reagent
- 6.2.3. Multicolor Reagent
- 6.1. Market Analysis, Insights and Forecast - by Application
- 7. South America flow cytometry reagents Analysis, Insights and Forecast, 2019-2031
- 7.1. Market Analysis, Insights and Forecast - by Application
- 7.1.1. Pharmaceutical & Biotechnological Companies
- 7.1.2. Academic & Research Institutes
- 7.1.3. Contract Research Organizations
- 7.1.4. Others
- 7.2. Market Analysis, Insights and Forecast - by Types
- 7.2.1. Single-color Reagent
- 7.2.2. Two-color Reagent
- 7.2.3. Multicolor Reagent
- 7.1. Market Analysis, Insights and Forecast - by Application
- 8. Europe flow cytometry reagents Analysis, Insights and Forecast, 2019-2031
- 8.1. Market Analysis, Insights and Forecast - by Application
- 8.1.1. Pharmaceutical & Biotechnological Companies
- 8.1.2. Academic & Research Institutes
- 8.1.3. Contract Research Organizations
- 8.1.4. Others
- 8.2. Market Analysis, Insights and Forecast - by Types
- 8.2.1. Single-color Reagent
- 8.2.2. Two-color Reagent
- 8.2.3. Multicolor Reagent
- 8.1. Market Analysis, Insights and Forecast - by Application
- 9. Middle East & Africa flow cytometry reagents Analysis, Insights and Forecast, 2019-2031
- 9.1. Market Analysis, Insights and Forecast - by Application
- 9.1.1. Pharmaceutical & Biotechnological Companies
- 9.1.2. Academic & Research Institutes
- 9.1.3. Contract Research Organizations
- 9.1.4. Others
- 9.2. Market Analysis, Insights and Forecast - by Types
- 9.2.1. Single-color Reagent
- 9.2.2. Two-color Reagent
- 9.2.3. Multicolor Reagent
- 9.1. Market Analysis, Insights and Forecast - by Application
- 10. Asia Pacific flow cytometry reagents Analysis, Insights and Forecast, 2019-2031
- 10.1. Market Analysis, Insights and Forecast - by Application
- 10.1.1. Pharmaceutical & Biotechnological Companies
- 10.1.2. Academic & Research Institutes
- 10.1.3. Contract Research Organizations
- 10.1.4. Others
- 10.2. Market Analysis, Insights and Forecast - by Types
- 10.2.1. Single-color Reagent
- 10.2.2. Two-color Reagent
- 10.2.3. Multicolor Reagent
- 10.1. Market Analysis, Insights and Forecast - by Application
- 11. Competitive Analysis
- 11.1. Global Market Share Analysis 2024
- 11.2. Company Profiles
- 11.2.1 Thermo Fisher Scientific
- 11.2.1.1. Overview
- 11.2.1.2. Products
- 11.2.1.3. SWOT Analysis
- 11.2.1.4. Recent Developments
- 11.2.1.5. Financials (Based on Availability)
- 11.2.2 Merck Millipore
- 11.2.2.1. Overview
- 11.2.2.2. Products
- 11.2.2.3. SWOT Analysis
- 11.2.2.4. Recent Developments
- 11.2.2.5. Financials (Based on Availability)
- 11.2.3 Danaher
- 11.2.3.1. Overview
- 11.2.3.2. Products
- 11.2.3.3. SWOT Analysis
- 11.2.3.4. Recent Developments
- 11.2.3.5. Financials (Based on Availability)
- 11.2.4 Siemens Healthcare
- 11.2.4.1. Overview
- 11.2.4.2. Products
- 11.2.4.3. SWOT Analysis
- 11.2.4.4. Recent Developments
- 11.2.4.5. Financials (Based on Availability)
- 11.2.5 Bio-Rad Laboratories
- 11.2.5.1. Overview
- 11.2.5.2. Products
- 11.2.5.3. SWOT Analysis
- 11.2.5.4. Recent Developments
- 11.2.5.5. Financials (Based on Availability)
- 11.2.6 Roche
- 11.2.6.1. Overview
- 11.2.6.2. Products
- 11.2.6.3. SWOT Analysis
- 11.2.6.4. Recent Developments
- 11.2.6.5. Financials (Based on Availability)
- 11.2.7 Sysmex
- 11.2.7.1. Overview
- 11.2.7.2. Products
- 11.2.7.3. SWOT Analysis
- 11.2.7.4. Recent Developments
- 11.2.7.5. Financials (Based on Availability)
- 11.2.8 PerkinElmer
- 11.2.8.1. Overview
- 11.2.8.2. Products
- 11.2.8.3. SWOT Analysis
- 11.2.8.4. Recent Developments
- 11.2.8.5. Financials (Based on Availability)
- 11.2.9 Abcam
- 11.2.9.1. Overview
- 11.2.9.2. Products
- 11.2.9.3. SWOT Analysis
- 11.2.9.4. Recent Developments
- 11.2.9.5. Financials (Based on Availability)
- 11.2.10 BD
- 11.2.10.1. Overview
- 11.2.10.2. Products
- 11.2.10.3. SWOT Analysis
- 11.2.10.4. Recent Developments
- 11.2.10.5. Financials (Based on Availability)
- 11.2.11 Agilent Technologies
- 11.2.11.1. Overview
- 11.2.11.2. Products
- 11.2.11.3. SWOT Analysis
- 11.2.11.4. Recent Developments
- 11.2.11.5. Financials (Based on Availability)
- 11.2.1 Thermo Fisher Scientific
List of Figures
- Figure 1: Global flow cytometry reagents Revenue Breakdown (million, %) by Region 2024 & 2032
- Figure 2: North America flow cytometry reagents Revenue (million), by Application 2024 & 2032
- Figure 3: North America flow cytometry reagents Revenue Share (%), by Application 2024 & 2032
- Figure 4: North America flow cytometry reagents Revenue (million), by Types 2024 & 2032
- Figure 5: North America flow cytometry reagents Revenue Share (%), by Types 2024 & 2032
- Figure 6: North America flow cytometry reagents Revenue (million), by Country 2024 & 2032
- Figure 7: North America flow cytometry reagents Revenue Share (%), by Country 2024 & 2032
- Figure 8: South America flow cytometry reagents Revenue (million), by Application 2024 & 2032
- Figure 9: South America flow cytometry reagents Revenue Share (%), by Application 2024 & 2032
- Figure 10: South America flow cytometry reagents Revenue (million), by Types 2024 & 2032
- Figure 11: South America flow cytometry reagents Revenue Share (%), by Types 2024 & 2032
- Figure 12: South America flow cytometry reagents Revenue (million), by Country 2024 & 2032
- Figure 13: South America flow cytometry reagents Revenue Share (%), by Country 2024 & 2032
- Figure 14: Europe flow cytometry reagents Revenue (million), by Application 2024 & 2032
- Figure 15: Europe flow cytometry reagents Revenue Share (%), by Application 2024 & 2032
- Figure 16: Europe flow cytometry reagents Revenue (million), by Types 2024 & 2032
- Figure 17: Europe flow cytometry reagents Revenue Share (%), by Types 2024 & 2032
- Figure 18: Europe flow cytometry reagents Revenue (million), by Country 2024 & 2032
- Figure 19: Europe flow cytometry reagents Revenue Share (%), by Country 2024 & 2032
- Figure 20: Middle East & Africa flow cytometry reagents Revenue (million), by Application 2024 & 2032
- Figure 21: Middle East & Africa flow cytometry reagents Revenue Share (%), by Application 2024 & 2032
- Figure 22: Middle East & Africa flow cytometry reagents Revenue (million), by Types 2024 & 2032
- Figure 23: Middle East & Africa flow cytometry reagents Revenue Share (%), by Types 2024 & 2032
- Figure 24: Middle East & Africa flow cytometry reagents Revenue (million), by Country 2024 & 2032
- Figure 25: Middle East & Africa flow cytometry reagents Revenue Share (%), by Country 2024 & 2032
- Figure 26: Asia Pacific flow cytometry reagents Revenue (million), by Application 2024 & 2032
- Figure 27: Asia Pacific flow cytometry reagents Revenue Share (%), by Application 2024 & 2032
- Figure 28: Asia Pacific flow cytometry reagents Revenue (million), by Types 2024 & 2032
- Figure 29: Asia Pacific flow cytometry reagents Revenue Share (%), by Types 2024 & 2032
- Figure 30: Asia Pacific flow cytometry reagents Revenue (million), by Country 2024 & 2032
- Figure 31: Asia Pacific flow cytometry reagents Revenue Share (%), by Country 2024 & 2032
List of Tables
- Table 1: Global flow cytometry reagents Revenue million Forecast, by Region 2019 & 2032
- Table 2: Global flow cytometry reagents Revenue million Forecast, by Application 2019 & 2032
- Table 3: Global flow cytometry reagents Revenue million Forecast, by Types 2019 & 2032
- Table 4: Global flow cytometry reagents Revenue million Forecast, by Region 2019 & 2032
- Table 5: Global flow cytometry reagents Revenue million Forecast, by Application 2019 & 2032
- Table 6: Global flow cytometry reagents Revenue million Forecast, by Types 2019 & 2032
- Table 7: Global flow cytometry reagents Revenue million Forecast, by Country 2019 & 2032
- Table 8: United States flow cytometry reagents Revenue (million) Forecast, by Application 2019 & 2032
- Table 9: Canada flow cytometry reagents Revenue (million) Forecast, by Application 2019 & 2032
- Table 10: Mexico flow cytometry reagents Revenue (million) Forecast, by Application 2019 & 2032
- Table 11: Global flow cytometry reagents Revenue million Forecast, by Application 2019 & 2032
- Table 12: Global flow cytometry reagents Revenue million Forecast, by Types 2019 & 2032
- Table 13: Global flow cytometry reagents Revenue million Forecast, by Country 2019 & 2032
- Table 14: Brazil flow cytometry reagents Revenue (million) Forecast, by Application 2019 & 2032
- Table 15: Argentina flow cytometry reagents Revenue (million) Forecast, by Application 2019 & 2032
- Table 16: Rest of South America flow cytometry reagents Revenue (million) Forecast, by Application 2019 & 2032
- Table 17: Global flow cytometry reagents Revenue million Forecast, by Application 2019 & 2032
- Table 18: Global flow cytometry reagents Revenue million Forecast, by Types 2019 & 2032
- Table 19: Global flow cytometry reagents Revenue million Forecast, by Country 2019 & 2032
- Table 20: United Kingdom flow cytometry reagents Revenue (million) Forecast, by Application 2019 & 2032
- Table 21: Germany flow cytometry reagents Revenue (million) Forecast, by Application 2019 & 2032
- Table 22: France flow cytometry reagents Revenue (million) Forecast, by Application 2019 & 2032
- Table 23: Italy flow cytometry reagents Revenue (million) Forecast, by Application 2019 & 2032
- Table 24: Spain flow cytometry reagents Revenue (million) Forecast, by Application 2019 & 2032
- Table 25: Russia flow cytometry reagents Revenue (million) Forecast, by Application 2019 & 2032
- Table 26: Benelux flow cytometry reagents Revenue (million) Forecast, by Application 2019 & 2032
- Table 27: Nordics flow cytometry reagents Revenue (million) Forecast, by Application 2019 & 2032
- Table 28: Rest of Europe flow cytometry reagents Revenue (million) Forecast, by Application 2019 & 2032
- Table 29: Global flow cytometry reagents Revenue million Forecast, by Application 2019 & 2032
- Table 30: Global flow cytometry reagents Revenue million Forecast, by Types 2019 & 2032
- Table 31: Global flow cytometry reagents Revenue million Forecast, by Country 2019 & 2032
- Table 32: Turkey flow cytometry reagents Revenue (million) Forecast, by Application 2019 & 2032
- Table 33: Israel flow cytometry reagents Revenue (million) Forecast, by Application 2019 & 2032
- Table 34: GCC flow cytometry reagents Revenue (million) Forecast, by Application 2019 & 2032
- Table 35: North Africa flow cytometry reagents Revenue (million) Forecast, by Application 2019 & 2032
- Table 36: South Africa flow cytometry reagents Revenue (million) Forecast, by Application 2019 & 2032
- Table 37: Rest of Middle East & Africa flow cytometry reagents Revenue (million) Forecast, by Application 2019 & 2032
- Table 38: Global flow cytometry reagents Revenue million Forecast, by Application 2019 & 2032
- Table 39: Global flow cytometry reagents Revenue million Forecast, by Types 2019 & 2032
- Table 40: Global flow cytometry reagents Revenue million Forecast, by Country 2019 & 2032
- Table 41: China flow cytometry reagents Revenue (million) Forecast, by Application 2019 & 2032
- Table 42: India flow cytometry reagents Revenue (million) Forecast, by Application 2019 & 2032
- Table 43: Japan flow cytometry reagents Revenue (million) Forecast, by Application 2019 & 2032
- Table 44: South Korea flow cytometry reagents Revenue (million) Forecast, by Application 2019 & 2032
- Table 45: ASEAN flow cytometry reagents Revenue (million) Forecast, by Application 2019 & 2032
- Table 46: Oceania flow cytometry reagents Revenue (million) Forecast, by Application 2019 & 2032
- Table 47: Rest of Asia Pacific flow cytometry reagents Revenue (million) Forecast, by Application 2019 & 2032
Frequently Asked Questions
1. What is the projected Compound Annual Growth Rate (CAGR) of the flow cytometry reagents?
The projected CAGR is approximately XX%.
2. Which companies are prominent players in the flow cytometry reagents?
Key companies in the market include Thermo Fisher Scientific, Merck Millipore, Danaher, Siemens Healthcare, Bio-Rad Laboratories, Roche, Sysmex, PerkinElmer, Abcam, BD, Agilent Technologies.
3. What are the main segments of the flow cytometry reagents?
The market segments include Application, Types.
4. Can you provide details about the market size?
The market size is estimated to be USD XXX million as of 2022.
5. What are some drivers contributing to market growth?
N/A
6. What are the notable trends driving market growth?
N/A
7. Are there any restraints impacting market growth?
N/A
8. Can you provide examples of recent developments in the market?
N/A
9. What pricing options are available for accessing the report?
Pricing options include single-user, multi-user, and enterprise licenses priced at USD 4350.00, USD 6525.00, and USD 8700.00 respectively.
10. Is the market size provided in terms of value or volume?
The market size is provided in terms of value, measured in million.
11. Are there any specific market keywords associated with the report?
Yes, the market keyword associated with the report is "flow cytometry reagents," which aids in identifying and referencing the specific market segment covered.
12. How do I determine which pricing option suits my needs best?
The pricing options vary based on user requirements and access needs. Individual users may opt for single-user licenses, while businesses requiring broader access may choose multi-user or enterprise licenses for cost-effective access to the report.
13. Are there any additional resources or data provided in the flow cytometry reagents report?
While the report offers comprehensive insights, it's advisable to review the specific contents or supplementary materials provided to ascertain if additional resources or data are available.
14. How can I stay updated on further developments or reports in the flow cytometry reagents?
To stay informed about further developments, trends, and reports in the flow cytometry reagents, consider subscribing to industry newsletters, following relevant companies and organizations, or regularly checking reputable industry news sources and publications.
Methodology
Step 1 - Identification of Relevant Samples Size from Population Database


Step 2 - Approaches for Defining Global Market Size (Value, Volume* & Price*)

Note*: In applicable scenarios
Step 3 - Data Sources
Primary Research
- Web Analytics
- Survey Reports
- Research Institute
- Latest Research Reports
- Opinion Leaders
Secondary Research
- Annual Reports
- White Paper
- Latest Press Release
- Industry Association
- Paid Database
- Investor Presentations

Step 4 - Data Triangulation
Involves using different sources of information in order to increase the validity of a study
These sources are likely to be stakeholders in a program - participants, other researchers, program staff, other community members, and so on.
Then we put all data in single framework & apply various statistical tools to find out the dynamic on the market.
During the analysis stage, feedback from the stakeholder groups would be compared to determine areas of agreement as well as areas of divergence
