

Key Insights
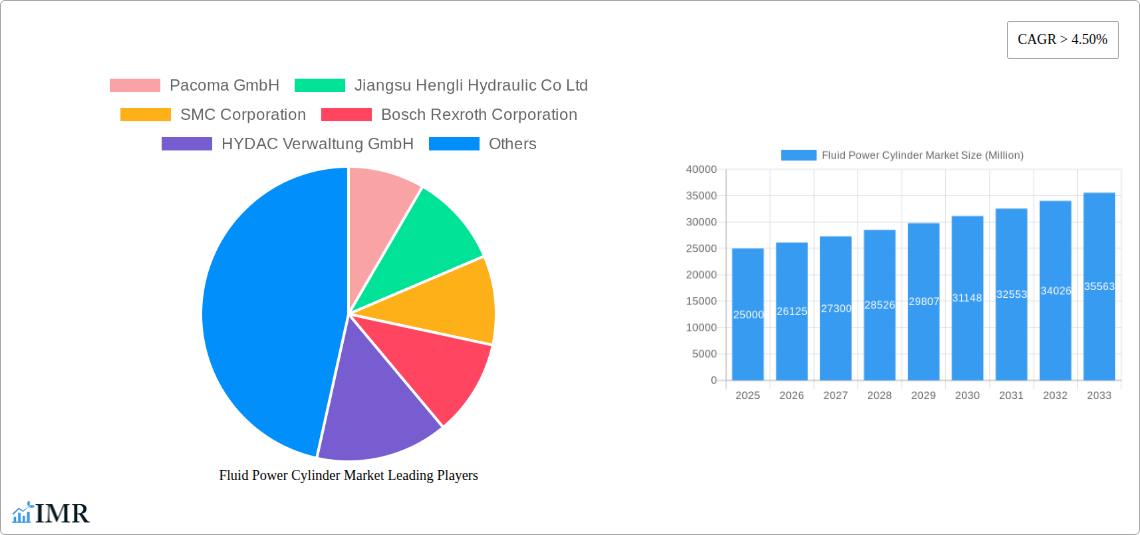
The global fluid power cylinder market is experiencing robust growth, driven by increasing industrial automation across diverse sectors. The market's Compound Annual Growth Rate (CAGR) exceeding 4.50% signifies a consistently expanding demand for these crucial components in machinery and equipment. This growth is fueled by several key factors, including the rising adoption of hydraulic and pneumatic systems in manufacturing, construction, and automotive industries. Advancements in cylinder design, such as the incorporation of more efficient and durable materials, and the integration of smart technologies for enhanced monitoring and control, further contribute to market expansion. The segmentation reveals a significant share held by hydraulic cylinders, likely reflecting their prevalence in heavy-duty applications. However, pneumatic cylinders are also witnessing notable growth, particularly in applications requiring faster cycle times and lower operating pressures. Geographically, North America and Europe currently hold substantial market shares, but the Asia-Pacific region is poised for significant expansion, driven by rapid industrialization and infrastructure development in countries like China and India. Competitive dynamics are characterized by both established players and regional manufacturers, leading to innovation and price competitiveness.
Despite the positive growth trajectory, the market faces certain challenges. Fluctuations in raw material prices, particularly for metals used in cylinder construction, can impact production costs and profitability. Moreover, the increasing focus on energy efficiency and sustainability presents both opportunities and challenges for the industry. Manufacturers are actively developing more energy-efficient cylinders and exploring the use of eco-friendly materials to meet evolving environmental regulations and customer preferences. This necessitates ongoing innovation and investment in research and development to remain competitive in a dynamic landscape. The long-term outlook remains optimistic, with continued growth projected throughout the forecast period (2025-2033), driven by ongoing industrialization, automation trends, and technological advancements. This makes the fluid power cylinder market an attractive sector for investors and businesses seeking long-term growth opportunities.
Fluid Power Cylinder Market: A Comprehensive Market Report (2019-2033)
This comprehensive report provides a detailed analysis of the Fluid Power Cylinder market, encompassing its dynamics, growth trends, regional dominance, product landscape, and key players. The study covers the period from 2019 to 2033, with 2025 as the base year and forecast extending to 2033. The market is segmented by type (Hydraulic Cylinder, Pneumatic Cylinder) and end-user industry (Hydraulic Cylinder, Pneumatic Cylinder in other industries), offering granular insights into this vital industrial sector. The report is valued at XX Million Units and is expected to reach XX Million Units by 2033.
Fluid Power Cylinder Market Dynamics & Structure
The Fluid Power Cylinder market is characterized by moderate concentration, with key players holding significant market share. Technological innovation, particularly in areas like smart cylinders and improved efficiency, is a major driver. Stringent regulatory frameworks concerning safety and environmental impact influence market dynamics. Competitive pressures from substitute technologies like electric actuators are evident, but the robustness and reliability of fluid power cylinders continue to secure market dominance in many applications. End-user demographics, heavily reliant on manufacturing and industrial automation, significantly shape demand. Mergers and acquisitions (M&A) activity in the sector, while not extremely frequent, plays a role in reshaping the competitive landscape.
- Market Concentration: Moderately concentrated, with top 10 players holding approximately xx% of the market share in 2025.
- Technological Innovation: Focus on energy efficiency, smart functionalities, and improved durability drive product development.
- Regulatory Framework: Safety standards and environmental regulations influence design and manufacturing processes.
- Competitive Substitutes: Electric actuators and other electromechanical systems pose a competitive threat, particularly in specific niche applications.
- End-User Demographics: Heavily reliant on the manufacturing, construction, and automotive industries.
- M&A Trends: Moderate M&A activity observed over the past five years, with approximately xx deals completed (2019-2024).
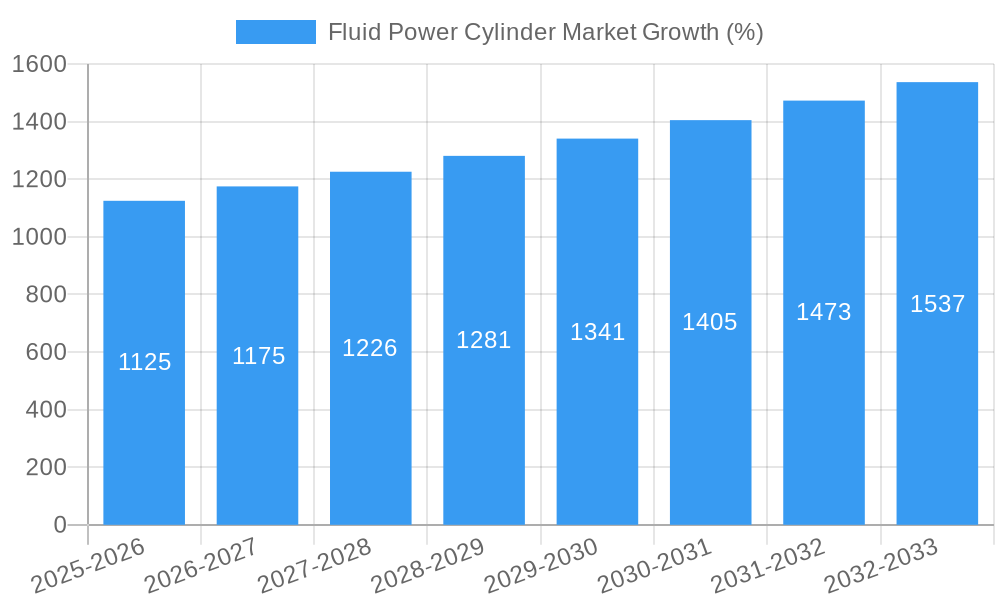
Fluid Power Cylinder Market Growth Trends & Insights
The Fluid Power Cylinder market witnessed steady growth during the historical period (2019-2024), driven by robust demand from key end-user industries. The market size expanded from XX Million Units in 2019 to XX Million Units in 2024, registering a CAGR of xx%. This growth is expected to continue, although at a slightly moderated pace, during the forecast period (2025-2033), with a projected CAGR of xx%, reaching XX Million Units by 2033. Technological disruptions, such as the integration of IoT sensors and advanced control systems in cylinders, are accelerating adoption rates, particularly in applications requiring precise control and enhanced monitoring capabilities. A shift towards automation across various industrial sectors further fuels market expansion. Consumer behavior, influenced by efficiency and sustainability concerns, is driving demand for energy-efficient and environmentally friendly cylinder designs.
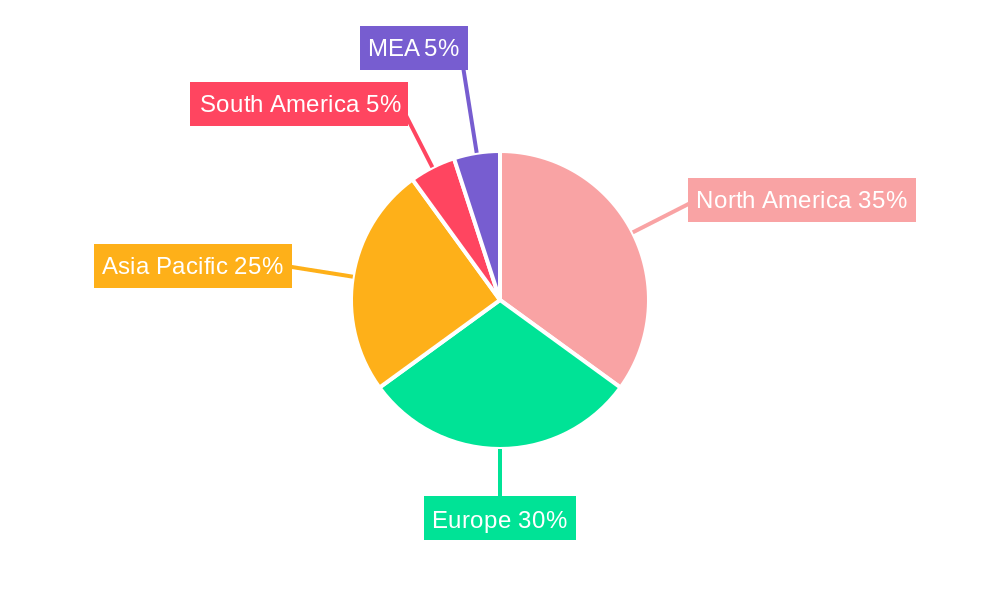
Dominant Regions, Countries, or Segments in Fluid Power Cylinder Market
North America and Europe currently hold the largest market shares in the fluid power cylinder market, driven by established industrial bases and high adoption rates in automation. Within the segment breakdown, the Hydraulic Cylinder segment dominates by volume, particularly in heavy machinery and industrial automation applications. Asia-Pacific is witnessing significant growth, fueled by rapid industrialization and infrastructure development.
- Key Drivers in North America: High levels of automation in manufacturing, robust industrial output, and favorable economic conditions.
- Key Drivers in Europe: Focus on energy efficiency and sustainability, coupled with advancements in industrial automation technologies.
- Key Drivers in Asia-Pacific: Rapid industrialization, infrastructure development, and growing demand from automotive and construction sectors.
- Hydraulic Cylinder Segment Dominance: High demand in heavy machinery, construction, and industrial automation.
- Pneumatic Cylinder Growth: Driven by increasing automation in light manufacturing and packaging industries.
Fluid Power Cylinder Market Product Landscape
Fluid power cylinders are continually evolving, incorporating advanced features like integrated sensors, improved sealing technologies, and enhanced durability. These innovations are targeted at specific applications, focusing on improved efficiency, reliability, and maintenance reduction. Unique selling propositions revolve around customized solutions, superior performance metrics, and reduced total cost of ownership. Recent technological advancements have centered on smart cylinder technologies, incorporating advanced control systems and data analytics capabilities for predictive maintenance and optimized performance.
Key Drivers, Barriers & Challenges in Fluid Power Cylinder Market
Key Drivers: Growing automation across industries, rising demand from emerging economies, and ongoing technological advancements in cylinder design and manufacturing. Government initiatives promoting industrial automation further accelerate market growth.
Key Challenges: Fluctuations in raw material prices, supply chain disruptions, and increasing competitive pressure from alternative technologies like electric actuators. Stringent safety and environmental regulations impose additional manufacturing costs and design complexities. Competition from manufacturers in low-cost regions also represents a significant challenge.
Emerging Opportunities in Fluid Power Cylinder Market
Emerging opportunities lie in the integration of smart technologies, creating a demand for digitally enabled cylinders that provide real-time data and predictive maintenance capabilities. Expansion into untapped markets in developing economies presents considerable growth potential. Further innovation in lightweight and energy-efficient cylinder designs will capitalize on increasing sustainability concerns. The adoption of advanced materials for improved durability and performance is also opening new avenues for growth.
Growth Accelerators in the Fluid Power Cylinder Market Industry
Technological breakthroughs, such as the development of smart cylinders and advanced control systems, are significant catalysts. Strategic partnerships and collaborations between cylinder manufacturers and automation system integrators are creating synergistic growth opportunities. Market expansion strategies focusing on emerging markets and new applications further accelerate market expansion.
Key Players Shaping the Fluid Power Cylinder Market Market
- Pacoma GmbH
- Jiangsu Hengli Hydraulic Co Ltd
- SMC Corporation
- Bosch Rexroth Corporation
- HYDAC Verwaltung GmbH
- Eaton Corporation PLC
- Precision Hydraulic Cylinders Inc
- Festo SE & Co KG
- Danfoss A/S
- Parker Hannifin Corp
Notable Milestones in Fluid Power Cylinder Market Sector
- 2021 (Q3): Bosch Rexroth launches a new line of smart hydraulic cylinders with integrated sensors.
- 2022 (Q1): SMC Corporation announces a strategic partnership with an automation solutions provider.
- 2023 (Q2): Parker Hannifin acquires a smaller competitor, expanding its market presence.
- (Further milestones can be added as available)
In-Depth Fluid Power Cylinder Market Market Outlook
The future of the Fluid Power Cylinder market is promising, driven by continuous technological advancements, increased automation across various sectors, and expansion into new applications. Strategic partnerships and investments in R&D will further accelerate growth. Companies that focus on developing energy-efficient, smart, and customized solutions will be best positioned to capitalize on the market's potential.
Fluid Power Cylinder Market Segmentation
-
1. Type
- 1.1. Hydraulic Cylinder
- 1.2. Pneumatic Cylinder
-
2. End-user Industry
-
2.1. Hydraulic Cylinder
- 2.1.1. Construction
- 2.1.2. Agriculture
- 2.1.3. Material Handling
- 2.1.4. Aerospace & Defense
- 2.1.5. Machine Tools
- 2.1.6. Oil & Gas
- 2.1.7. Other End-user Industries
-
2.2. Pneumatic Cylinder
- 2.2.1. Food Processing & Packaging
- 2.2.2. Automotive
- 2.2.3. Material Handling & Assembly
- 2.2.4. Oil & Gas, Chemicals and Plastics
- 2.2.5. Semiconductor & Electronics
- 2.2.6. Life Sciences
-
2.1. Hydraulic Cylinder
Fluid Power Cylinder Market Segmentation By Geography
-
1. North America
- 1.1. United States
- 1.2. Canada
-
2. Europe
- 2.1. Germany
- 2.2. United Kingdom
- 2.3. France
- 2.4. Rest of Europe
-
3. Asia Pacific
- 3.1. India
- 3.2. China
- 3.3. Japan
- 3.4. Rest of Asia Pacifc
- 4. Latin America
- 5. Middle East
Fluid Power Cylinder Market REPORT HIGHLIGHTS
| Aspects | Details |
|---|---|
| Study Period | 2019-2033 |
| Base Year | 2024 |
| Estimated Year | 2025 |
| Forecast Period | 2025-2033 |
| Historical Period | 2019-2024 |
| Growth Rate | CAGR of > 4.50% from 2019-2033 |
| Segmentation |
|
Table of Contents
- 1. Introduction
- 1.1. Research Scope
- 1.2. Market Segmentation
- 1.3. Research Methodology
- 1.4. Definitions and Assumptions
- 2. Executive Summary
- 2.1. Introduction
- 3. Market Dynamics
- 3.1. Introduction
- 3.2. Market Drivers
- 3.2.1. ; Increasing Demand for Material Handling Equipment
- 3.3. Market Restrains
- 3.3.1. ; High Cost of Maintenance of the Cylinders Over the Entire Lifespan
- 3.4. Market Trends
- 3.4.1. Hydraulic Cylinders to Hold Major Share
- 4. Market Factor Analysis
- 4.1. Porters Five Forces
- 4.2. Supply/Value Chain
- 4.3. PESTEL analysis
- 4.4. Market Entropy
- 4.5. Patent/Trademark Analysis
- 5. Global Fluid Power Cylinder Market Analysis, Insights and Forecast, 2019-2031
- 5.1. Market Analysis, Insights and Forecast - by Type
- 5.1.1. Hydraulic Cylinder
- 5.1.2. Pneumatic Cylinder
- 5.2. Market Analysis, Insights and Forecast - by End-user Industry
- 5.2.1. Hydraulic Cylinder
- 5.2.1.1. Construction
- 5.2.1.2. Agriculture
- 5.2.1.3. Material Handling
- 5.2.1.4. Aerospace & Defense
- 5.2.1.5. Machine Tools
- 5.2.1.6. Oil & Gas
- 5.2.1.7. Other End-user Industries
- 5.2.2. Pneumatic Cylinder
- 5.2.2.1. Food Processing & Packaging
- 5.2.2.2. Automotive
- 5.2.2.3. Material Handling & Assembly
- 5.2.2.4. Oil & Gas, Chemicals and Plastics
- 5.2.2.5. Semiconductor & Electronics
- 5.2.2.6. Life Sciences
- 5.2.1. Hydraulic Cylinder
- 5.3. Market Analysis, Insights and Forecast - by Region
- 5.3.1. North America
- 5.3.2. Europe
- 5.3.3. Asia Pacific
- 5.3.4. Latin America
- 5.3.5. Middle East
- 5.1. Market Analysis, Insights and Forecast - by Type
- 6. North America Fluid Power Cylinder Market Analysis, Insights and Forecast, 2019-2031
- 6.1. Market Analysis, Insights and Forecast - by Type
- 6.1.1. Hydraulic Cylinder
- 6.1.2. Pneumatic Cylinder
- 6.2. Market Analysis, Insights and Forecast - by End-user Industry
- 6.2.1. Hydraulic Cylinder
- 6.2.1.1. Construction
- 6.2.1.2. Agriculture
- 6.2.1.3. Material Handling
- 6.2.1.4. Aerospace & Defense
- 6.2.1.5. Machine Tools
- 6.2.1.6. Oil & Gas
- 6.2.1.7. Other End-user Industries
- 6.2.2. Pneumatic Cylinder
- 6.2.2.1. Food Processing & Packaging
- 6.2.2.2. Automotive
- 6.2.2.3. Material Handling & Assembly
- 6.2.2.4. Oil & Gas, Chemicals and Plastics
- 6.2.2.5. Semiconductor & Electronics
- 6.2.2.6. Life Sciences
- 6.2.1. Hydraulic Cylinder
- 6.1. Market Analysis, Insights and Forecast - by Type
- 7. Europe Fluid Power Cylinder Market Analysis, Insights and Forecast, 2019-2031
- 7.1. Market Analysis, Insights and Forecast - by Type
- 7.1.1. Hydraulic Cylinder
- 7.1.2. Pneumatic Cylinder
- 7.2. Market Analysis, Insights and Forecast - by End-user Industry
- 7.2.1. Hydraulic Cylinder
- 7.2.1.1. Construction
- 7.2.1.2. Agriculture
- 7.2.1.3. Material Handling
- 7.2.1.4. Aerospace & Defense
- 7.2.1.5. Machine Tools
- 7.2.1.6. Oil & Gas
- 7.2.1.7. Other End-user Industries
- 7.2.2. Pneumatic Cylinder
- 7.2.2.1. Food Processing & Packaging
- 7.2.2.2. Automotive
- 7.2.2.3. Material Handling & Assembly
- 7.2.2.4. Oil & Gas, Chemicals and Plastics
- 7.2.2.5. Semiconductor & Electronics
- 7.2.2.6. Life Sciences
- 7.2.1. Hydraulic Cylinder
- 7.1. Market Analysis, Insights and Forecast - by Type
- 8. Asia Pacific Fluid Power Cylinder Market Analysis, Insights and Forecast, 2019-2031
- 8.1. Market Analysis, Insights and Forecast - by Type
- 8.1.1. Hydraulic Cylinder
- 8.1.2. Pneumatic Cylinder
- 8.2. Market Analysis, Insights and Forecast - by End-user Industry
- 8.2.1. Hydraulic Cylinder
- 8.2.1.1. Construction
- 8.2.1.2. Agriculture
- 8.2.1.3. Material Handling
- 8.2.1.4. Aerospace & Defense
- 8.2.1.5. Machine Tools
- 8.2.1.6. Oil & Gas
- 8.2.1.7. Other End-user Industries
- 8.2.2. Pneumatic Cylinder
- 8.2.2.1. Food Processing & Packaging
- 8.2.2.2. Automotive
- 8.2.2.3. Material Handling & Assembly
- 8.2.2.4. Oil & Gas, Chemicals and Plastics
- 8.2.2.5. Semiconductor & Electronics
- 8.2.2.6. Life Sciences
- 8.2.1. Hydraulic Cylinder
- 8.1. Market Analysis, Insights and Forecast - by Type
- 9. Latin America Fluid Power Cylinder Market Analysis, Insights and Forecast, 2019-2031
- 9.1. Market Analysis, Insights and Forecast - by Type
- 9.1.1. Hydraulic Cylinder
- 9.1.2. Pneumatic Cylinder
- 9.2. Market Analysis, Insights and Forecast - by End-user Industry
- 9.2.1. Hydraulic Cylinder
- 9.2.1.1. Construction
- 9.2.1.2. Agriculture
- 9.2.1.3. Material Handling
- 9.2.1.4. Aerospace & Defense
- 9.2.1.5. Machine Tools
- 9.2.1.6. Oil & Gas
- 9.2.1.7. Other End-user Industries
- 9.2.2. Pneumatic Cylinder
- 9.2.2.1. Food Processing & Packaging
- 9.2.2.2. Automotive
- 9.2.2.3. Material Handling & Assembly
- 9.2.2.4. Oil & Gas, Chemicals and Plastics
- 9.2.2.5. Semiconductor & Electronics
- 9.2.2.6. Life Sciences
- 9.2.1. Hydraulic Cylinder
- 9.1. Market Analysis, Insights and Forecast - by Type
- 10. Middle East Fluid Power Cylinder Market Analysis, Insights and Forecast, 2019-2031
- 10.1. Market Analysis, Insights and Forecast - by Type
- 10.1.1. Hydraulic Cylinder
- 10.1.2. Pneumatic Cylinder
- 10.2. Market Analysis, Insights and Forecast - by End-user Industry
- 10.2.1. Hydraulic Cylinder
- 10.2.1.1. Construction
- 10.2.1.2. Agriculture
- 10.2.1.3. Material Handling
- 10.2.1.4. Aerospace & Defense
- 10.2.1.5. Machine Tools
- 10.2.1.6. Oil & Gas
- 10.2.1.7. Other End-user Industries
- 10.2.2. Pneumatic Cylinder
- 10.2.2.1. Food Processing & Packaging
- 10.2.2.2. Automotive
- 10.2.2.3. Material Handling & Assembly
- 10.2.2.4. Oil & Gas, Chemicals and Plastics
- 10.2.2.5. Semiconductor & Electronics
- 10.2.2.6. Life Sciences
- 10.2.1. Hydraulic Cylinder
- 10.1. Market Analysis, Insights and Forecast - by Type
- 11. North America Fluid Power Cylinder Market Analysis, Insights and Forecast, 2019-2031
- 11.1. Market Analysis, Insights and Forecast - By Country/Sub-region
- 11.1.1 United States
- 11.1.2 Canada
- 11.1.3 Mexico
- 12. Europe Fluid Power Cylinder Market Analysis, Insights and Forecast, 2019-2031
- 12.1. Market Analysis, Insights and Forecast - By Country/Sub-region
- 12.1.1 Germany
- 12.1.2 United Kingdom
- 12.1.3 France
- 12.1.4 Spain
- 12.1.5 Italy
- 12.1.6 Spain
- 12.1.7 Belgium
- 12.1.8 Netherland
- 12.1.9 Nordics
- 12.1.10 Rest of Europe
- 13. Asia Pacific Fluid Power Cylinder Market Analysis, Insights and Forecast, 2019-2031
- 13.1. Market Analysis, Insights and Forecast - By Country/Sub-region
- 13.1.1 China
- 13.1.2 Japan
- 13.1.3 India
- 13.1.4 South Korea
- 13.1.5 Southeast Asia
- 13.1.6 Australia
- 13.1.7 Indonesia
- 13.1.8 Phillipes
- 13.1.9 Singapore
- 13.1.10 Thailandc
- 13.1.11 Rest of Asia Pacific
- 14. South America Fluid Power Cylinder Market Analysis, Insights and Forecast, 2019-2031
- 14.1. Market Analysis, Insights and Forecast - By Country/Sub-region
- 14.1.1 Brazil
- 14.1.2 Argentina
- 14.1.3 Peru
- 14.1.4 Chile
- 14.1.5 Colombia
- 14.1.6 Ecuador
- 14.1.7 Venezuela
- 14.1.8 Rest of South America
- 15. North America Fluid Power Cylinder Market Analysis, Insights and Forecast, 2019-2031
- 15.1. Market Analysis, Insights and Forecast - By Country/Sub-region
- 15.1.1 United States
- 15.1.2 Canada
- 15.1.3 Mexico
- 16. MEA Fluid Power Cylinder Market Analysis, Insights and Forecast, 2019-2031
- 16.1. Market Analysis, Insights and Forecast - By Country/Sub-region
- 16.1.1 United Arab Emirates
- 16.1.2 Saudi Arabia
- 16.1.3 South Africa
- 16.1.4 Rest of Middle East and Africa
- 17. Competitive Analysis
- 17.1. Global Market Share Analysis 2024
- 17.2. Company Profiles
- 17.2.1 Pacoma GmbH
- 17.2.1.1. Overview
- 17.2.1.2. Products
- 17.2.1.3. SWOT Analysis
- 17.2.1.4. Recent Developments
- 17.2.1.5. Financials (Based on Availability)
- 17.2.2 Jiangsu Hengli Hydraulic Co Ltd
- 17.2.2.1. Overview
- 17.2.2.2. Products
- 17.2.2.3. SWOT Analysis
- 17.2.2.4. Recent Developments
- 17.2.2.5. Financials (Based on Availability)
- 17.2.3 SMC Corporation
- 17.2.3.1. Overview
- 17.2.3.2. Products
- 17.2.3.3. SWOT Analysis
- 17.2.3.4. Recent Developments
- 17.2.3.5. Financials (Based on Availability)
- 17.2.4 Bosch Rexroth Corporation
- 17.2.4.1. Overview
- 17.2.4.2. Products
- 17.2.4.3. SWOT Analysis
- 17.2.4.4. Recent Developments
- 17.2.4.5. Financials (Based on Availability)
- 17.2.5 HYDAC Verwaltung GmbH
- 17.2.5.1. Overview
- 17.2.5.2. Products
- 17.2.5.3. SWOT Analysis
- 17.2.5.4. Recent Developments
- 17.2.5.5. Financials (Based on Availability)
- 17.2.6 Eaton Corporation PLC
- 17.2.6.1. Overview
- 17.2.6.2. Products
- 17.2.6.3. SWOT Analysis
- 17.2.6.4. Recent Developments
- 17.2.6.5. Financials (Based on Availability)
- 17.2.7 Precision Hydraulic Cylinders Inc
- 17.2.7.1. Overview
- 17.2.7.2. Products
- 17.2.7.3. SWOT Analysis
- 17.2.7.4. Recent Developments
- 17.2.7.5. Financials (Based on Availability)
- 17.2.8 Festo SE & Co KG
- 17.2.8.1. Overview
- 17.2.8.2. Products
- 17.2.8.3. SWOT Analysis
- 17.2.8.4. Recent Developments
- 17.2.8.5. Financials (Based on Availability)
- 17.2.9 Danfoss A/S
- 17.2.9.1. Overview
- 17.2.9.2. Products
- 17.2.9.3. SWOT Analysis
- 17.2.9.4. Recent Developments
- 17.2.9.5. Financials (Based on Availability)
- 17.2.10 Parker Hannifin Corp
- 17.2.10.1. Overview
- 17.2.10.2. Products
- 17.2.10.3. SWOT Analysis
- 17.2.10.4. Recent Developments
- 17.2.10.5. Financials (Based on Availability)
- 17.2.1 Pacoma GmbH
List of Figures
- Figure 1: Global Fluid Power Cylinder Market Revenue Breakdown (Million, %) by Region 2024 & 2032
- Figure 2: Global Fluid Power Cylinder Market Volume Breakdown (K Unit, %) by Region 2024 & 2032
- Figure 3: North America Fluid Power Cylinder Market Revenue (Million), by Country 2024 & 2032
- Figure 4: North America Fluid Power Cylinder Market Volume (K Unit), by Country 2024 & 2032
- Figure 5: North America Fluid Power Cylinder Market Revenue Share (%), by Country 2024 & 2032
- Figure 6: North America Fluid Power Cylinder Market Volume Share (%), by Country 2024 & 2032
- Figure 7: Europe Fluid Power Cylinder Market Revenue (Million), by Country 2024 & 2032
- Figure 8: Europe Fluid Power Cylinder Market Volume (K Unit), by Country 2024 & 2032
- Figure 9: Europe Fluid Power Cylinder Market Revenue Share (%), by Country 2024 & 2032
- Figure 10: Europe Fluid Power Cylinder Market Volume Share (%), by Country 2024 & 2032
- Figure 11: Asia Pacific Fluid Power Cylinder Market Revenue (Million), by Country 2024 & 2032
- Figure 12: Asia Pacific Fluid Power Cylinder Market Volume (K Unit), by Country 2024 & 2032
- Figure 13: Asia Pacific Fluid Power Cylinder Market Revenue Share (%), by Country 2024 & 2032
- Figure 14: Asia Pacific Fluid Power Cylinder Market Volume Share (%), by Country 2024 & 2032
- Figure 15: South America Fluid Power Cylinder Market Revenue (Million), by Country 2024 & 2032
- Figure 16: South America Fluid Power Cylinder Market Volume (K Unit), by Country 2024 & 2032
- Figure 17: South America Fluid Power Cylinder Market Revenue Share (%), by Country 2024 & 2032
- Figure 18: South America Fluid Power Cylinder Market Volume Share (%), by Country 2024 & 2032
- Figure 19: North America Fluid Power Cylinder Market Revenue (Million), by Country 2024 & 2032
- Figure 20: North America Fluid Power Cylinder Market Volume (K Unit), by Country 2024 & 2032
- Figure 21: North America Fluid Power Cylinder Market Revenue Share (%), by Country 2024 & 2032
- Figure 22: North America Fluid Power Cylinder Market Volume Share (%), by Country 2024 & 2032
- Figure 23: MEA Fluid Power Cylinder Market Revenue (Million), by Country 2024 & 2032
- Figure 24: MEA Fluid Power Cylinder Market Volume (K Unit), by Country 2024 & 2032
- Figure 25: MEA Fluid Power Cylinder Market Revenue Share (%), by Country 2024 & 2032
- Figure 26: MEA Fluid Power Cylinder Market Volume Share (%), by Country 2024 & 2032
- Figure 27: North America Fluid Power Cylinder Market Revenue (Million), by Type 2024 & 2032
- Figure 28: North America Fluid Power Cylinder Market Volume (K Unit), by Type 2024 & 2032
- Figure 29: North America Fluid Power Cylinder Market Revenue Share (%), by Type 2024 & 2032
- Figure 30: North America Fluid Power Cylinder Market Volume Share (%), by Type 2024 & 2032
- Figure 31: North America Fluid Power Cylinder Market Revenue (Million), by End-user Industry 2024 & 2032
- Figure 32: North America Fluid Power Cylinder Market Volume (K Unit), by End-user Industry 2024 & 2032
- Figure 33: North America Fluid Power Cylinder Market Revenue Share (%), by End-user Industry 2024 & 2032
- Figure 34: North America Fluid Power Cylinder Market Volume Share (%), by End-user Industry 2024 & 2032
- Figure 35: North America Fluid Power Cylinder Market Revenue (Million), by Country 2024 & 2032
- Figure 36: North America Fluid Power Cylinder Market Volume (K Unit), by Country 2024 & 2032
- Figure 37: North America Fluid Power Cylinder Market Revenue Share (%), by Country 2024 & 2032
- Figure 38: North America Fluid Power Cylinder Market Volume Share (%), by Country 2024 & 2032
- Figure 39: Europe Fluid Power Cylinder Market Revenue (Million), by Type 2024 & 2032
- Figure 40: Europe Fluid Power Cylinder Market Volume (K Unit), by Type 2024 & 2032
- Figure 41: Europe Fluid Power Cylinder Market Revenue Share (%), by Type 2024 & 2032
- Figure 42: Europe Fluid Power Cylinder Market Volume Share (%), by Type 2024 & 2032
- Figure 43: Europe Fluid Power Cylinder Market Revenue (Million), by End-user Industry 2024 & 2032
- Figure 44: Europe Fluid Power Cylinder Market Volume (K Unit), by End-user Industry 2024 & 2032
- Figure 45: Europe Fluid Power Cylinder Market Revenue Share (%), by End-user Industry 2024 & 2032
- Figure 46: Europe Fluid Power Cylinder Market Volume Share (%), by End-user Industry 2024 & 2032
- Figure 47: Europe Fluid Power Cylinder Market Revenue (Million), by Country 2024 & 2032
- Figure 48: Europe Fluid Power Cylinder Market Volume (K Unit), by Country 2024 & 2032
- Figure 49: Europe Fluid Power Cylinder Market Revenue Share (%), by Country 2024 & 2032
- Figure 50: Europe Fluid Power Cylinder Market Volume Share (%), by Country 2024 & 2032
- Figure 51: Asia Pacific Fluid Power Cylinder Market Revenue (Million), by Type 2024 & 2032
- Figure 52: Asia Pacific Fluid Power Cylinder Market Volume (K Unit), by Type 2024 & 2032
- Figure 53: Asia Pacific Fluid Power Cylinder Market Revenue Share (%), by Type 2024 & 2032
- Figure 54: Asia Pacific Fluid Power Cylinder Market Volume Share (%), by Type 2024 & 2032
- Figure 55: Asia Pacific Fluid Power Cylinder Market Revenue (Million), by End-user Industry 2024 & 2032
- Figure 56: Asia Pacific Fluid Power Cylinder Market Volume (K Unit), by End-user Industry 2024 & 2032
- Figure 57: Asia Pacific Fluid Power Cylinder Market Revenue Share (%), by End-user Industry 2024 & 2032
- Figure 58: Asia Pacific Fluid Power Cylinder Market Volume Share (%), by End-user Industry 2024 & 2032
- Figure 59: Asia Pacific Fluid Power Cylinder Market Revenue (Million), by Country 2024 & 2032
- Figure 60: Asia Pacific Fluid Power Cylinder Market Volume (K Unit), by Country 2024 & 2032
- Figure 61: Asia Pacific Fluid Power Cylinder Market Revenue Share (%), by Country 2024 & 2032
- Figure 62: Asia Pacific Fluid Power Cylinder Market Volume Share (%), by Country 2024 & 2032
- Figure 63: Latin America Fluid Power Cylinder Market Revenue (Million), by Type 2024 & 2032
- Figure 64: Latin America Fluid Power Cylinder Market Volume (K Unit), by Type 2024 & 2032
- Figure 65: Latin America Fluid Power Cylinder Market Revenue Share (%), by Type 2024 & 2032
- Figure 66: Latin America Fluid Power Cylinder Market Volume Share (%), by Type 2024 & 2032
- Figure 67: Latin America Fluid Power Cylinder Market Revenue (Million), by End-user Industry 2024 & 2032
- Figure 68: Latin America Fluid Power Cylinder Market Volume (K Unit), by End-user Industry 2024 & 2032
- Figure 69: Latin America Fluid Power Cylinder Market Revenue Share (%), by End-user Industry 2024 & 2032
- Figure 70: Latin America Fluid Power Cylinder Market Volume Share (%), by End-user Industry 2024 & 2032
- Figure 71: Latin America Fluid Power Cylinder Market Revenue (Million), by Country 2024 & 2032
- Figure 72: Latin America Fluid Power Cylinder Market Volume (K Unit), by Country 2024 & 2032
- Figure 73: Latin America Fluid Power Cylinder Market Revenue Share (%), by Country 2024 & 2032
- Figure 74: Latin America Fluid Power Cylinder Market Volume Share (%), by Country 2024 & 2032
- Figure 75: Middle East Fluid Power Cylinder Market Revenue (Million), by Type 2024 & 2032
- Figure 76: Middle East Fluid Power Cylinder Market Volume (K Unit), by Type 2024 & 2032
- Figure 77: Middle East Fluid Power Cylinder Market Revenue Share (%), by Type 2024 & 2032
- Figure 78: Middle East Fluid Power Cylinder Market Volume Share (%), by Type 2024 & 2032
- Figure 79: Middle East Fluid Power Cylinder Market Revenue (Million), by End-user Industry 2024 & 2032
- Figure 80: Middle East Fluid Power Cylinder Market Volume (K Unit), by End-user Industry 2024 & 2032
- Figure 81: Middle East Fluid Power Cylinder Market Revenue Share (%), by End-user Industry 2024 & 2032
- Figure 82: Middle East Fluid Power Cylinder Market Volume Share (%), by End-user Industry 2024 & 2032
- Figure 83: Middle East Fluid Power Cylinder Market Revenue (Million), by Country 2024 & 2032
- Figure 84: Middle East Fluid Power Cylinder Market Volume (K Unit), by Country 2024 & 2032
- Figure 85: Middle East Fluid Power Cylinder Market Revenue Share (%), by Country 2024 & 2032
- Figure 86: Middle East Fluid Power Cylinder Market Volume Share (%), by Country 2024 & 2032
List of Tables
- Table 1: Global Fluid Power Cylinder Market Revenue Million Forecast, by Region 2019 & 2032
- Table 2: Global Fluid Power Cylinder Market Volume K Unit Forecast, by Region 2019 & 2032
- Table 3: Global Fluid Power Cylinder Market Revenue Million Forecast, by Type 2019 & 2032
- Table 4: Global Fluid Power Cylinder Market Volume K Unit Forecast, by Type 2019 & 2032
- Table 5: Global Fluid Power Cylinder Market Revenue Million Forecast, by End-user Industry 2019 & 2032
- Table 6: Global Fluid Power Cylinder Market Volume K Unit Forecast, by End-user Industry 2019 & 2032
- Table 7: Global Fluid Power Cylinder Market Revenue Million Forecast, by Region 2019 & 2032
- Table 8: Global Fluid Power Cylinder Market Volume K Unit Forecast, by Region 2019 & 2032
- Table 9: Global Fluid Power Cylinder Market Revenue Million Forecast, by Country 2019 & 2032
- Table 10: Global Fluid Power Cylinder Market Volume K Unit Forecast, by Country 2019 & 2032
- Table 11: United States Fluid Power Cylinder Market Revenue (Million) Forecast, by Application 2019 & 2032
- Table 12: United States Fluid Power Cylinder Market Volume (K Unit) Forecast, by Application 2019 & 2032
- Table 13: Canada Fluid Power Cylinder Market Revenue (Million) Forecast, by Application 2019 & 2032
- Table 14: Canada Fluid Power Cylinder Market Volume (K Unit) Forecast, by Application 2019 & 2032
- Table 15: Mexico Fluid Power Cylinder Market Revenue (Million) Forecast, by Application 2019 & 2032
- Table 16: Mexico Fluid Power Cylinder Market Volume (K Unit) Forecast, by Application 2019 & 2032
- Table 17: Global Fluid Power Cylinder Market Revenue Million Forecast, by Country 2019 & 2032
- Table 18: Global Fluid Power Cylinder Market Volume K Unit Forecast, by Country 2019 & 2032
- Table 19: Germany Fluid Power Cylinder Market Revenue (Million) Forecast, by Application 2019 & 2032
- Table 20: Germany Fluid Power Cylinder Market Volume (K Unit) Forecast, by Application 2019 & 2032
- Table 21: United Kingdom Fluid Power Cylinder Market Revenue (Million) Forecast, by Application 2019 & 2032
- Table 22: United Kingdom Fluid Power Cylinder Market Volume (K Unit) Forecast, by Application 2019 & 2032
- Table 23: France Fluid Power Cylinder Market Revenue (Million) Forecast, by Application 2019 & 2032
- Table 24: France Fluid Power Cylinder Market Volume (K Unit) Forecast, by Application 2019 & 2032
- Table 25: Spain Fluid Power Cylinder Market Revenue (Million) Forecast, by Application 2019 & 2032
- Table 26: Spain Fluid Power Cylinder Market Volume (K Unit) Forecast, by Application 2019 & 2032
- Table 27: Italy Fluid Power Cylinder Market Revenue (Million) Forecast, by Application 2019 & 2032
- Table 28: Italy Fluid Power Cylinder Market Volume (K Unit) Forecast, by Application 2019 & 2032
- Table 29: Spain Fluid Power Cylinder Market Revenue (Million) Forecast, by Application 2019 & 2032
- Table 30: Spain Fluid Power Cylinder Market Volume (K Unit) Forecast, by Application 2019 & 2032
- Table 31: Belgium Fluid Power Cylinder Market Revenue (Million) Forecast, by Application 2019 & 2032
- Table 32: Belgium Fluid Power Cylinder Market Volume (K Unit) Forecast, by Application 2019 & 2032
- Table 33: Netherland Fluid Power Cylinder Market Revenue (Million) Forecast, by Application 2019 & 2032
- Table 34: Netherland Fluid Power Cylinder Market Volume (K Unit) Forecast, by Application 2019 & 2032
- Table 35: Nordics Fluid Power Cylinder Market Revenue (Million) Forecast, by Application 2019 & 2032
- Table 36: Nordics Fluid Power Cylinder Market Volume (K Unit) Forecast, by Application 2019 & 2032
- Table 37: Rest of Europe Fluid Power Cylinder Market Revenue (Million) Forecast, by Application 2019 & 2032
- Table 38: Rest of Europe Fluid Power Cylinder Market Volume (K Unit) Forecast, by Application 2019 & 2032
- Table 39: Global Fluid Power Cylinder Market Revenue Million Forecast, by Country 2019 & 2032
- Table 40: Global Fluid Power Cylinder Market Volume K Unit Forecast, by Country 2019 & 2032
- Table 41: China Fluid Power Cylinder Market Revenue (Million) Forecast, by Application 2019 & 2032
- Table 42: China Fluid Power Cylinder Market Volume (K Unit) Forecast, by Application 2019 & 2032
- Table 43: Japan Fluid Power Cylinder Market Revenue (Million) Forecast, by Application 2019 & 2032
- Table 44: Japan Fluid Power Cylinder Market Volume (K Unit) Forecast, by Application 2019 & 2032
- Table 45: India Fluid Power Cylinder Market Revenue (Million) Forecast, by Application 2019 & 2032
- Table 46: India Fluid Power Cylinder Market Volume (K Unit) Forecast, by Application 2019 & 2032
- Table 47: South Korea Fluid Power Cylinder Market Revenue (Million) Forecast, by Application 2019 & 2032
- Table 48: South Korea Fluid Power Cylinder Market Volume (K Unit) Forecast, by Application 2019 & 2032
- Table 49: Southeast Asia Fluid Power Cylinder Market Revenue (Million) Forecast, by Application 2019 & 2032
- Table 50: Southeast Asia Fluid Power Cylinder Market Volume (K Unit) Forecast, by Application 2019 & 2032
- Table 51: Australia Fluid Power Cylinder Market Revenue (Million) Forecast, by Application 2019 & 2032
- Table 52: Australia Fluid Power Cylinder Market Volume (K Unit) Forecast, by Application 2019 & 2032
- Table 53: Indonesia Fluid Power Cylinder Market Revenue (Million) Forecast, by Application 2019 & 2032
- Table 54: Indonesia Fluid Power Cylinder Market Volume (K Unit) Forecast, by Application 2019 & 2032
- Table 55: Phillipes Fluid Power Cylinder Market Revenue (Million) Forecast, by Application 2019 & 2032
- Table 56: Phillipes Fluid Power Cylinder Market Volume (K Unit) Forecast, by Application 2019 & 2032
- Table 57: Singapore Fluid Power Cylinder Market Revenue (Million) Forecast, by Application 2019 & 2032
- Table 58: Singapore Fluid Power Cylinder Market Volume (K Unit) Forecast, by Application 2019 & 2032
- Table 59: Thailandc Fluid Power Cylinder Market Revenue (Million) Forecast, by Application 2019 & 2032
- Table 60: Thailandc Fluid Power Cylinder Market Volume (K Unit) Forecast, by Application 2019 & 2032
- Table 61: Rest of Asia Pacific Fluid Power Cylinder Market Revenue (Million) Forecast, by Application 2019 & 2032
- Table 62: Rest of Asia Pacific Fluid Power Cylinder Market Volume (K Unit) Forecast, by Application 2019 & 2032
- Table 63: Global Fluid Power Cylinder Market Revenue Million Forecast, by Country 2019 & 2032
- Table 64: Global Fluid Power Cylinder Market Volume K Unit Forecast, by Country 2019 & 2032
- Table 65: Brazil Fluid Power Cylinder Market Revenue (Million) Forecast, by Application 2019 & 2032
- Table 66: Brazil Fluid Power Cylinder Market Volume (K Unit) Forecast, by Application 2019 & 2032
- Table 67: Argentina Fluid Power Cylinder Market Revenue (Million) Forecast, by Application 2019 & 2032
- Table 68: Argentina Fluid Power Cylinder Market Volume (K Unit) Forecast, by Application 2019 & 2032
- Table 69: Peru Fluid Power Cylinder Market Revenue (Million) Forecast, by Application 2019 & 2032
- Table 70: Peru Fluid Power Cylinder Market Volume (K Unit) Forecast, by Application 2019 & 2032
- Table 71: Chile Fluid Power Cylinder Market Revenue (Million) Forecast, by Application 2019 & 2032
- Table 72: Chile Fluid Power Cylinder Market Volume (K Unit) Forecast, by Application 2019 & 2032
- Table 73: Colombia Fluid Power Cylinder Market Revenue (Million) Forecast, by Application 2019 & 2032
- Table 74: Colombia Fluid Power Cylinder Market Volume (K Unit) Forecast, by Application 2019 & 2032
- Table 75: Ecuador Fluid Power Cylinder Market Revenue (Million) Forecast, by Application 2019 & 2032
- Table 76: Ecuador Fluid Power Cylinder Market Volume (K Unit) Forecast, by Application 2019 & 2032
- Table 77: Venezuela Fluid Power Cylinder Market Revenue (Million) Forecast, by Application 2019 & 2032
- Table 78: Venezuela Fluid Power Cylinder Market Volume (K Unit) Forecast, by Application 2019 & 2032
- Table 79: Rest of South America Fluid Power Cylinder Market Revenue (Million) Forecast, by Application 2019 & 2032
- Table 80: Rest of South America Fluid Power Cylinder Market Volume (K Unit) Forecast, by Application 2019 & 2032
- Table 81: Global Fluid Power Cylinder Market Revenue Million Forecast, by Country 2019 & 2032
- Table 82: Global Fluid Power Cylinder Market Volume K Unit Forecast, by Country 2019 & 2032
- Table 83: United States Fluid Power Cylinder Market Revenue (Million) Forecast, by Application 2019 & 2032
- Table 84: United States Fluid Power Cylinder Market Volume (K Unit) Forecast, by Application 2019 & 2032
- Table 85: Canada Fluid Power Cylinder Market Revenue (Million) Forecast, by Application 2019 & 2032
- Table 86: Canada Fluid Power Cylinder Market Volume (K Unit) Forecast, by Application 2019 & 2032
- Table 87: Mexico Fluid Power Cylinder Market Revenue (Million) Forecast, by Application 2019 & 2032
- Table 88: Mexico Fluid Power Cylinder Market Volume (K Unit) Forecast, by Application 2019 & 2032
- Table 89: Global Fluid Power Cylinder Market Revenue Million Forecast, by Country 2019 & 2032
- Table 90: Global Fluid Power Cylinder Market Volume K Unit Forecast, by Country 2019 & 2032
- Table 91: United Arab Emirates Fluid Power Cylinder Market Revenue (Million) Forecast, by Application 2019 & 2032
- Table 92: United Arab Emirates Fluid Power Cylinder Market Volume (K Unit) Forecast, by Application 2019 & 2032
- Table 93: Saudi Arabia Fluid Power Cylinder Market Revenue (Million) Forecast, by Application 2019 & 2032
- Table 94: Saudi Arabia Fluid Power Cylinder Market Volume (K Unit) Forecast, by Application 2019 & 2032
- Table 95: South Africa Fluid Power Cylinder Market Revenue (Million) Forecast, by Application 2019 & 2032
- Table 96: South Africa Fluid Power Cylinder Market Volume (K Unit) Forecast, by Application 2019 & 2032
- Table 97: Rest of Middle East and Africa Fluid Power Cylinder Market Revenue (Million) Forecast, by Application 2019 & 2032
- Table 98: Rest of Middle East and Africa Fluid Power Cylinder Market Volume (K Unit) Forecast, by Application 2019 & 2032
- Table 99: Global Fluid Power Cylinder Market Revenue Million Forecast, by Type 2019 & 2032
- Table 100: Global Fluid Power Cylinder Market Volume K Unit Forecast, by Type 2019 & 2032
- Table 101: Global Fluid Power Cylinder Market Revenue Million Forecast, by End-user Industry 2019 & 2032
- Table 102: Global Fluid Power Cylinder Market Volume K Unit Forecast, by End-user Industry 2019 & 2032
- Table 103: Global Fluid Power Cylinder Market Revenue Million Forecast, by Country 2019 & 2032
- Table 104: Global Fluid Power Cylinder Market Volume K Unit Forecast, by Country 2019 & 2032
- Table 105: United States Fluid Power Cylinder Market Revenue (Million) Forecast, by Application 2019 & 2032
- Table 106: United States Fluid Power Cylinder Market Volume (K Unit) Forecast, by Application 2019 & 2032
- Table 107: Canada Fluid Power Cylinder Market Revenue (Million) Forecast, by Application 2019 & 2032
- Table 108: Canada Fluid Power Cylinder Market Volume (K Unit) Forecast, by Application 2019 & 2032
- Table 109: Global Fluid Power Cylinder Market Revenue Million Forecast, by Type 2019 & 2032
- Table 110: Global Fluid Power Cylinder Market Volume K Unit Forecast, by Type 2019 & 2032
- Table 111: Global Fluid Power Cylinder Market Revenue Million Forecast, by End-user Industry 2019 & 2032
- Table 112: Global Fluid Power Cylinder Market Volume K Unit Forecast, by End-user Industry 2019 & 2032
- Table 113: Global Fluid Power Cylinder Market Revenue Million Forecast, by Country 2019 & 2032
- Table 114: Global Fluid Power Cylinder Market Volume K Unit Forecast, by Country 2019 & 2032
- Table 115: Germany Fluid Power Cylinder Market Revenue (Million) Forecast, by Application 2019 & 2032
- Table 116: Germany Fluid Power Cylinder Market Volume (K Unit) Forecast, by Application 2019 & 2032
- Table 117: United Kingdom Fluid Power Cylinder Market Revenue (Million) Forecast, by Application 2019 & 2032
- Table 118: United Kingdom Fluid Power Cylinder Market Volume (K Unit) Forecast, by Application 2019 & 2032
- Table 119: France Fluid Power Cylinder Market Revenue (Million) Forecast, by Application 2019 & 2032
- Table 120: France Fluid Power Cylinder Market Volume (K Unit) Forecast, by Application 2019 & 2032
- Table 121: Rest of Europe Fluid Power Cylinder Market Revenue (Million) Forecast, by Application 2019 & 2032
- Table 122: Rest of Europe Fluid Power Cylinder Market Volume (K Unit) Forecast, by Application 2019 & 2032
- Table 123: Global Fluid Power Cylinder Market Revenue Million Forecast, by Type 2019 & 2032
- Table 124: Global Fluid Power Cylinder Market Volume K Unit Forecast, by Type 2019 & 2032
- Table 125: Global Fluid Power Cylinder Market Revenue Million Forecast, by End-user Industry 2019 & 2032
- Table 126: Global Fluid Power Cylinder Market Volume K Unit Forecast, by End-user Industry 2019 & 2032
- Table 127: Global Fluid Power Cylinder Market Revenue Million Forecast, by Country 2019 & 2032
- Table 128: Global Fluid Power Cylinder Market Volume K Unit Forecast, by Country 2019 & 2032
- Table 129: India Fluid Power Cylinder Market Revenue (Million) Forecast, by Application 2019 & 2032
- Table 130: India Fluid Power Cylinder Market Volume (K Unit) Forecast, by Application 2019 & 2032
- Table 131: China Fluid Power Cylinder Market Revenue (Million) Forecast, by Application 2019 & 2032
- Table 132: China Fluid Power Cylinder Market Volume (K Unit) Forecast, by Application 2019 & 2032
- Table 133: Japan Fluid Power Cylinder Market Revenue (Million) Forecast, by Application 2019 & 2032
- Table 134: Japan Fluid Power Cylinder Market Volume (K Unit) Forecast, by Application 2019 & 2032
- Table 135: Rest of Asia Pacifc Fluid Power Cylinder Market Revenue (Million) Forecast, by Application 2019 & 2032
- Table 136: Rest of Asia Pacifc Fluid Power Cylinder Market Volume (K Unit) Forecast, by Application 2019 & 2032
- Table 137: Global Fluid Power Cylinder Market Revenue Million Forecast, by Type 2019 & 2032
- Table 138: Global Fluid Power Cylinder Market Volume K Unit Forecast, by Type 2019 & 2032
- Table 139: Global Fluid Power Cylinder Market Revenue Million Forecast, by End-user Industry 2019 & 2032
- Table 140: Global Fluid Power Cylinder Market Volume K Unit Forecast, by End-user Industry 2019 & 2032
- Table 141: Global Fluid Power Cylinder Market Revenue Million Forecast, by Country 2019 & 2032
- Table 142: Global Fluid Power Cylinder Market Volume K Unit Forecast, by Country 2019 & 2032
- Table 143: Global Fluid Power Cylinder Market Revenue Million Forecast, by Type 2019 & 2032
- Table 144: Global Fluid Power Cylinder Market Volume K Unit Forecast, by Type 2019 & 2032
- Table 145: Global Fluid Power Cylinder Market Revenue Million Forecast, by End-user Industry 2019 & 2032
- Table 146: Global Fluid Power Cylinder Market Volume K Unit Forecast, by End-user Industry 2019 & 2032
- Table 147: Global Fluid Power Cylinder Market Revenue Million Forecast, by Country 2019 & 2032
- Table 148: Global Fluid Power Cylinder Market Volume K Unit Forecast, by Country 2019 & 2032
Frequently Asked Questions
1. What is the projected Compound Annual Growth Rate (CAGR) of the Fluid Power Cylinder Market?
The projected CAGR is approximately > 4.50%.
2. Which companies are prominent players in the Fluid Power Cylinder Market?
Key companies in the market include Pacoma GmbH, Jiangsu Hengli Hydraulic Co Ltd, SMC Corporation, Bosch Rexroth Corporation, HYDAC Verwaltung GmbH, Eaton Corporation PLC, Precision Hydraulic Cylinders Inc , Festo SE & Co KG, Danfoss A/S, Parker Hannifin Corp.
3. What are the main segments of the Fluid Power Cylinder Market?
The market segments include Type, End-user Industry.
4. Can you provide details about the market size?
The market size is estimated to be USD XX Million as of 2022.
5. What are some drivers contributing to market growth?
; Increasing Demand for Material Handling Equipment.
6. What are the notable trends driving market growth?
Hydraulic Cylinders to Hold Major Share.
7. Are there any restraints impacting market growth?
; High Cost of Maintenance of the Cylinders Over the Entire Lifespan.
8. Can you provide examples of recent developments in the market?
N/A
9. What pricing options are available for accessing the report?
Pricing options include single-user, multi-user, and enterprise licenses priced at USD 4750, USD 5250, and USD 8750 respectively.
10. Is the market size provided in terms of value or volume?
The market size is provided in terms of value, measured in Million and volume, measured in K Unit.
11. Are there any specific market keywords associated with the report?
Yes, the market keyword associated with the report is "Fluid Power Cylinder Market," which aids in identifying and referencing the specific market segment covered.
12. How do I determine which pricing option suits my needs best?
The pricing options vary based on user requirements and access needs. Individual users may opt for single-user licenses, while businesses requiring broader access may choose multi-user or enterprise licenses for cost-effective access to the report.
13. Are there any additional resources or data provided in the Fluid Power Cylinder Market report?
While the report offers comprehensive insights, it's advisable to review the specific contents or supplementary materials provided to ascertain if additional resources or data are available.
14. How can I stay updated on further developments or reports in the Fluid Power Cylinder Market?
To stay informed about further developments, trends, and reports in the Fluid Power Cylinder Market, consider subscribing to industry newsletters, following relevant companies and organizations, or regularly checking reputable industry news sources and publications.
Methodology
Step 1 - Identification of Relevant Samples Size from Population Database


Step 2 - Approaches for Defining Global Market Size (Value, Volume* & Price*)

Note*: In applicable scenarios
Step 3 - Data Sources
Primary Research
- Web Analytics
- Survey Reports
- Research Institute
- Latest Research Reports
- Opinion Leaders
Secondary Research
- Annual Reports
- White Paper
- Latest Press Release
- Industry Association
- Paid Database
- Investor Presentations

Step 4 - Data Triangulation
Involves using different sources of information in order to increase the validity of a study
These sources are likely to be stakeholders in a program - participants, other researchers, program staff, other community members, and so on.
Then we put all data in single framework & apply various statistical tools to find out the dynamic on the market.
During the analysis stage, feedback from the stakeholder groups would be compared to determine areas of agreement as well as areas of divergence
