

Key Insights
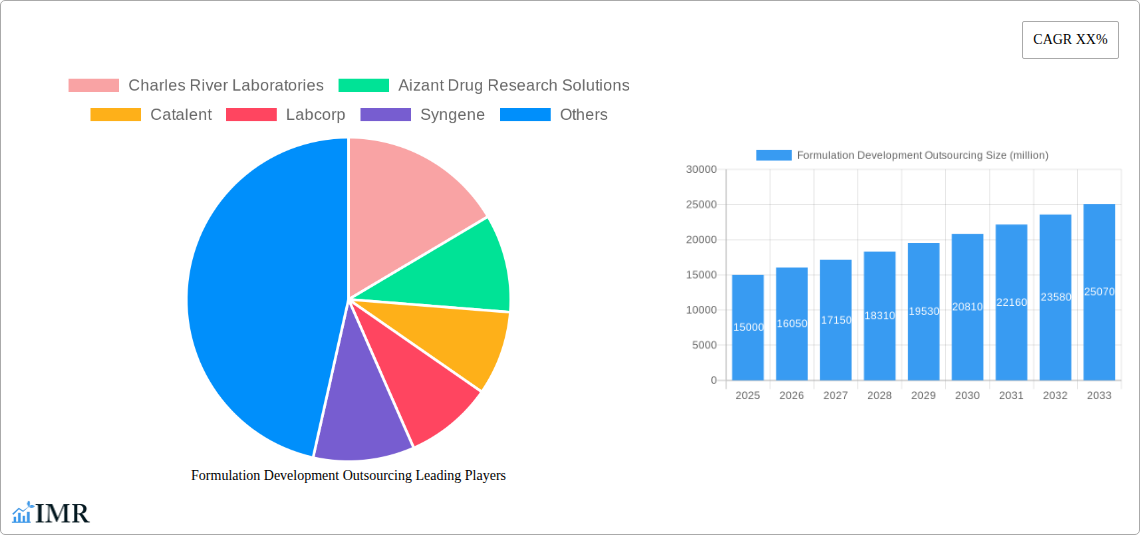
The Formulation Development Outsourcing market is experiencing robust growth, driven by the increasing complexity of drug development, escalating R&D costs for pharmaceutical and biotechnology companies, and a rising demand for specialized expertise in formulation technologies. The market's size in 2025 is estimated at $15 billion, based on a projected CAGR of 7% from 2019 to 2025, considering typical growth rates observed in this sector and the overall pharmaceutical market expansion. This growth is further fueled by the accelerating adoption of innovative drug delivery systems, such as controlled-release formulations and targeted drug delivery, necessitating specialized expertise and advanced technologies readily available through outsourcing. Key trends include a shift toward biologics and advanced therapies requiring sophisticated formulation strategies, along with a growing emphasis on personalized medicine and a resultant increase in the need for customized formulation development services.
However, the market also faces certain restraints. These include stringent regulatory requirements for drug approvals, potentially increasing compliance costs for outsourcing providers. Furthermore, concerns regarding intellectual property protection and data security can present challenges. Despite these limitations, the market is poised for continued expansion, driven by increasing partnerships and collaborations between pharmaceutical companies and CROs, a surge in outsourcing in emerging markets, and continued innovation in drug development technologies and manufacturing processes. Leading players like Charles River Laboratories, Catalent, and Lonza Group are driving this evolution through strategic acquisitions, technological advancements, and expansion into new markets. The projected market value will reach approximately $25 billion by 2033, maintaining a steady growth trajectory.
Formulation Development Outsourcing Market Report: 2019-2033
This comprehensive report provides a detailed analysis of the Formulation Development Outsourcing market, projecting robust growth from 2025 to 2033. The study covers market dynamics, growth trends, regional segmentation, product landscape, key players, and future outlook, offering invaluable insights for industry professionals, investors, and strategic decision-makers within the pharmaceutical and biotechnology sectors. The report uses 2025 as its base year and forecasts market trends until 2033, with historical data spanning 2019-2024. The total market value in 2025 is estimated at $XX billion.
Formulation Development Outsourcing Market Dynamics & Structure
The Formulation Development Outsourcing market is characterized by a moderately consolidated landscape, with several large players holding significant market share. The market is driven by technological advancements in drug delivery systems, increasing R&D expenditure by pharmaceutical companies, and stringent regulatory requirements favoring outsourcing for compliance. However, factors like high outsourcing costs, intellectual property concerns, and potential supply chain disruptions pose challenges. Mergers and acquisitions (M&A) activity has been substantial, leading to market consolidation and increased competition.
- Market Concentration: The top 5 players hold an estimated XX% market share in 2025.
- Technological Innovation: Advancements in areas like nanotechnology, controlled release formulations, and personalized medicine are driving demand for specialized outsourcing services.
- Regulatory Frameworks: Stringent regulatory compliance requirements necessitate expertise and infrastructure, pushing companies to outsource development.
- Competitive Substitutes: Internal R&D remains a competitive alternative but faces challenges in cost-effectiveness and specialized expertise.
- End-User Demographics: The market comprises primarily pharmaceutical and biotechnology companies of varying sizes, ranging from large multinational corporations to smaller biotech startups.
- M&A Trends: XX major M&A deals were observed between 2019 and 2024, resulting in a more concentrated market structure with increased service offerings.
Formulation Development Outsourcing Growth Trends & Insights
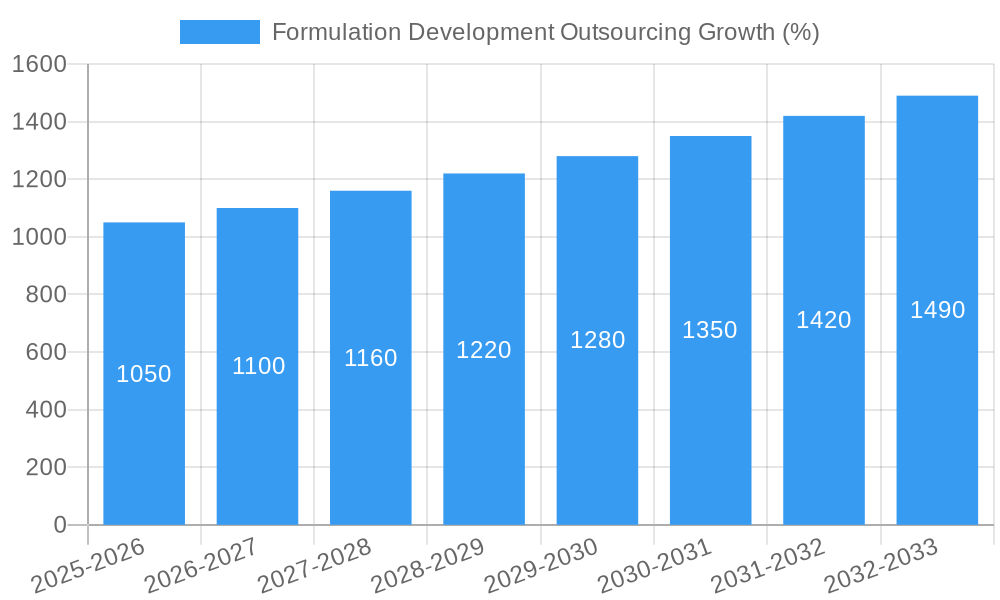
The Formulation Development Outsourcing market has witnessed significant growth during the historical period (2019-2024), driven by the factors mentioned above. The market is expected to continue its upward trajectory, exhibiting a Compound Annual Growth Rate (CAGR) of XX% during the forecast period (2025-2033). This growth is primarily fueled by the increasing prevalence of chronic diseases, an expanding drug pipeline, and the growing adoption of advanced drug delivery systems. Furthermore, technological disruptions in areas such as artificial intelligence (AI) and big data analytics are expected to significantly improve the efficiency and effectiveness of formulation development processes, further boosting market growth. The market penetration rate is projected to reach XX% by 2033. The shift towards outsourcing is expected to accelerate further due to increasing focus on cost optimization and accelerated time to market.
Dominant Regions, Countries, or Segments in Formulation Development Outsourcing
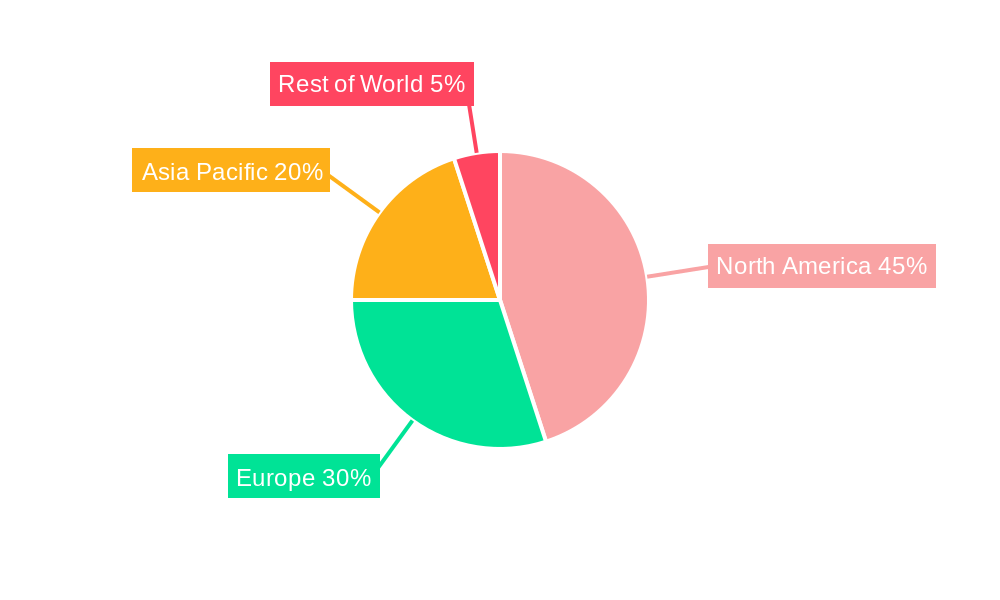
North America currently holds the largest market share, driven by strong regulatory frameworks, high R&D expenditure, and a robust pharmaceutical industry. However, the Asia-Pacific region is expected to witness the fastest growth during the forecast period due to increasing healthcare expenditure, a burgeoning pharmaceutical sector, and favorable government initiatives.
- North America: High regulatory compliance standards, advanced infrastructure, and presence of major players are key drivers.
- Europe: Stringent regulations, substantial R&D investment, and increasing prevalence of chronic diseases fuel market growth.
- Asia-Pacific: Rapid economic growth, rising healthcare expenditure, and a large patient pool drive significant market expansion.
- Rest of the World: Emerging markets offer promising growth opportunities but may face challenges due to limited infrastructure and regulatory frameworks.
Formulation Development Outsourcing Product Landscape
The Formulation Development Outsourcing market encompasses a wide range of services, including pre-formulation studies, formulation development, analytical testing, and stability studies. Innovation is primarily focused on improving drug delivery systems, extending drug shelf-life, and enhancing patient compliance. Unique selling propositions include expertise in specialized formulations (e.g., liposomes, nanoparticles), rapid prototyping capabilities, and regulatory compliance expertise. The use of advanced analytical technologies for quality control and process optimization is also a key differentiator.
Key Drivers, Barriers & Challenges in Formulation Development Outsourcing
Key Drivers:
- Rising R&D expenditure in the pharmaceutical industry.
- Increasing demand for specialized formulations and drug delivery systems.
- Stringent regulatory requirements and the need for compliance expertise.
- Growing prevalence of chronic diseases.
Key Barriers & Challenges:
- High outsourcing costs and limited budget availability among smaller companies.
- Intellectual property concerns and protection issues.
- Potential supply chain disruptions and geopolitical risks.
- Intense competition among outsourcing providers. The market is estimated to experience a price decrease of XX% by 2033 due to increased competition.
Emerging Opportunities in Formulation Development Outsourcing
- Growth in personalized medicine and targeted drug delivery systems presents significant opportunities.
- Expansion into emerging markets with unmet medical needs offers untapped potential.
- Development of novel drug delivery platforms, such as micro-needles and implantable devices, provides new avenues for growth.
Growth Accelerators in the Formulation Development Outsourcing Industry
Strategic partnerships between outsourcing providers and pharmaceutical companies are accelerating growth by fostering innovation and streamlining development processes. Technological advancements such as AI-powered drug design and simulation tools are significantly reducing development timelines and costs, making outsourcing more attractive. Furthermore, market expansion strategies focusing on emerging economies are generating new revenue streams and fueling long-term growth.
Key Players Shaping the Formulation Development Outsourcing Market
- Charles River Laboratories
- Aizant Drug Research Solutions
- Catalent
- Labcorp
- Syngene
- Irisys
- Intertek Group
- Piramal Pharma Solutions
- Qiotient Sciences
- Patheon
- Emergent BioSolutions
- Lonza Group
- Dr. Reddy's Laboratories
Notable Milestones in Formulation Development Outsourcing Sector
- 2020: Increased adoption of virtual clinical trials accelerated the use of remote monitoring and data management capabilities in formulation development.
- 2022: Several major mergers and acquisitions reshaped the competitive landscape, leading to a consolidation of market share.
- 2023: Launch of several new advanced drug delivery systems significantly broadened the service offerings of leading players.
- 2024: Increased regulatory scrutiny prompted further investment in quality control and compliance measures across the industry.
In-Depth Formulation Development Outsourcing Market Outlook
The Formulation Development Outsourcing market is poised for sustained growth driven by factors such as increasing R&D spending, technological advancements, and rising demand for specialized formulations. Strategic partnerships, expansion into emerging markets, and continuous innovation in drug delivery systems will present lucrative opportunities for key players in the years to come. The market’s long-term growth trajectory is very positive, with predictions suggesting a consistently high demand for outsourcing services in the pharmaceutical and biotech sectors.
Formulation Development Outsourcing Segmentation
-
1. Application
- 1.1. Pharmaceutical and Biopharmaceutical Companies
- 1.2. Government and Academic Institutes
- 1.3. Others
-
2. Types
- 2.1. Pre-formulation Services
- 2.2. Formulation Optimization
Formulation Development Outsourcing Segmentation By Geography
-
1. North America
- 1.1. United States
- 1.2. Canada
- 1.3. Mexico
-
2. South America
- 2.1. Brazil
- 2.2. Argentina
- 2.3. Rest of South America
-
3. Europe
- 3.1. United Kingdom
- 3.2. Germany
- 3.3. France
- 3.4. Italy
- 3.5. Spain
- 3.6. Russia
- 3.7. Benelux
- 3.8. Nordics
- 3.9. Rest of Europe
-
4. Middle East & Africa
- 4.1. Turkey
- 4.2. Israel
- 4.3. GCC
- 4.4. North Africa
- 4.5. South Africa
- 4.6. Rest of Middle East & Africa
-
5. Asia Pacific
- 5.1. China
- 5.2. India
- 5.3. Japan
- 5.4. South Korea
- 5.5. ASEAN
- 5.6. Oceania
- 5.7. Rest of Asia Pacific
Formulation Development Outsourcing REPORT HIGHLIGHTS
| Aspects | Details |
|---|---|
| Study Period | 2019-2033 |
| Base Year | 2024 |
| Estimated Year | 2025 |
| Forecast Period | 2025-2033 |
| Historical Period | 2019-2024 |
| Growth Rate | CAGR of XX% from 2019-2033 |
| Segmentation |
|
Table of Contents
- 1. Introduction
- 1.1. Research Scope
- 1.2. Market Segmentation
- 1.3. Research Methodology
- 1.4. Definitions and Assumptions
- 2. Executive Summary
- 2.1. Introduction
- 3. Market Dynamics
- 3.1. Introduction
- 3.2. Market Drivers
- 3.3. Market Restrains
- 3.4. Market Trends
- 4. Market Factor Analysis
- 4.1. Porters Five Forces
- 4.2. Supply/Value Chain
- 4.3. PESTEL analysis
- 4.4. Market Entropy
- 4.5. Patent/Trademark Analysis
- 5. Global Formulation Development Outsourcing Analysis, Insights and Forecast, 2019-2031
- 5.1. Market Analysis, Insights and Forecast - by Application
- 5.1.1. Pharmaceutical and Biopharmaceutical Companies
- 5.1.2. Government and Academic Institutes
- 5.1.3. Others
- 5.2. Market Analysis, Insights and Forecast - by Types
- 5.2.1. Pre-formulation Services
- 5.2.2. Formulation Optimization
- 5.3. Market Analysis, Insights and Forecast - by Region
- 5.3.1. North America
- 5.3.2. South America
- 5.3.3. Europe
- 5.3.4. Middle East & Africa
- 5.3.5. Asia Pacific
- 5.1. Market Analysis, Insights and Forecast - by Application
- 6. North America Formulation Development Outsourcing Analysis, Insights and Forecast, 2019-2031
- 6.1. Market Analysis, Insights and Forecast - by Application
- 6.1.1. Pharmaceutical and Biopharmaceutical Companies
- 6.1.2. Government and Academic Institutes
- 6.1.3. Others
- 6.2. Market Analysis, Insights and Forecast - by Types
- 6.2.1. Pre-formulation Services
- 6.2.2. Formulation Optimization
- 6.1. Market Analysis, Insights and Forecast - by Application
- 7. South America Formulation Development Outsourcing Analysis, Insights and Forecast, 2019-2031
- 7.1. Market Analysis, Insights and Forecast - by Application
- 7.1.1. Pharmaceutical and Biopharmaceutical Companies
- 7.1.2. Government and Academic Institutes
- 7.1.3. Others
- 7.2. Market Analysis, Insights and Forecast - by Types
- 7.2.1. Pre-formulation Services
- 7.2.2. Formulation Optimization
- 7.1. Market Analysis, Insights and Forecast - by Application
- 8. Europe Formulation Development Outsourcing Analysis, Insights and Forecast, 2019-2031
- 8.1. Market Analysis, Insights and Forecast - by Application
- 8.1.1. Pharmaceutical and Biopharmaceutical Companies
- 8.1.2. Government and Academic Institutes
- 8.1.3. Others
- 8.2. Market Analysis, Insights and Forecast - by Types
- 8.2.1. Pre-formulation Services
- 8.2.2. Formulation Optimization
- 8.1. Market Analysis, Insights and Forecast - by Application
- 9. Middle East & Africa Formulation Development Outsourcing Analysis, Insights and Forecast, 2019-2031
- 9.1. Market Analysis, Insights and Forecast - by Application
- 9.1.1. Pharmaceutical and Biopharmaceutical Companies
- 9.1.2. Government and Academic Institutes
- 9.1.3. Others
- 9.2. Market Analysis, Insights and Forecast - by Types
- 9.2.1. Pre-formulation Services
- 9.2.2. Formulation Optimization
- 9.1. Market Analysis, Insights and Forecast - by Application
- 10. Asia Pacific Formulation Development Outsourcing Analysis, Insights and Forecast, 2019-2031
- 10.1. Market Analysis, Insights and Forecast - by Application
- 10.1.1. Pharmaceutical and Biopharmaceutical Companies
- 10.1.2. Government and Academic Institutes
- 10.1.3. Others
- 10.2. Market Analysis, Insights and Forecast - by Types
- 10.2.1. Pre-formulation Services
- 10.2.2. Formulation Optimization
- 10.1. Market Analysis, Insights and Forecast - by Application
- 11. Competitive Analysis
- 11.1. Global Market Share Analysis 2024
- 11.2. Company Profiles
- 11.2.1 Charles River Laboratories
- 11.2.1.1. Overview
- 11.2.1.2. Products
- 11.2.1.3. SWOT Analysis
- 11.2.1.4. Recent Developments
- 11.2.1.5. Financials (Based on Availability)
- 11.2.2 Aizant Drug Research Solutions
- 11.2.2.1. Overview
- 11.2.2.2. Products
- 11.2.2.3. SWOT Analysis
- 11.2.2.4. Recent Developments
- 11.2.2.5. Financials (Based on Availability)
- 11.2.3 Catalent
- 11.2.3.1. Overview
- 11.2.3.2. Products
- 11.2.3.3. SWOT Analysis
- 11.2.3.4. Recent Developments
- 11.2.3.5. Financials (Based on Availability)
- 11.2.4 Labcorp
- 11.2.4.1. Overview
- 11.2.4.2. Products
- 11.2.4.3. SWOT Analysis
- 11.2.4.4. Recent Developments
- 11.2.4.5. Financials (Based on Availability)
- 11.2.5 Syngene
- 11.2.5.1. Overview
- 11.2.5.2. Products
- 11.2.5.3. SWOT Analysis
- 11.2.5.4. Recent Developments
- 11.2.5.5. Financials (Based on Availability)
- 11.2.6 Irisys
- 11.2.6.1. Overview
- 11.2.6.2. Products
- 11.2.6.3. SWOT Analysis
- 11.2.6.4. Recent Developments
- 11.2.6.5. Financials (Based on Availability)
- 11.2.7 Intertek Group
- 11.2.7.1. Overview
- 11.2.7.2. Products
- 11.2.7.3. SWOT Analysis
- 11.2.7.4. Recent Developments
- 11.2.7.5. Financials (Based on Availability)
- 11.2.8 Piramal Pharma Solutions
- 11.2.8.1. Overview
- 11.2.8.2. Products
- 11.2.8.3. SWOT Analysis
- 11.2.8.4. Recent Developments
- 11.2.8.5. Financials (Based on Availability)
- 11.2.9 Qiotient Sciences
- 11.2.9.1. Overview
- 11.2.9.2. Products
- 11.2.9.3. SWOT Analysis
- 11.2.9.4. Recent Developments
- 11.2.9.5. Financials (Based on Availability)
- 11.2.10 Patheon
- 11.2.10.1. Overview
- 11.2.10.2. Products
- 11.2.10.3. SWOT Analysis
- 11.2.10.4. Recent Developments
- 11.2.10.5. Financials (Based on Availability)
- 11.2.11 Emergent BioSolutions
- 11.2.11.1. Overview
- 11.2.11.2. Products
- 11.2.11.3. SWOT Analysis
- 11.2.11.4. Recent Developments
- 11.2.11.5. Financials (Based on Availability)
- 11.2.12 Lonza Group
- 11.2.12.1. Overview
- 11.2.12.2. Products
- 11.2.12.3. SWOT Analysis
- 11.2.12.4. Recent Developments
- 11.2.12.5. Financials (Based on Availability)
- 11.2.13 Dr. Reddy's Laboratories
- 11.2.13.1. Overview
- 11.2.13.2. Products
- 11.2.13.3. SWOT Analysis
- 11.2.13.4. Recent Developments
- 11.2.13.5. Financials (Based on Availability)
- 11.2.1 Charles River Laboratories
List of Figures
- Figure 1: Global Formulation Development Outsourcing Revenue Breakdown (million, %) by Region 2024 & 2032
- Figure 2: North America Formulation Development Outsourcing Revenue (million), by Application 2024 & 2032
- Figure 3: North America Formulation Development Outsourcing Revenue Share (%), by Application 2024 & 2032
- Figure 4: North America Formulation Development Outsourcing Revenue (million), by Types 2024 & 2032
- Figure 5: North America Formulation Development Outsourcing Revenue Share (%), by Types 2024 & 2032
- Figure 6: North America Formulation Development Outsourcing Revenue (million), by Country 2024 & 2032
- Figure 7: North America Formulation Development Outsourcing Revenue Share (%), by Country 2024 & 2032
- Figure 8: South America Formulation Development Outsourcing Revenue (million), by Application 2024 & 2032
- Figure 9: South America Formulation Development Outsourcing Revenue Share (%), by Application 2024 & 2032
- Figure 10: South America Formulation Development Outsourcing Revenue (million), by Types 2024 & 2032
- Figure 11: South America Formulation Development Outsourcing Revenue Share (%), by Types 2024 & 2032
- Figure 12: South America Formulation Development Outsourcing Revenue (million), by Country 2024 & 2032
- Figure 13: South America Formulation Development Outsourcing Revenue Share (%), by Country 2024 & 2032
- Figure 14: Europe Formulation Development Outsourcing Revenue (million), by Application 2024 & 2032
- Figure 15: Europe Formulation Development Outsourcing Revenue Share (%), by Application 2024 & 2032
- Figure 16: Europe Formulation Development Outsourcing Revenue (million), by Types 2024 & 2032
- Figure 17: Europe Formulation Development Outsourcing Revenue Share (%), by Types 2024 & 2032
- Figure 18: Europe Formulation Development Outsourcing Revenue (million), by Country 2024 & 2032
- Figure 19: Europe Formulation Development Outsourcing Revenue Share (%), by Country 2024 & 2032
- Figure 20: Middle East & Africa Formulation Development Outsourcing Revenue (million), by Application 2024 & 2032
- Figure 21: Middle East & Africa Formulation Development Outsourcing Revenue Share (%), by Application 2024 & 2032
- Figure 22: Middle East & Africa Formulation Development Outsourcing Revenue (million), by Types 2024 & 2032
- Figure 23: Middle East & Africa Formulation Development Outsourcing Revenue Share (%), by Types 2024 & 2032
- Figure 24: Middle East & Africa Formulation Development Outsourcing Revenue (million), by Country 2024 & 2032
- Figure 25: Middle East & Africa Formulation Development Outsourcing Revenue Share (%), by Country 2024 & 2032
- Figure 26: Asia Pacific Formulation Development Outsourcing Revenue (million), by Application 2024 & 2032
- Figure 27: Asia Pacific Formulation Development Outsourcing Revenue Share (%), by Application 2024 & 2032
- Figure 28: Asia Pacific Formulation Development Outsourcing Revenue (million), by Types 2024 & 2032
- Figure 29: Asia Pacific Formulation Development Outsourcing Revenue Share (%), by Types 2024 & 2032
- Figure 30: Asia Pacific Formulation Development Outsourcing Revenue (million), by Country 2024 & 2032
- Figure 31: Asia Pacific Formulation Development Outsourcing Revenue Share (%), by Country 2024 & 2032
List of Tables
- Table 1: Global Formulation Development Outsourcing Revenue million Forecast, by Region 2019 & 2032
- Table 2: Global Formulation Development Outsourcing Revenue million Forecast, by Application 2019 & 2032
- Table 3: Global Formulation Development Outsourcing Revenue million Forecast, by Types 2019 & 2032
- Table 4: Global Formulation Development Outsourcing Revenue million Forecast, by Region 2019 & 2032
- Table 5: Global Formulation Development Outsourcing Revenue million Forecast, by Application 2019 & 2032
- Table 6: Global Formulation Development Outsourcing Revenue million Forecast, by Types 2019 & 2032
- Table 7: Global Formulation Development Outsourcing Revenue million Forecast, by Country 2019 & 2032
- Table 8: United States Formulation Development Outsourcing Revenue (million) Forecast, by Application 2019 & 2032
- Table 9: Canada Formulation Development Outsourcing Revenue (million) Forecast, by Application 2019 & 2032
- Table 10: Mexico Formulation Development Outsourcing Revenue (million) Forecast, by Application 2019 & 2032
- Table 11: Global Formulation Development Outsourcing Revenue million Forecast, by Application 2019 & 2032
- Table 12: Global Formulation Development Outsourcing Revenue million Forecast, by Types 2019 & 2032
- Table 13: Global Formulation Development Outsourcing Revenue million Forecast, by Country 2019 & 2032
- Table 14: Brazil Formulation Development Outsourcing Revenue (million) Forecast, by Application 2019 & 2032
- Table 15: Argentina Formulation Development Outsourcing Revenue (million) Forecast, by Application 2019 & 2032
- Table 16: Rest of South America Formulation Development Outsourcing Revenue (million) Forecast, by Application 2019 & 2032
- Table 17: Global Formulation Development Outsourcing Revenue million Forecast, by Application 2019 & 2032
- Table 18: Global Formulation Development Outsourcing Revenue million Forecast, by Types 2019 & 2032
- Table 19: Global Formulation Development Outsourcing Revenue million Forecast, by Country 2019 & 2032
- Table 20: United Kingdom Formulation Development Outsourcing Revenue (million) Forecast, by Application 2019 & 2032
- Table 21: Germany Formulation Development Outsourcing Revenue (million) Forecast, by Application 2019 & 2032
- Table 22: France Formulation Development Outsourcing Revenue (million) Forecast, by Application 2019 & 2032
- Table 23: Italy Formulation Development Outsourcing Revenue (million) Forecast, by Application 2019 & 2032
- Table 24: Spain Formulation Development Outsourcing Revenue (million) Forecast, by Application 2019 & 2032
- Table 25: Russia Formulation Development Outsourcing Revenue (million) Forecast, by Application 2019 & 2032
- Table 26: Benelux Formulation Development Outsourcing Revenue (million) Forecast, by Application 2019 & 2032
- Table 27: Nordics Formulation Development Outsourcing Revenue (million) Forecast, by Application 2019 & 2032
- Table 28: Rest of Europe Formulation Development Outsourcing Revenue (million) Forecast, by Application 2019 & 2032
- Table 29: Global Formulation Development Outsourcing Revenue million Forecast, by Application 2019 & 2032
- Table 30: Global Formulation Development Outsourcing Revenue million Forecast, by Types 2019 & 2032
- Table 31: Global Formulation Development Outsourcing Revenue million Forecast, by Country 2019 & 2032
- Table 32: Turkey Formulation Development Outsourcing Revenue (million) Forecast, by Application 2019 & 2032
- Table 33: Israel Formulation Development Outsourcing Revenue (million) Forecast, by Application 2019 & 2032
- Table 34: GCC Formulation Development Outsourcing Revenue (million) Forecast, by Application 2019 & 2032
- Table 35: North Africa Formulation Development Outsourcing Revenue (million) Forecast, by Application 2019 & 2032
- Table 36: South Africa Formulation Development Outsourcing Revenue (million) Forecast, by Application 2019 & 2032
- Table 37: Rest of Middle East & Africa Formulation Development Outsourcing Revenue (million) Forecast, by Application 2019 & 2032
- Table 38: Global Formulation Development Outsourcing Revenue million Forecast, by Application 2019 & 2032
- Table 39: Global Formulation Development Outsourcing Revenue million Forecast, by Types 2019 & 2032
- Table 40: Global Formulation Development Outsourcing Revenue million Forecast, by Country 2019 & 2032
- Table 41: China Formulation Development Outsourcing Revenue (million) Forecast, by Application 2019 & 2032
- Table 42: India Formulation Development Outsourcing Revenue (million) Forecast, by Application 2019 & 2032
- Table 43: Japan Formulation Development Outsourcing Revenue (million) Forecast, by Application 2019 & 2032
- Table 44: South Korea Formulation Development Outsourcing Revenue (million) Forecast, by Application 2019 & 2032
- Table 45: ASEAN Formulation Development Outsourcing Revenue (million) Forecast, by Application 2019 & 2032
- Table 46: Oceania Formulation Development Outsourcing Revenue (million) Forecast, by Application 2019 & 2032
- Table 47: Rest of Asia Pacific Formulation Development Outsourcing Revenue (million) Forecast, by Application 2019 & 2032
Frequently Asked Questions
1. What is the projected Compound Annual Growth Rate (CAGR) of the Formulation Development Outsourcing?
The projected CAGR is approximately XX%.
2. Which companies are prominent players in the Formulation Development Outsourcing?
Key companies in the market include Charles River Laboratories, Aizant Drug Research Solutions, Catalent, Labcorp, Syngene, Irisys, Intertek Group, Piramal Pharma Solutions, Qiotient Sciences, Patheon, Emergent BioSolutions, Lonza Group, Dr. Reddy's Laboratories.
3. What are the main segments of the Formulation Development Outsourcing?
The market segments include Application, Types.
4. Can you provide details about the market size?
The market size is estimated to be USD XXX million as of 2022.
5. What are some drivers contributing to market growth?
N/A
6. What are the notable trends driving market growth?
N/A
7. Are there any restraints impacting market growth?
N/A
8. Can you provide examples of recent developments in the market?
N/A
9. What pricing options are available for accessing the report?
Pricing options include single-user, multi-user, and enterprise licenses priced at USD 3350.00, USD 5025.00, and USD 6700.00 respectively.
10. Is the market size provided in terms of value or volume?
The market size is provided in terms of value, measured in million.
11. Are there any specific market keywords associated with the report?
Yes, the market keyword associated with the report is "Formulation Development Outsourcing," which aids in identifying and referencing the specific market segment covered.
12. How do I determine which pricing option suits my needs best?
The pricing options vary based on user requirements and access needs. Individual users may opt for single-user licenses, while businesses requiring broader access may choose multi-user or enterprise licenses for cost-effective access to the report.
13. Are there any additional resources or data provided in the Formulation Development Outsourcing report?
While the report offers comprehensive insights, it's advisable to review the specific contents or supplementary materials provided to ascertain if additional resources or data are available.
14. How can I stay updated on further developments or reports in the Formulation Development Outsourcing?
To stay informed about further developments, trends, and reports in the Formulation Development Outsourcing, consider subscribing to industry newsletters, following relevant companies and organizations, or regularly checking reputable industry news sources and publications.
Methodology
Step 1 - Identification of Relevant Samples Size from Population Database


Step 2 - Approaches for Defining Global Market Size (Value, Volume* & Price*)

Note*: In applicable scenarios
Step 3 - Data Sources
Primary Research
- Web Analytics
- Survey Reports
- Research Institute
- Latest Research Reports
- Opinion Leaders
Secondary Research
- Annual Reports
- White Paper
- Latest Press Release
- Industry Association
- Paid Database
- Investor Presentations

Step 4 - Data Triangulation
Involves using different sources of information in order to increase the validity of a study
These sources are likely to be stakeholders in a program - participants, other researchers, program staff, other community members, and so on.
Then we put all data in single framework & apply various statistical tools to find out the dynamic on the market.
During the analysis stage, feedback from the stakeholder groups would be compared to determine areas of agreement as well as areas of divergence
