

Key Insights
The Gas Chromatography (GC) software market is experiencing robust growth, driven by the increasing adoption of GC systems across various industries, including pharmaceuticals, environmental monitoring, and food safety. The market's expansion is fueled by the rising demand for advanced analytical techniques offering high precision and accuracy in chemical analysis. Technological advancements, such as the integration of artificial intelligence and machine learning for data analysis and automation, are further propelling market growth. Furthermore, the growing need for efficient and cost-effective solutions for complex chemical analysis is driving the demand for sophisticated GC software capable of handling large datasets and providing comprehensive results. The competitive landscape includes established players like Agilent Technologies, Thermo Fisher Scientific, and Shimadzu, alongside specialized software developers. These companies are actively engaged in developing innovative software solutions to meet the evolving needs of researchers and analysts. This leads to a dynamic market with ongoing competition driving innovation and price optimization.
The forecast period (2025-2033) anticipates continued growth, primarily driven by increasing research and development activities in diverse sectors. Stringent regulatory requirements in industries like pharmaceuticals and environmental monitoring mandate precise and reliable analytical tools, increasing the demand for advanced GC software. The adoption of cloud-based platforms and remote data analysis capabilities is expected to transform market dynamics, offering improved accessibility and collaboration opportunities. However, factors like high initial investment costs for advanced GC systems and software and the need for specialized expertise in operating and maintaining the systems may slightly restrain market growth. Nevertheless, the overall outlook for the GC software market remains positive, with significant potential for expansion in the coming years. The integration of emerging technologies and increasing industry adoption are key factors contributing to this positive forecast.
Gas Chromatography (GC) Software Market Report: 2019-2033
This comprehensive report provides a detailed analysis of the Gas Chromatography (GC) Software market, encompassing market dynamics, growth trends, regional segmentation, product landscape, key players, and future outlook. The study period covers 2019-2033, with 2025 as the base and estimated year. The report offers invaluable insights for industry professionals, investors, and stakeholders seeking to understand and capitalize on opportunities within this dynamic market. The parent market is Analytical Instruments and the child market is Chromatography Software.
Gas Chromatography GC Software Market Dynamics & Structure
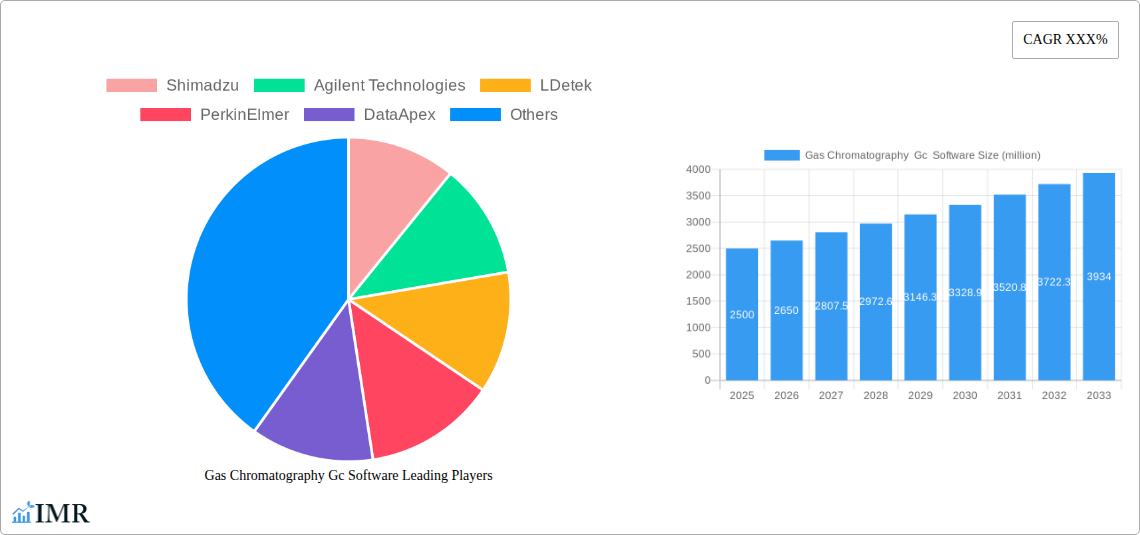
This section analyzes the competitive landscape of the GC Software market, examining market concentration, technological innovation, regulatory influences, and market dynamics. The global GC software market size was valued at $xx million in 2024 and is projected to reach $xx million by 2033, exhibiting a CAGR of xx% during the forecast period (2025-2033).
Market Concentration: The market is moderately concentrated, with key players like Agilent Technologies, Thermo Fisher Scientific, and Shimadzu holding significant market share. However, several smaller companies contribute to the overall market vibrancy. The Herfindahl-Hirschman Index (HHI) is estimated to be xx, indicating a moderately concentrated market.
Technological Innovation: Continuous advancements in GC technology, such as the integration of AI and machine learning for improved data analysis and automation, are key drivers of market growth. The development of cloud-based software solutions is also gaining traction.
Regulatory Framework: Regulatory compliance, particularly in industries like pharmaceuticals and environmental testing, significantly impacts the adoption of GC software. Stringent regulations drive the demand for validated and compliant software solutions.
Competitive Product Substitutes: While GC is a widely established technique, alternative analytical methods like liquid chromatography (LC) and mass spectrometry (MS) present some competitive pressure. However, GC's niche applications continue to support market growth.
End-User Demographics: Key end-users include pharmaceutical companies, environmental testing labs, food and beverage manufacturers, and academic research institutions. The growth in these sectors directly correlates with the market demand.
M&A Trends: The GC software market has witnessed several mergers and acquisitions (M&A) in recent years, primarily driven by the consolidation of market players and expansion into new geographical regions. An estimated xx M&A deals were recorded between 2019 and 2024.
Gas Chromatography GC Software Growth Trends & Insights
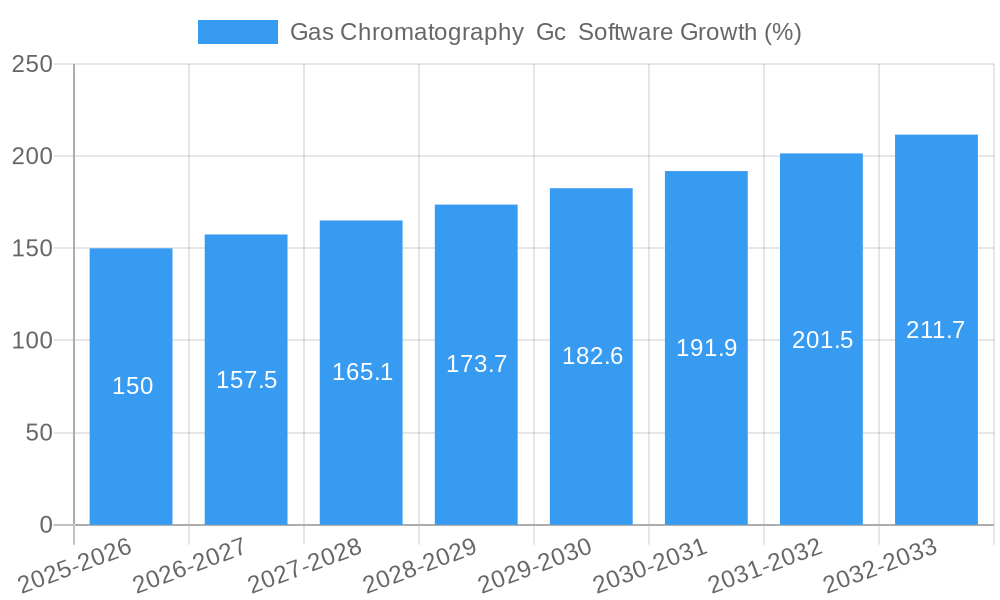
The global GC software market is experiencing robust growth, driven by increasing demand from various sectors. The historical period (2019-2024) showcased significant adoption, and the forecast period (2025-2033) promises continued expansion, fueled by technological advancements and rising awareness of the benefits of sophisticated data analysis in chromatography. Market penetration in key regions like North America and Europe is relatively high, while emerging markets in Asia-Pacific present significant growth opportunities.
The adoption of cloud-based GC software is gaining momentum due to improved data accessibility, collaboration features, and reduced IT infrastructure costs. Furthermore, the integration of artificial intelligence (AI) and machine learning (ML) capabilities is enabling more efficient and accurate data analysis, ultimately enhancing the value proposition of GC software solutions. This contributes to a higher CAGR of xx% between 2025 and 2033. Consumer behavior shifts include a preference for user-friendly interfaces and integrated software packages that streamline the entire analytical workflow.
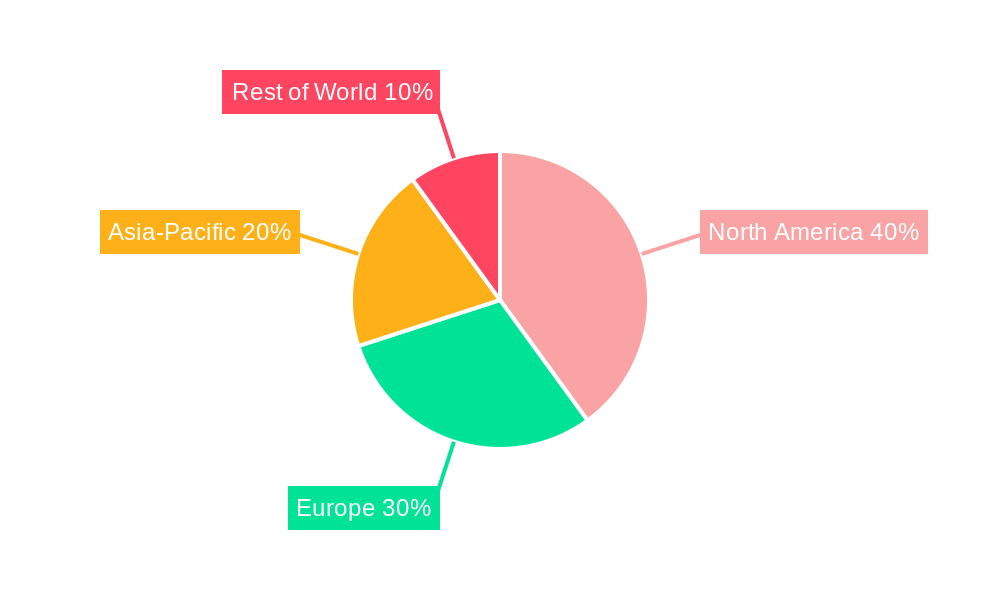
Dominant Regions, Countries, or Segments in Gas Chromatography GC Software
North America currently dominates the GC software market, driven by strong technological advancements, the presence of major players, and a high concentration of research institutions and pharmaceutical companies. Europe holds a significant share, while the Asia-Pacific region is poised for substantial growth due to rapid industrialization and increasing investments in research and development.
North America: High adoption rates, stringent regulatory frameworks, and a well-established scientific research infrastructure contribute to its leading position.
Europe: Significant investments in scientific research and a strong regulatory focus on quality control maintain a robust market share.
Asia-Pacific: Rapid industrialization and economic growth are driving market expansion in countries like China and India. Increased investments in R&D further accelerate growth.
Gas Chromatography GC Software Product Landscape
GC software solutions range from basic data acquisition and processing software to sophisticated packages incorporating advanced data analysis tools, including AI and machine learning algorithms. These advanced packages offer features such as automated peak identification, spectral libraries, and reporting functionalities. Unique selling propositions often center on ease of use, superior data analysis capabilities, regulatory compliance features, and integration with other analytical instruments. Recent technological advancements focus on enhancing user experience, improving data interpretation accuracy, and seamlessly integrating with other laboratory information management systems (LIMS).
Key Drivers, Barriers & Challenges in Gas Chromatography GC Software
Key Drivers:
- Increasing demand for high-throughput analysis across various industries.
- Growing adoption of advanced data analysis techniques.
- Stringent regulatory requirements driving the need for compliant software.
Challenges & Restraints:
- High initial investment costs for advanced software packages can limit adoption by smaller laboratories.
- The complexity of some software solutions may pose a barrier to entry for some users.
- Competition from open-source alternatives and lower-priced software packages can affect pricing strategies.
Emerging Opportunities in Gas Chromatography GC Software
- Expansion into Emerging Markets: Significant untapped potential exists in developing economies.
- Integration with IoT and Cloud Technologies: Cloud-based solutions and remote monitoring offer improved data management and accessibility.
- Development of Specialized Software for Niche Applications: Tailored software for specific industry sectors (e.g., environmental monitoring, food safety) can create new opportunities.
Growth Accelerators in the Gas Chromatography Gc Software Industry
Strategic partnerships between software developers and instrument manufacturers are driving growth by ensuring seamless integration of software with hardware. Moreover, continuous technological innovations, particularly in AI and machine learning for data analysis, are significantly expanding the capabilities and applications of GC software. This, combined with aggressive marketing and the expanding adoption of GC techniques in various fields, are catalysts for further market growth.
Key Players Shaping the Gas Chromatography GC Software Market
- Shimadzu
- Agilent Technologies
- LDetek
- PerkinElmer
- DataApex
- Thermo Fisher Scientific
- AMETEK MOCON
- Emerson Electric
- SCION Instruments
- UniChrom
- Siemens
- Waters
- SRI Instruments
- Buck Scientific
- I-Vigilant
- StillPeaks
- Chromperfect
- SpectralWorks
- Advanced Chemistry Development
- SepSolve Analytical
- H&A Scientific
Notable Milestones in Gas Chromatography GC Software Sector
- 2020, Q4: Agilent Technologies launched a new GC software suite with enhanced AI capabilities.
- 2022, Q1: Thermo Fisher Scientific acquired a smaller GC software company, expanding its product portfolio.
- 2023, Q3: DataApex released a major update to its software, improving user experience and adding new features. (Further milestones would be added here based on available data)
In-Depth Gas Chromatography GC Software Market Outlook
The future of the GC software market looks bright, driven by continuous technological advancements, increasing demand from diverse sectors, and expansion into new geographical regions. Strategic partnerships, investment in R&D, and the development of innovative software solutions will continue to shape market dynamics. The market's long-term growth potential is significant, offering considerable opportunities for both established players and emerging companies.
Gas Chromatography Gc Software Segmentation
-
1. Application
- 1.1. OEM
- 1.2. Laboratory
- 1.3. Others
-
2. Type
- 2.1. Client Based
- 2.2. Server-Based
Gas Chromatography Gc Software Segmentation By Geography
-
1. North America
- 1.1. United States
- 1.2. Canada
- 1.3. Mexico
-
2. South America
- 2.1. Brazil
- 2.2. Argentina
- 2.3. Rest of South America
-
3. Europe
- 3.1. United Kingdom
- 3.2. Germany
- 3.3. France
- 3.4. Italy
- 3.5. Spain
- 3.6. Russia
- 3.7. Benelux
- 3.8. Nordics
- 3.9. Rest of Europe
-
4. Middle East & Africa
- 4.1. Turkey
- 4.2. Israel
- 4.3. GCC
- 4.4. North Africa
- 4.5. South Africa
- 4.6. Rest of Middle East & Africa
-
5. Asia Pacific
- 5.1. China
- 5.2. India
- 5.3. Japan
- 5.4. South Korea
- 5.5. ASEAN
- 5.6. Oceania
- 5.7. Rest of Asia Pacific
Gas Chromatography Gc Software REPORT HIGHLIGHTS
| Aspects | Details |
|---|---|
| Study Period | 2019-2033 |
| Base Year | 2024 |
| Estimated Year | 2025 |
| Forecast Period | 2025-2033 |
| Historical Period | 2019-2024 |
| Growth Rate | CAGR of XXX% from 2019-2033 |
| Segmentation |
|
Table of Contents
- 1. Introduction
- 1.1. Research Scope
- 1.2. Market Segmentation
- 1.3. Research Methodology
- 1.4. Definitions and Assumptions
- 2. Executive Summary
- 2.1. Introduction
- 3. Market Dynamics
- 3.1. Introduction
- 3.2. Market Drivers
- 3.3. Market Restrains
- 3.4. Market Trends
- 4. Market Factor Analysis
- 4.1. Porters Five Forces
- 4.2. Supply/Value Chain
- 4.3. PESTEL analysis
- 4.4. Market Entropy
- 4.5. Patent/Trademark Analysis
- 5. Global Gas Chromatography Gc Software Analysis, Insights and Forecast, 2019-2031
- 5.1. Market Analysis, Insights and Forecast - by Application
- 5.1.1. OEM
- 5.1.2. Laboratory
- 5.1.3. Others
- 5.2. Market Analysis, Insights and Forecast - by Type
- 5.2.1. Client Based
- 5.2.2. Server-Based
- 5.3. Market Analysis, Insights and Forecast - by Region
- 5.3.1. North America
- 5.3.2. South America
- 5.3.3. Europe
- 5.3.4. Middle East & Africa
- 5.3.5. Asia Pacific
- 5.1. Market Analysis, Insights and Forecast - by Application
- 6. North America Gas Chromatography Gc Software Analysis, Insights and Forecast, 2019-2031
- 6.1. Market Analysis, Insights and Forecast - by Application
- 6.1.1. OEM
- 6.1.2. Laboratory
- 6.1.3. Others
- 6.2. Market Analysis, Insights and Forecast - by Type
- 6.2.1. Client Based
- 6.2.2. Server-Based
- 6.1. Market Analysis, Insights and Forecast - by Application
- 7. South America Gas Chromatography Gc Software Analysis, Insights and Forecast, 2019-2031
- 7.1. Market Analysis, Insights and Forecast - by Application
- 7.1.1. OEM
- 7.1.2. Laboratory
- 7.1.3. Others
- 7.2. Market Analysis, Insights and Forecast - by Type
- 7.2.1. Client Based
- 7.2.2. Server-Based
- 7.1. Market Analysis, Insights and Forecast - by Application
- 8. Europe Gas Chromatography Gc Software Analysis, Insights and Forecast, 2019-2031
- 8.1. Market Analysis, Insights and Forecast - by Application
- 8.1.1. OEM
- 8.1.2. Laboratory
- 8.1.3. Others
- 8.2. Market Analysis, Insights and Forecast - by Type
- 8.2.1. Client Based
- 8.2.2. Server-Based
- 8.1. Market Analysis, Insights and Forecast - by Application
- 9. Middle East & Africa Gas Chromatography Gc Software Analysis, Insights and Forecast, 2019-2031
- 9.1. Market Analysis, Insights and Forecast - by Application
- 9.1.1. OEM
- 9.1.2. Laboratory
- 9.1.3. Others
- 9.2. Market Analysis, Insights and Forecast - by Type
- 9.2.1. Client Based
- 9.2.2. Server-Based
- 9.1. Market Analysis, Insights and Forecast - by Application
- 10. Asia Pacific Gas Chromatography Gc Software Analysis, Insights and Forecast, 2019-2031
- 10.1. Market Analysis, Insights and Forecast - by Application
- 10.1.1. OEM
- 10.1.2. Laboratory
- 10.1.3. Others
- 10.2. Market Analysis, Insights and Forecast - by Type
- 10.2.1. Client Based
- 10.2.2. Server-Based
- 10.1. Market Analysis, Insights and Forecast - by Application
- 11. Competitive Analysis
- 11.1. Global Market Share Analysis 2024
- 11.2. Company Profiles
- 11.2.1 Shimadzu
- 11.2.1.1. Overview
- 11.2.1.2. Products
- 11.2.1.3. SWOT Analysis
- 11.2.1.4. Recent Developments
- 11.2.1.5. Financials (Based on Availability)
- 11.2.2 Agilent Technologies
- 11.2.2.1. Overview
- 11.2.2.2. Products
- 11.2.2.3. SWOT Analysis
- 11.2.2.4. Recent Developments
- 11.2.2.5. Financials (Based on Availability)
- 11.2.3 LDetek
- 11.2.3.1. Overview
- 11.2.3.2. Products
- 11.2.3.3. SWOT Analysis
- 11.2.3.4. Recent Developments
- 11.2.3.5. Financials (Based on Availability)
- 11.2.4 PerkinElmer
- 11.2.4.1. Overview
- 11.2.4.2. Products
- 11.2.4.3. SWOT Analysis
- 11.2.4.4. Recent Developments
- 11.2.4.5. Financials (Based on Availability)
- 11.2.5 DataApex
- 11.2.5.1. Overview
- 11.2.5.2. Products
- 11.2.5.3. SWOT Analysis
- 11.2.5.4. Recent Developments
- 11.2.5.5. Financials (Based on Availability)
- 11.2.6 Thermo Fisher Scientific
- 11.2.6.1. Overview
- 11.2.6.2. Products
- 11.2.6.3. SWOT Analysis
- 11.2.6.4. Recent Developments
- 11.2.6.5. Financials (Based on Availability)
- 11.2.7 AMETEK MOCON
- 11.2.7.1. Overview
- 11.2.7.2. Products
- 11.2.7.3. SWOT Analysis
- 11.2.7.4. Recent Developments
- 11.2.7.5. Financials (Based on Availability)
- 11.2.8 Emerson Electric
- 11.2.8.1. Overview
- 11.2.8.2. Products
- 11.2.8.3. SWOT Analysis
- 11.2.8.4. Recent Developments
- 11.2.8.5. Financials (Based on Availability)
- 11.2.9 SCION Instruments
- 11.2.9.1. Overview
- 11.2.9.2. Products
- 11.2.9.3. SWOT Analysis
- 11.2.9.4. Recent Developments
- 11.2.9.5. Financials (Based on Availability)
- 11.2.10 UniChrom
- 11.2.10.1. Overview
- 11.2.10.2. Products
- 11.2.10.3. SWOT Analysis
- 11.2.10.4. Recent Developments
- 11.2.10.5. Financials (Based on Availability)
- 11.2.11 Siemens
- 11.2.11.1. Overview
- 11.2.11.2. Products
- 11.2.11.3. SWOT Analysis
- 11.2.11.4. Recent Developments
- 11.2.11.5. Financials (Based on Availability)
- 11.2.12 Waters
- 11.2.12.1. Overview
- 11.2.12.2. Products
- 11.2.12.3. SWOT Analysis
- 11.2.12.4. Recent Developments
- 11.2.12.5. Financials (Based on Availability)
- 11.2.13 SRI Instruments
- 11.2.13.1. Overview
- 11.2.13.2. Products
- 11.2.13.3. SWOT Analysis
- 11.2.13.4. Recent Developments
- 11.2.13.5. Financials (Based on Availability)
- 11.2.14 Buck Scientific
- 11.2.14.1. Overview
- 11.2.14.2. Products
- 11.2.14.3. SWOT Analysis
- 11.2.14.4. Recent Developments
- 11.2.14.5. Financials (Based on Availability)
- 11.2.15 I-Vigilant
- 11.2.15.1. Overview
- 11.2.15.2. Products
- 11.2.15.3. SWOT Analysis
- 11.2.15.4. Recent Developments
- 11.2.15.5. Financials (Based on Availability)
- 11.2.16 StillPeaks
- 11.2.16.1. Overview
- 11.2.16.2. Products
- 11.2.16.3. SWOT Analysis
- 11.2.16.4. Recent Developments
- 11.2.16.5. Financials (Based on Availability)
- 11.2.17 Chromperfect
- 11.2.17.1. Overview
- 11.2.17.2. Products
- 11.2.17.3. SWOT Analysis
- 11.2.17.4. Recent Developments
- 11.2.17.5. Financials (Based on Availability)
- 11.2.18 SpectralWorks
- 11.2.18.1. Overview
- 11.2.18.2. Products
- 11.2.18.3. SWOT Analysis
- 11.2.18.4. Recent Developments
- 11.2.18.5. Financials (Based on Availability)
- 11.2.19 Advanced Chemistry Development
- 11.2.19.1. Overview
- 11.2.19.2. Products
- 11.2.19.3. SWOT Analysis
- 11.2.19.4. Recent Developments
- 11.2.19.5. Financials (Based on Availability)
- 11.2.20 SepSolve Analytical
- 11.2.20.1. Overview
- 11.2.20.2. Products
- 11.2.20.3. SWOT Analysis
- 11.2.20.4. Recent Developments
- 11.2.20.5. Financials (Based on Availability)
- 11.2.21 H&A Scientific
- 11.2.21.1. Overview
- 11.2.21.2. Products
- 11.2.21.3. SWOT Analysis
- 11.2.21.4. Recent Developments
- 11.2.21.5. Financials (Based on Availability)
- 11.2.1 Shimadzu
List of Figures
- Figure 1: Global Gas Chromatography Gc Software Revenue Breakdown (million, %) by Region 2024 & 2032
- Figure 2: North America Gas Chromatography Gc Software Revenue (million), by Application 2024 & 2032
- Figure 3: North America Gas Chromatography Gc Software Revenue Share (%), by Application 2024 & 2032
- Figure 4: North America Gas Chromatography Gc Software Revenue (million), by Type 2024 & 2032
- Figure 5: North America Gas Chromatography Gc Software Revenue Share (%), by Type 2024 & 2032
- Figure 6: North America Gas Chromatography Gc Software Revenue (million), by Country 2024 & 2032
- Figure 7: North America Gas Chromatography Gc Software Revenue Share (%), by Country 2024 & 2032
- Figure 8: South America Gas Chromatography Gc Software Revenue (million), by Application 2024 & 2032
- Figure 9: South America Gas Chromatography Gc Software Revenue Share (%), by Application 2024 & 2032
- Figure 10: South America Gas Chromatography Gc Software Revenue (million), by Type 2024 & 2032
- Figure 11: South America Gas Chromatography Gc Software Revenue Share (%), by Type 2024 & 2032
- Figure 12: South America Gas Chromatography Gc Software Revenue (million), by Country 2024 & 2032
- Figure 13: South America Gas Chromatography Gc Software Revenue Share (%), by Country 2024 & 2032
- Figure 14: Europe Gas Chromatography Gc Software Revenue (million), by Application 2024 & 2032
- Figure 15: Europe Gas Chromatography Gc Software Revenue Share (%), by Application 2024 & 2032
- Figure 16: Europe Gas Chromatography Gc Software Revenue (million), by Type 2024 & 2032
- Figure 17: Europe Gas Chromatography Gc Software Revenue Share (%), by Type 2024 & 2032
- Figure 18: Europe Gas Chromatography Gc Software Revenue (million), by Country 2024 & 2032
- Figure 19: Europe Gas Chromatography Gc Software Revenue Share (%), by Country 2024 & 2032
- Figure 20: Middle East & Africa Gas Chromatography Gc Software Revenue (million), by Application 2024 & 2032
- Figure 21: Middle East & Africa Gas Chromatography Gc Software Revenue Share (%), by Application 2024 & 2032
- Figure 22: Middle East & Africa Gas Chromatography Gc Software Revenue (million), by Type 2024 & 2032
- Figure 23: Middle East & Africa Gas Chromatography Gc Software Revenue Share (%), by Type 2024 & 2032
- Figure 24: Middle East & Africa Gas Chromatography Gc Software Revenue (million), by Country 2024 & 2032
- Figure 25: Middle East & Africa Gas Chromatography Gc Software Revenue Share (%), by Country 2024 & 2032
- Figure 26: Asia Pacific Gas Chromatography Gc Software Revenue (million), by Application 2024 & 2032
- Figure 27: Asia Pacific Gas Chromatography Gc Software Revenue Share (%), by Application 2024 & 2032
- Figure 28: Asia Pacific Gas Chromatography Gc Software Revenue (million), by Type 2024 & 2032
- Figure 29: Asia Pacific Gas Chromatography Gc Software Revenue Share (%), by Type 2024 & 2032
- Figure 30: Asia Pacific Gas Chromatography Gc Software Revenue (million), by Country 2024 & 2032
- Figure 31: Asia Pacific Gas Chromatography Gc Software Revenue Share (%), by Country 2024 & 2032
List of Tables
- Table 1: Global Gas Chromatography Gc Software Revenue million Forecast, by Region 2019 & 2032
- Table 2: Global Gas Chromatography Gc Software Revenue million Forecast, by Application 2019 & 2032
- Table 3: Global Gas Chromatography Gc Software Revenue million Forecast, by Type 2019 & 2032
- Table 4: Global Gas Chromatography Gc Software Revenue million Forecast, by Region 2019 & 2032
- Table 5: Global Gas Chromatography Gc Software Revenue million Forecast, by Application 2019 & 2032
- Table 6: Global Gas Chromatography Gc Software Revenue million Forecast, by Type 2019 & 2032
- Table 7: Global Gas Chromatography Gc Software Revenue million Forecast, by Country 2019 & 2032
- Table 8: United States Gas Chromatography Gc Software Revenue (million) Forecast, by Application 2019 & 2032
- Table 9: Canada Gas Chromatography Gc Software Revenue (million) Forecast, by Application 2019 & 2032
- Table 10: Mexico Gas Chromatography Gc Software Revenue (million) Forecast, by Application 2019 & 2032
- Table 11: Global Gas Chromatography Gc Software Revenue million Forecast, by Application 2019 & 2032
- Table 12: Global Gas Chromatography Gc Software Revenue million Forecast, by Type 2019 & 2032
- Table 13: Global Gas Chromatography Gc Software Revenue million Forecast, by Country 2019 & 2032
- Table 14: Brazil Gas Chromatography Gc Software Revenue (million) Forecast, by Application 2019 & 2032
- Table 15: Argentina Gas Chromatography Gc Software Revenue (million) Forecast, by Application 2019 & 2032
- Table 16: Rest of South America Gas Chromatography Gc Software Revenue (million) Forecast, by Application 2019 & 2032
- Table 17: Global Gas Chromatography Gc Software Revenue million Forecast, by Application 2019 & 2032
- Table 18: Global Gas Chromatography Gc Software Revenue million Forecast, by Type 2019 & 2032
- Table 19: Global Gas Chromatography Gc Software Revenue million Forecast, by Country 2019 & 2032
- Table 20: United Kingdom Gas Chromatography Gc Software Revenue (million) Forecast, by Application 2019 & 2032
- Table 21: Germany Gas Chromatography Gc Software Revenue (million) Forecast, by Application 2019 & 2032
- Table 22: France Gas Chromatography Gc Software Revenue (million) Forecast, by Application 2019 & 2032
- Table 23: Italy Gas Chromatography Gc Software Revenue (million) Forecast, by Application 2019 & 2032
- Table 24: Spain Gas Chromatography Gc Software Revenue (million) Forecast, by Application 2019 & 2032
- Table 25: Russia Gas Chromatography Gc Software Revenue (million) Forecast, by Application 2019 & 2032
- Table 26: Benelux Gas Chromatography Gc Software Revenue (million) Forecast, by Application 2019 & 2032
- Table 27: Nordics Gas Chromatography Gc Software Revenue (million) Forecast, by Application 2019 & 2032
- Table 28: Rest of Europe Gas Chromatography Gc Software Revenue (million) Forecast, by Application 2019 & 2032
- Table 29: Global Gas Chromatography Gc Software Revenue million Forecast, by Application 2019 & 2032
- Table 30: Global Gas Chromatography Gc Software Revenue million Forecast, by Type 2019 & 2032
- Table 31: Global Gas Chromatography Gc Software Revenue million Forecast, by Country 2019 & 2032
- Table 32: Turkey Gas Chromatography Gc Software Revenue (million) Forecast, by Application 2019 & 2032
- Table 33: Israel Gas Chromatography Gc Software Revenue (million) Forecast, by Application 2019 & 2032
- Table 34: GCC Gas Chromatography Gc Software Revenue (million) Forecast, by Application 2019 & 2032
- Table 35: North Africa Gas Chromatography Gc Software Revenue (million) Forecast, by Application 2019 & 2032
- Table 36: South Africa Gas Chromatography Gc Software Revenue (million) Forecast, by Application 2019 & 2032
- Table 37: Rest of Middle East & Africa Gas Chromatography Gc Software Revenue (million) Forecast, by Application 2019 & 2032
- Table 38: Global Gas Chromatography Gc Software Revenue million Forecast, by Application 2019 & 2032
- Table 39: Global Gas Chromatography Gc Software Revenue million Forecast, by Type 2019 & 2032
- Table 40: Global Gas Chromatography Gc Software Revenue million Forecast, by Country 2019 & 2032
- Table 41: China Gas Chromatography Gc Software Revenue (million) Forecast, by Application 2019 & 2032
- Table 42: India Gas Chromatography Gc Software Revenue (million) Forecast, by Application 2019 & 2032
- Table 43: Japan Gas Chromatography Gc Software Revenue (million) Forecast, by Application 2019 & 2032
- Table 44: South Korea Gas Chromatography Gc Software Revenue (million) Forecast, by Application 2019 & 2032
- Table 45: ASEAN Gas Chromatography Gc Software Revenue (million) Forecast, by Application 2019 & 2032
- Table 46: Oceania Gas Chromatography Gc Software Revenue (million) Forecast, by Application 2019 & 2032
- Table 47: Rest of Asia Pacific Gas Chromatography Gc Software Revenue (million) Forecast, by Application 2019 & 2032
Frequently Asked Questions
1. What is the projected Compound Annual Growth Rate (CAGR) of the Gas Chromatography Gc Software?
The projected CAGR is approximately XXX%.
2. Which companies are prominent players in the Gas Chromatography Gc Software?
Key companies in the market include Shimadzu, Agilent Technologies, LDetek, PerkinElmer, DataApex, Thermo Fisher Scientific, AMETEK MOCON, Emerson Electric, SCION Instruments, UniChrom, Siemens, Waters, SRI Instruments, Buck Scientific, I-Vigilant, StillPeaks, Chromperfect, SpectralWorks, Advanced Chemistry Development, SepSolve Analytical, H&A Scientific.
3. What are the main segments of the Gas Chromatography Gc Software?
The market segments include Application, Type.
4. Can you provide details about the market size?
The market size is estimated to be USD XXX million as of 2022.
5. What are some drivers contributing to market growth?
N/A
6. What are the notable trends driving market growth?
N/A
7. Are there any restraints impacting market growth?
N/A
8. Can you provide examples of recent developments in the market?
N/A
9. What pricing options are available for accessing the report?
Pricing options include single-user, multi-user, and enterprise licenses priced at USD 2900.00, USD 4350.00, and USD 5800.00 respectively.
10. Is the market size provided in terms of value or volume?
The market size is provided in terms of value, measured in million.
11. Are there any specific market keywords associated with the report?
Yes, the market keyword associated with the report is "Gas Chromatography Gc Software," which aids in identifying and referencing the specific market segment covered.
12. How do I determine which pricing option suits my needs best?
The pricing options vary based on user requirements and access needs. Individual users may opt for single-user licenses, while businesses requiring broader access may choose multi-user or enterprise licenses for cost-effective access to the report.
13. Are there any additional resources or data provided in the Gas Chromatography Gc Software report?
While the report offers comprehensive insights, it's advisable to review the specific contents or supplementary materials provided to ascertain if additional resources or data are available.
14. How can I stay updated on further developments or reports in the Gas Chromatography Gc Software?
To stay informed about further developments, trends, and reports in the Gas Chromatography Gc Software, consider subscribing to industry newsletters, following relevant companies and organizations, or regularly checking reputable industry news sources and publications.
Methodology
Step 1 - Identification of Relevant Samples Size from Population Database


Step 2 - Approaches for Defining Global Market Size (Value, Volume* & Price*)

Note*: In applicable scenarios
Step 3 - Data Sources
Primary Research
- Web Analytics
- Survey Reports
- Research Institute
- Latest Research Reports
- Opinion Leaders
Secondary Research
- Annual Reports
- White Paper
- Latest Press Release
- Industry Association
- Paid Database
- Investor Presentations

Step 4 - Data Triangulation
Involves using different sources of information in order to increase the validity of a study
These sources are likely to be stakeholders in a program - participants, other researchers, program staff, other community members, and so on.
Then we put all data in single framework & apply various statistical tools to find out the dynamic on the market.
During the analysis stage, feedback from the stakeholder groups would be compared to determine areas of agreement as well as areas of divergence
