

Key Insights
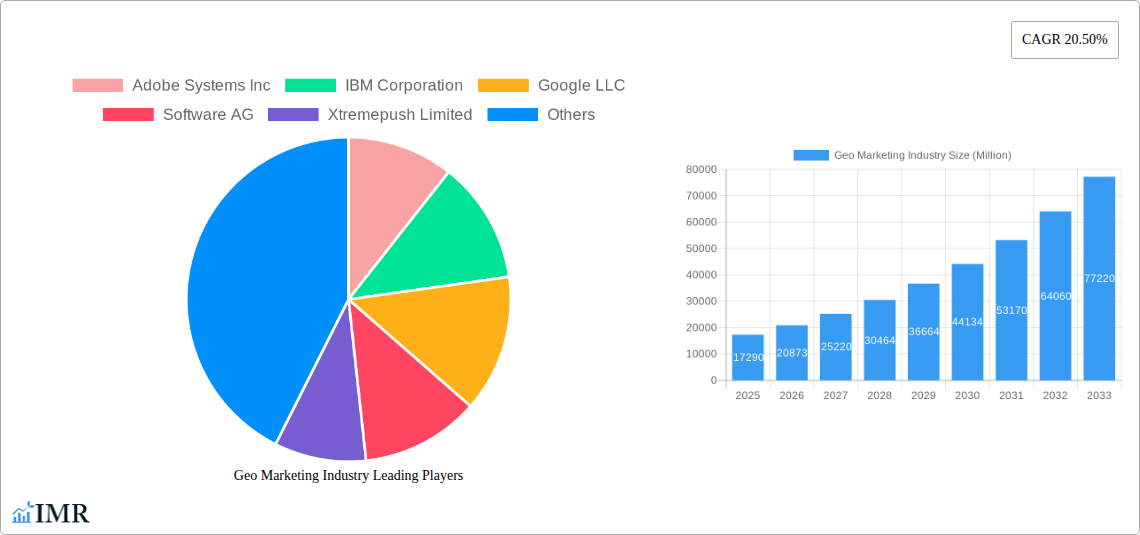
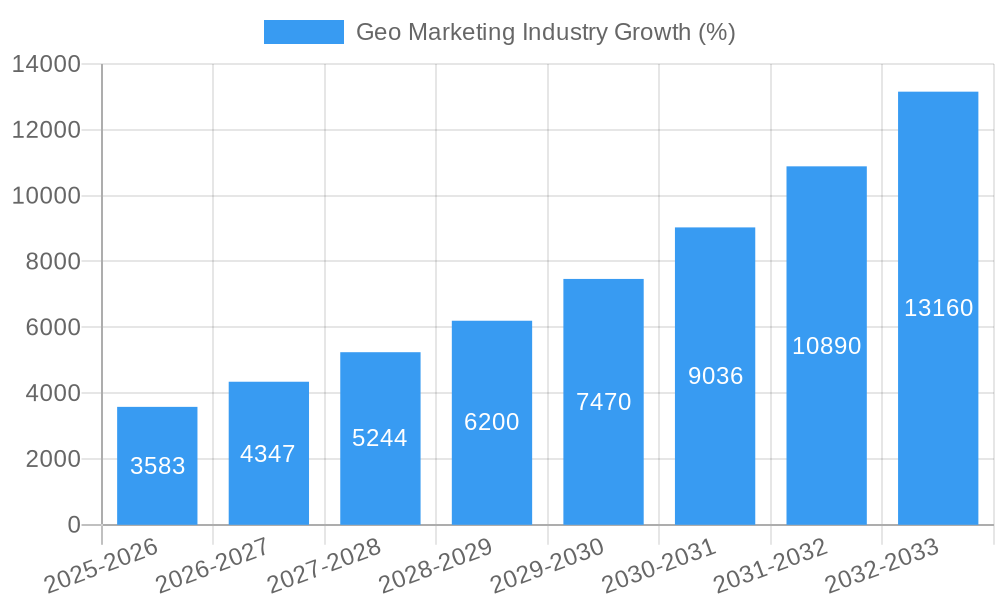
The geospatial marketing industry, valued at $17.29 billion in 2025, is experiencing robust growth, projected to expand at a compound annual growth rate (CAGR) of 20.50% from 2025 to 2033. This expansion is fueled by several key drivers. The increasing adoption of location-based services and mobile devices provides marketers with unprecedented opportunities to target consumers with personalized, contextually relevant advertisements. Furthermore, the rise of big data analytics and advanced geospatial technologies enables more precise audience segmentation and campaign optimization. Businesses are increasingly recognizing the value of understanding customer location data to improve marketing ROI and enhance customer experiences. The prevalence of cloud-based solutions simplifies deployment and accessibility, fostering wider adoption across various industry segments. While data privacy concerns and the complexities of integrating geospatial data into existing marketing workflows present challenges, the overall market trajectory remains strongly positive.
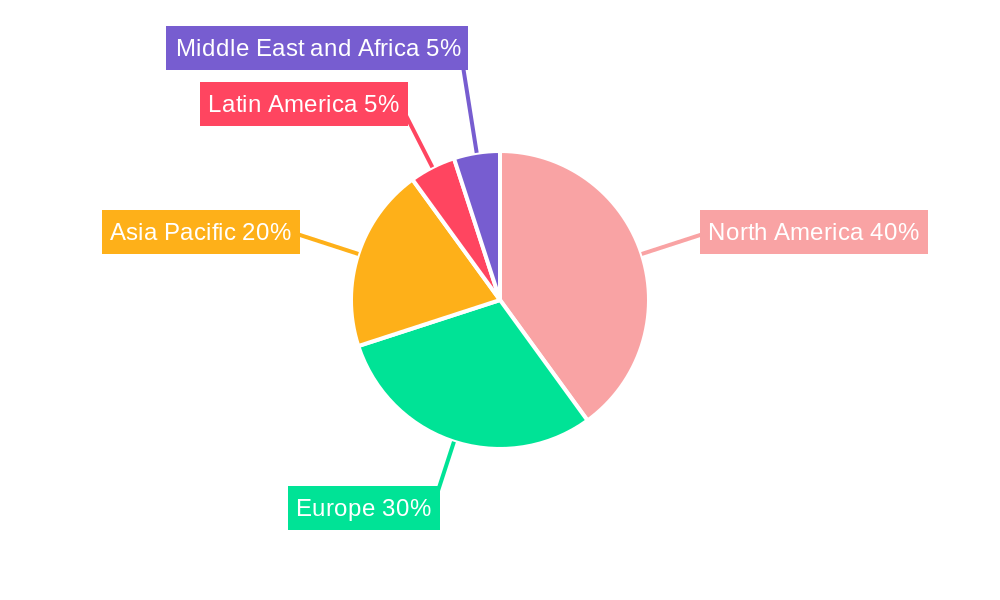
This growth is evident across different segments. The software component is expected to dominate, driven by the increasing sophistication of location-based marketing platforms. Cloud-based deployment models are witnessing faster adoption due to their scalability and cost-effectiveness compared to on-premise solutions. The BFSI (Banking, Financial Services, and Insurance), IT and Telecommunications, and Retail and E-commerce sectors are major end-user industries driving demand, leveraging geospatial data for targeted advertising, customer acquisition, and optimized branch/store location strategies. While North America currently holds a significant market share, the Asia-Pacific region is anticipated to witness the fastest growth due to rapid technological advancements and increasing smartphone penetration. The competitive landscape is characterized by a mix of established technology companies and specialized geospatial marketing firms, all vying to offer innovative solutions and capture market share.
Geo Marketing Industry Market Report: 2019-2033
This comprehensive report delivers an in-depth analysis of the Geo Marketing industry, providing invaluable insights for businesses, investors, and industry professionals. The report covers the period 2019-2033, with a focus on the estimated year 2025, and forecasts extending to 2033. The analysis encompasses various segments, including software, services, cloud and on-premise deployment, indoor and outdoor location-based marketing, and a diverse range of end-user industries. The market size is projected to reach xx Million by 2033, presenting significant growth opportunities.
Geo Marketing Industry Market Dynamics & Structure
The Geo Marketing industry is experiencing robust growth driven by technological advancements, increasing adoption of location-based services, and the rising need for targeted advertising. Market concentration is moderate, with several major players holding significant shares, but also ample space for smaller, specialized firms. Technological innovation, particularly in areas like AI-powered location analytics and improved data integration, is a primary driver. Regulatory frameworks regarding data privacy and consumer consent continue to evolve, impacting market strategies. Competitive product substitutes include traditional advertising methods, however, the effectiveness and measurable ROI of geo-marketing is creating strong market growth. End-user demographics are diverse, spanning businesses of all sizes across various sectors. M&A activity is moderate; however, strategic acquisitions continue to reshape the industry landscape, with a projected xx deals over the forecast period.
- Market Concentration: Moderately concentrated, with top 5 players holding approximately xx% market share in 2025.
- Technological Innovation: Key drivers include AI-powered analytics, improved data integration, and enhanced location tracking technologies.
- Regulatory Frameworks: Evolving data privacy regulations (e.g., GDPR, CCPA) present both challenges and opportunities.
- Competitive Substitutes: Traditional advertising, but Geo-marketing presents superior targeting and measurability.
- M&A Activity: Approximately xx deals projected between 2025 and 2033, consolidating market share and driving innovation.
Geo Marketing Industry Growth Trends & Insights
The Geo Marketing market has exhibited strong growth throughout the historical period (2019-2024), with a Compound Annual Growth Rate (CAGR) of xx%. This growth is anticipated to continue through the forecast period (2025-2033), driven by increased adoption of location-based services, coupled with advancements in data analytics and mobile technology. Market penetration is currently at xx% and is projected to reach xx% by 2033. The rising popularity of mobile devices, increased availability of location data, and the growing demand for personalized marketing campaigns are key factors driving market expansion. The shift towards cloud-based solutions is further accelerating growth, providing scalability and cost-effectiveness to businesses. Consumer behavior shifts, such as increased reliance on mobile devices and willingness to share location data for personalized experiences, are fueling this market expansion.
Dominant Regions, Countries, or Segments in Geo Marketing Industry
North America currently dominates the Geo Marketing market, holding approximately xx% of the market share in 2025, driven by strong technological advancements and high adoption rates across various end-user industries. Europe and Asia Pacific are also experiencing substantial growth, driven by expanding digital infrastructure and increasing mobile penetration.
By Component:
- Software: Holds the largest market share in 2025, at approximately xx%, due to the increasing demand for sophisticated analytical tools.
- Services: The services segment shows high growth potential with a projected CAGR of xx% during the forecast period driven by the need for customized geo-marketing solutions.
By Deployment:
- Cloud: Rapidly growing with a projected CAGR of xx% during the forecast period, driven by scalability, cost-effectiveness, and ease of access.
- On-Premise: Maintains a significant market share, particularly among larger enterprises with stringent data security requirements.
By Location:
- Outdoor: Holds a larger market share than indoor due to wider applications in areas like retail, transportation, and urban planning.
- Indoor: Growing significantly with a projected CAGR of xx% due to increasing application in retail analytics and smart building management.
By End-User Industry:
- Retail and E-commerce: Remains the largest segment, driven by the need for targeted customer engagement and optimized store placement.
- BFSI: Significant growth in adoption of geo-marketing for targeted financial services and branch optimization.
Geo Marketing Industry Product Landscape
The Geo Marketing industry offers a diverse range of products and services, from basic location-based advertising platforms to sophisticated AI-powered analytics solutions. Products are characterized by increasing sophistication in data analysis capabilities, user-friendly interfaces, and seamless integration with other business systems. Key features include real-time location tracking, advanced geofencing capabilities, detailed analytics dashboards, and predictive modeling for optimized campaign performance. Innovative offerings incorporate AI and machine learning for personalized marketing, predictive analytics, and improved customer experience.
Key Drivers, Barriers & Challenges in Geo Marketing Industry
Key Drivers:
- Increasing adoption of mobile devices and location-based services.
- Growing demand for personalized marketing experiences.
- Advancements in data analytics and AI-powered location intelligence.
- Rising investment in digital infrastructure and expansion of internet penetration.
Challenges & Restraints:
- Data privacy concerns and regulatory hurdles (e.g., GDPR, CCPA). These impact data collection and usage, leading to increased costs and complexity in campaign development. The impact is estimated to reduce market growth by approximately xx% by 2030.
- High implementation costs and integration complexities for some solutions, particularly for smaller businesses.
- Competition from traditional advertising methods and other digital marketing strategies.
Emerging Opportunities in Geo Marketing Industry
- Expanding application in emerging markets with high mobile penetration.
- Growth in the use of geo-marketing for customer loyalty programs and personalized offers.
- Increased adoption of geo-marketing in the healthcare industry for targeted public health campaigns.
- Development of more sophisticated AI-powered tools for predictive analytics and campaign optimization.
Growth Accelerators in the Geo Marketing Industry
Technological advancements, particularly in AI and machine learning, are playing a crucial role in driving long-term growth. Strategic partnerships between technology providers and marketing agencies are streamlining service delivery and enhancing the value proposition. Market expansion into new geographic regions and end-user industries, fueled by increasing digitalization and mobile adoption, is also contributing to sustainable growth.
Key Players Shaping the Geo Marketing Industry Market
- Adobe Systems Inc
- IBM Corporation
- Google LLC
- Software AG
- Xtremepush Limited
- Cisco Systems Inc
- Microsoft Corporation
- Ericsson Inc
- Oracle Corporation
- ESRI Business Information Solutions Inc
- Qualcomm Inc
Notable Milestones in Geo Marketing Industry Sector
- Jan 2023: MapZot.AI launches mobile location data platform, enhancing foot traffic analysis for businesses. This launch significantly improved the accessibility of location analytics to smaller businesses, driving market expansion in the SME segment.
- Apr 2022: Precisely introduces new geo-addressing capabilities, improving data accuracy and expanding its global reach. This improved the efficiency and reliability of address verification and data cleansing processes, benefiting businesses across various sectors.
In-Depth Geo Marketing Industry Market Outlook
The Geo Marketing industry is poised for sustained growth, driven by technological innovation, increased demand for personalized marketing, and expansion into new markets. The focus on data privacy and security will continue to shape market dynamics, while strategic partnerships and market consolidation will play a key role in future market development. Emerging applications in areas like smart cities, supply chain optimization, and public health management present significant opportunities for market expansion and innovation. The market is expected to see continuous improvement in the accuracy and accessibility of location data, as well as further refinement of analytical tools and user interfaces.
Geo Marketing Industry Segmentation
-
1. Components
- 1.1. Software
- 1.2. Services
-
2. Deployment
- 2.1. Cloud
- 2.2. On-Premise
-
3. Location
- 3.1. Indoor
- 3.2. Outdoor
-
4. End-User Industry
- 4.1. BFSI
- 4.2. IT and Telecommunications
- 4.3. Retail and E-commerce
- 4.4. Media and Entertainment
- 4.5. Travel and Hospitality
- 4.6. Other End-user Industries
Geo Marketing Industry Segmentation By Geography
- 1. North America
- 2. Europe
- 3. Asia Pacific
- 4. Latin America
- 5. Middle East and Africa
Geo Marketing Industry REPORT HIGHLIGHTS
| Aspects | Details |
|---|---|
| Study Period | 2019-2033 |
| Base Year | 2024 |
| Estimated Year | 2025 |
| Forecast Period | 2025-2033 |
| Historical Period | 2019-2024 |
| Growth Rate | CAGR of 20.50% from 2019-2033 |
| Segmentation |
|
Table of Contents
- 1. Introduction
- 1.1. Research Scope
- 1.2. Market Segmentation
- 1.3. Research Methodology
- 1.4. Definitions and Assumptions
- 2. Executive Summary
- 2.1. Introduction
- 3. Market Dynamics
- 3.1. Introduction
- 3.2. Market Drivers
- 3.2.1. Increasing Adoption of Emerging Technologies in Marketing Sector; Increasing Demand for Location-Based Intelligence to Enhance the Business Revenue
- 3.3. Market Restrains
- 3.3.1. Increasing Security and Privacy Concerns Among Enterprises
- 3.4. Market Trends
- 3.4.1. Services Components Segment is Expected to Hold Significant Market Share
- 4. Market Factor Analysis
- 4.1. Porters Five Forces
- 4.2. Supply/Value Chain
- 4.3. PESTEL analysis
- 4.4. Market Entropy
- 4.5. Patent/Trademark Analysis
- 5. Global Geo Marketing Industry Analysis, Insights and Forecast, 2019-2031
- 5.1. Market Analysis, Insights and Forecast - by Components
- 5.1.1. Software
- 5.1.2. Services
- 5.2. Market Analysis, Insights and Forecast - by Deployment
- 5.2.1. Cloud
- 5.2.2. On-Premise
- 5.3. Market Analysis, Insights and Forecast - by Location
- 5.3.1. Indoor
- 5.3.2. Outdoor
- 5.4. Market Analysis, Insights and Forecast - by End-User Industry
- 5.4.1. BFSI
- 5.4.2. IT and Telecommunications
- 5.4.3. Retail and E-commerce
- 5.4.4. Media and Entertainment
- 5.4.5. Travel and Hospitality
- 5.4.6. Other End-user Industries
- 5.5. Market Analysis, Insights and Forecast - by Region
- 5.5.1. North America
- 5.5.2. Europe
- 5.5.3. Asia Pacific
- 5.5.4. Latin America
- 5.5.5. Middle East and Africa
- 5.1. Market Analysis, Insights and Forecast - by Components
- 6. North America Geo Marketing Industry Analysis, Insights and Forecast, 2019-2031
- 6.1. Market Analysis, Insights and Forecast - by Components
- 6.1.1. Software
- 6.1.2. Services
- 6.2. Market Analysis, Insights and Forecast - by Deployment
- 6.2.1. Cloud
- 6.2.2. On-Premise
- 6.3. Market Analysis, Insights and Forecast - by Location
- 6.3.1. Indoor
- 6.3.2. Outdoor
- 6.4. Market Analysis, Insights and Forecast - by End-User Industry
- 6.4.1. BFSI
- 6.4.2. IT and Telecommunications
- 6.4.3. Retail and E-commerce
- 6.4.4. Media and Entertainment
- 6.4.5. Travel and Hospitality
- 6.4.6. Other End-user Industries
- 6.1. Market Analysis, Insights and Forecast - by Components
- 7. Europe Geo Marketing Industry Analysis, Insights and Forecast, 2019-2031
- 7.1. Market Analysis, Insights and Forecast - by Components
- 7.1.1. Software
- 7.1.2. Services
- 7.2. Market Analysis, Insights and Forecast - by Deployment
- 7.2.1. Cloud
- 7.2.2. On-Premise
- 7.3. Market Analysis, Insights and Forecast - by Location
- 7.3.1. Indoor
- 7.3.2. Outdoor
- 7.4. Market Analysis, Insights and Forecast - by End-User Industry
- 7.4.1. BFSI
- 7.4.2. IT and Telecommunications
- 7.4.3. Retail and E-commerce
- 7.4.4. Media and Entertainment
- 7.4.5. Travel and Hospitality
- 7.4.6. Other End-user Industries
- 7.1. Market Analysis, Insights and Forecast - by Components
- 8. Asia Pacific Geo Marketing Industry Analysis, Insights and Forecast, 2019-2031
- 8.1. Market Analysis, Insights and Forecast - by Components
- 8.1.1. Software
- 8.1.2. Services
- 8.2. Market Analysis, Insights and Forecast - by Deployment
- 8.2.1. Cloud
- 8.2.2. On-Premise
- 8.3. Market Analysis, Insights and Forecast - by Location
- 8.3.1. Indoor
- 8.3.2. Outdoor
- 8.4. Market Analysis, Insights and Forecast - by End-User Industry
- 8.4.1. BFSI
- 8.4.2. IT and Telecommunications
- 8.4.3. Retail and E-commerce
- 8.4.4. Media and Entertainment
- 8.4.5. Travel and Hospitality
- 8.4.6. Other End-user Industries
- 8.1. Market Analysis, Insights and Forecast - by Components
- 9. Latin America Geo Marketing Industry Analysis, Insights and Forecast, 2019-2031
- 9.1. Market Analysis, Insights and Forecast - by Components
- 9.1.1. Software
- 9.1.2. Services
- 9.2. Market Analysis, Insights and Forecast - by Deployment
- 9.2.1. Cloud
- 9.2.2. On-Premise
- 9.3. Market Analysis, Insights and Forecast - by Location
- 9.3.1. Indoor
- 9.3.2. Outdoor
- 9.4. Market Analysis, Insights and Forecast - by End-User Industry
- 9.4.1. BFSI
- 9.4.2. IT and Telecommunications
- 9.4.3. Retail and E-commerce
- 9.4.4. Media and Entertainment
- 9.4.5. Travel and Hospitality
- 9.4.6. Other End-user Industries
- 9.1. Market Analysis, Insights and Forecast - by Components
- 10. Middle East and Africa Geo Marketing Industry Analysis, Insights and Forecast, 2019-2031
- 10.1. Market Analysis, Insights and Forecast - by Components
- 10.1.1. Software
- 10.1.2. Services
- 10.2. Market Analysis, Insights and Forecast - by Deployment
- 10.2.1. Cloud
- 10.2.2. On-Premise
- 10.3. Market Analysis, Insights and Forecast - by Location
- 10.3.1. Indoor
- 10.3.2. Outdoor
- 10.4. Market Analysis, Insights and Forecast - by End-User Industry
- 10.4.1. BFSI
- 10.4.2. IT and Telecommunications
- 10.4.3. Retail and E-commerce
- 10.4.4. Media and Entertainment
- 10.4.5. Travel and Hospitality
- 10.4.6. Other End-user Industries
- 10.1. Market Analysis, Insights and Forecast - by Components
- 11. North America Geo Marketing Industry Analysis, Insights and Forecast, 2019-2031
- 11.1. Market Analysis, Insights and Forecast - By Country/Sub-region
- 11.1.1.
- 12. Europe Geo Marketing Industry Analysis, Insights and Forecast, 2019-2031
- 12.1. Market Analysis, Insights and Forecast - By Country/Sub-region
- 12.1.1.
- 13. Asia Pacific Geo Marketing Industry Analysis, Insights and Forecast, 2019-2031
- 13.1. Market Analysis, Insights and Forecast - By Country/Sub-region
- 13.1.1.
- 14. Latin America Geo Marketing Industry Analysis, Insights and Forecast, 2019-2031
- 14.1. Market Analysis, Insights and Forecast - By Country/Sub-region
- 14.1.1.
- 15. Middle East and Africa Geo Marketing Industry Analysis, Insights and Forecast, 2019-2031
- 15.1. Market Analysis, Insights and Forecast - By Country/Sub-region
- 15.1.1.
- 16. Competitive Analysis
- 16.1. Global Market Share Analysis 2024
- 16.2. Company Profiles
- 16.2.1 Adobe Systems Inc
- 16.2.1.1. Overview
- 16.2.1.2. Products
- 16.2.1.3. SWOT Analysis
- 16.2.1.4. Recent Developments
- 16.2.1.5. Financials (Based on Availability)
- 16.2.2 IBM Corporation
- 16.2.2.1. Overview
- 16.2.2.2. Products
- 16.2.2.3. SWOT Analysis
- 16.2.2.4. Recent Developments
- 16.2.2.5. Financials (Based on Availability)
- 16.2.3 Google LLC
- 16.2.3.1. Overview
- 16.2.3.2. Products
- 16.2.3.3. SWOT Analysis
- 16.2.3.4. Recent Developments
- 16.2.3.5. Financials (Based on Availability)
- 16.2.4 Software AG
- 16.2.4.1. Overview
- 16.2.4.2. Products
- 16.2.4.3. SWOT Analysis
- 16.2.4.4. Recent Developments
- 16.2.4.5. Financials (Based on Availability)
- 16.2.5 Xtremepush Limited
- 16.2.5.1. Overview
- 16.2.5.2. Products
- 16.2.5.3. SWOT Analysis
- 16.2.5.4. Recent Developments
- 16.2.5.5. Financials (Based on Availability)
- 16.2.6 Cisco Systems Inc
- 16.2.6.1. Overview
- 16.2.6.2. Products
- 16.2.6.3. SWOT Analysis
- 16.2.6.4. Recent Developments
- 16.2.6.5. Financials (Based on Availability)
- 16.2.7 Microsoft Corporation
- 16.2.7.1. Overview
- 16.2.7.2. Products
- 16.2.7.3. SWOT Analysis
- 16.2.7.4. Recent Developments
- 16.2.7.5. Financials (Based on Availability)
- 16.2.8 Ericsson Inc
- 16.2.8.1. Overview
- 16.2.8.2. Products
- 16.2.8.3. SWOT Analysis
- 16.2.8.4. Recent Developments
- 16.2.8.5. Financials (Based on Availability)
- 16.2.9 Oracle Corporation
- 16.2.9.1. Overview
- 16.2.9.2. Products
- 16.2.9.3. SWOT Analysis
- 16.2.9.4. Recent Developments
- 16.2.9.5. Financials (Based on Availability)
- 16.2.10 ESRI Business Information Solutions Inc
- 16.2.10.1. Overview
- 16.2.10.2. Products
- 16.2.10.3. SWOT Analysis
- 16.2.10.4. Recent Developments
- 16.2.10.5. Financials (Based on Availability)
- 16.2.11 Qualcomm Inc
- 16.2.11.1. Overview
- 16.2.11.2. Products
- 16.2.11.3. SWOT Analysis
- 16.2.11.4. Recent Developments
- 16.2.11.5. Financials (Based on Availability)
- 16.2.1 Adobe Systems Inc
List of Figures
- Figure 1: Global Geo Marketing Industry Revenue Breakdown (Million, %) by Region 2024 & 2032
- Figure 2: North America Geo Marketing Industry Revenue (Million), by Country 2024 & 2032
- Figure 3: North America Geo Marketing Industry Revenue Share (%), by Country 2024 & 2032
- Figure 4: Europe Geo Marketing Industry Revenue (Million), by Country 2024 & 2032
- Figure 5: Europe Geo Marketing Industry Revenue Share (%), by Country 2024 & 2032
- Figure 6: Asia Pacific Geo Marketing Industry Revenue (Million), by Country 2024 & 2032
- Figure 7: Asia Pacific Geo Marketing Industry Revenue Share (%), by Country 2024 & 2032
- Figure 8: Latin America Geo Marketing Industry Revenue (Million), by Country 2024 & 2032
- Figure 9: Latin America Geo Marketing Industry Revenue Share (%), by Country 2024 & 2032
- Figure 10: Middle East and Africa Geo Marketing Industry Revenue (Million), by Country 2024 & 2032
- Figure 11: Middle East and Africa Geo Marketing Industry Revenue Share (%), by Country 2024 & 2032
- Figure 12: North America Geo Marketing Industry Revenue (Million), by Components 2024 & 2032
- Figure 13: North America Geo Marketing Industry Revenue Share (%), by Components 2024 & 2032
- Figure 14: North America Geo Marketing Industry Revenue (Million), by Deployment 2024 & 2032
- Figure 15: North America Geo Marketing Industry Revenue Share (%), by Deployment 2024 & 2032
- Figure 16: North America Geo Marketing Industry Revenue (Million), by Location 2024 & 2032
- Figure 17: North America Geo Marketing Industry Revenue Share (%), by Location 2024 & 2032
- Figure 18: North America Geo Marketing Industry Revenue (Million), by End-User Industry 2024 & 2032
- Figure 19: North America Geo Marketing Industry Revenue Share (%), by End-User Industry 2024 & 2032
- Figure 20: North America Geo Marketing Industry Revenue (Million), by Country 2024 & 2032
- Figure 21: North America Geo Marketing Industry Revenue Share (%), by Country 2024 & 2032
- Figure 22: Europe Geo Marketing Industry Revenue (Million), by Components 2024 & 2032
- Figure 23: Europe Geo Marketing Industry Revenue Share (%), by Components 2024 & 2032
- Figure 24: Europe Geo Marketing Industry Revenue (Million), by Deployment 2024 & 2032
- Figure 25: Europe Geo Marketing Industry Revenue Share (%), by Deployment 2024 & 2032
- Figure 26: Europe Geo Marketing Industry Revenue (Million), by Location 2024 & 2032
- Figure 27: Europe Geo Marketing Industry Revenue Share (%), by Location 2024 & 2032
- Figure 28: Europe Geo Marketing Industry Revenue (Million), by End-User Industry 2024 & 2032
- Figure 29: Europe Geo Marketing Industry Revenue Share (%), by End-User Industry 2024 & 2032
- Figure 30: Europe Geo Marketing Industry Revenue (Million), by Country 2024 & 2032
- Figure 31: Europe Geo Marketing Industry Revenue Share (%), by Country 2024 & 2032
- Figure 32: Asia Pacific Geo Marketing Industry Revenue (Million), by Components 2024 & 2032
- Figure 33: Asia Pacific Geo Marketing Industry Revenue Share (%), by Components 2024 & 2032
- Figure 34: Asia Pacific Geo Marketing Industry Revenue (Million), by Deployment 2024 & 2032
- Figure 35: Asia Pacific Geo Marketing Industry Revenue Share (%), by Deployment 2024 & 2032
- Figure 36: Asia Pacific Geo Marketing Industry Revenue (Million), by Location 2024 & 2032
- Figure 37: Asia Pacific Geo Marketing Industry Revenue Share (%), by Location 2024 & 2032
- Figure 38: Asia Pacific Geo Marketing Industry Revenue (Million), by End-User Industry 2024 & 2032
- Figure 39: Asia Pacific Geo Marketing Industry Revenue Share (%), by End-User Industry 2024 & 2032
- Figure 40: Asia Pacific Geo Marketing Industry Revenue (Million), by Country 2024 & 2032
- Figure 41: Asia Pacific Geo Marketing Industry Revenue Share (%), by Country 2024 & 2032
- Figure 42: Latin America Geo Marketing Industry Revenue (Million), by Components 2024 & 2032
- Figure 43: Latin America Geo Marketing Industry Revenue Share (%), by Components 2024 & 2032
- Figure 44: Latin America Geo Marketing Industry Revenue (Million), by Deployment 2024 & 2032
- Figure 45: Latin America Geo Marketing Industry Revenue Share (%), by Deployment 2024 & 2032
- Figure 46: Latin America Geo Marketing Industry Revenue (Million), by Location 2024 & 2032
- Figure 47: Latin America Geo Marketing Industry Revenue Share (%), by Location 2024 & 2032
- Figure 48: Latin America Geo Marketing Industry Revenue (Million), by End-User Industry 2024 & 2032
- Figure 49: Latin America Geo Marketing Industry Revenue Share (%), by End-User Industry 2024 & 2032
- Figure 50: Latin America Geo Marketing Industry Revenue (Million), by Country 2024 & 2032
- Figure 51: Latin America Geo Marketing Industry Revenue Share (%), by Country 2024 & 2032
- Figure 52: Middle East and Africa Geo Marketing Industry Revenue (Million), by Components 2024 & 2032
- Figure 53: Middle East and Africa Geo Marketing Industry Revenue Share (%), by Components 2024 & 2032
- Figure 54: Middle East and Africa Geo Marketing Industry Revenue (Million), by Deployment 2024 & 2032
- Figure 55: Middle East and Africa Geo Marketing Industry Revenue Share (%), by Deployment 2024 & 2032
- Figure 56: Middle East and Africa Geo Marketing Industry Revenue (Million), by Location 2024 & 2032
- Figure 57: Middle East and Africa Geo Marketing Industry Revenue Share (%), by Location 2024 & 2032
- Figure 58: Middle East and Africa Geo Marketing Industry Revenue (Million), by End-User Industry 2024 & 2032
- Figure 59: Middle East and Africa Geo Marketing Industry Revenue Share (%), by End-User Industry 2024 & 2032
- Figure 60: Middle East and Africa Geo Marketing Industry Revenue (Million), by Country 2024 & 2032
- Figure 61: Middle East and Africa Geo Marketing Industry Revenue Share (%), by Country 2024 & 2032
List of Tables
- Table 1: Global Geo Marketing Industry Revenue Million Forecast, by Region 2019 & 2032
- Table 2: Global Geo Marketing Industry Revenue Million Forecast, by Components 2019 & 2032
- Table 3: Global Geo Marketing Industry Revenue Million Forecast, by Deployment 2019 & 2032
- Table 4: Global Geo Marketing Industry Revenue Million Forecast, by Location 2019 & 2032
- Table 5: Global Geo Marketing Industry Revenue Million Forecast, by End-User Industry 2019 & 2032
- Table 6: Global Geo Marketing Industry Revenue Million Forecast, by Region 2019 & 2032
- Table 7: Global Geo Marketing Industry Revenue Million Forecast, by Country 2019 & 2032
- Table 8: Geo Marketing Industry Revenue (Million) Forecast, by Application 2019 & 2032
- Table 9: Global Geo Marketing Industry Revenue Million Forecast, by Country 2019 & 2032
- Table 10: Geo Marketing Industry Revenue (Million) Forecast, by Application 2019 & 2032
- Table 11: Global Geo Marketing Industry Revenue Million Forecast, by Country 2019 & 2032
- Table 12: Geo Marketing Industry Revenue (Million) Forecast, by Application 2019 & 2032
- Table 13: Global Geo Marketing Industry Revenue Million Forecast, by Country 2019 & 2032
- Table 14: Geo Marketing Industry Revenue (Million) Forecast, by Application 2019 & 2032
- Table 15: Global Geo Marketing Industry Revenue Million Forecast, by Country 2019 & 2032
- Table 16: Geo Marketing Industry Revenue (Million) Forecast, by Application 2019 & 2032
- Table 17: Global Geo Marketing Industry Revenue Million Forecast, by Components 2019 & 2032
- Table 18: Global Geo Marketing Industry Revenue Million Forecast, by Deployment 2019 & 2032
- Table 19: Global Geo Marketing Industry Revenue Million Forecast, by Location 2019 & 2032
- Table 20: Global Geo Marketing Industry Revenue Million Forecast, by End-User Industry 2019 & 2032
- Table 21: Global Geo Marketing Industry Revenue Million Forecast, by Country 2019 & 2032
- Table 22: Global Geo Marketing Industry Revenue Million Forecast, by Components 2019 & 2032
- Table 23: Global Geo Marketing Industry Revenue Million Forecast, by Deployment 2019 & 2032
- Table 24: Global Geo Marketing Industry Revenue Million Forecast, by Location 2019 & 2032
- Table 25: Global Geo Marketing Industry Revenue Million Forecast, by End-User Industry 2019 & 2032
- Table 26: Global Geo Marketing Industry Revenue Million Forecast, by Country 2019 & 2032
- Table 27: Global Geo Marketing Industry Revenue Million Forecast, by Components 2019 & 2032
- Table 28: Global Geo Marketing Industry Revenue Million Forecast, by Deployment 2019 & 2032
- Table 29: Global Geo Marketing Industry Revenue Million Forecast, by Location 2019 & 2032
- Table 30: Global Geo Marketing Industry Revenue Million Forecast, by End-User Industry 2019 & 2032
- Table 31: Global Geo Marketing Industry Revenue Million Forecast, by Country 2019 & 2032
- Table 32: Global Geo Marketing Industry Revenue Million Forecast, by Components 2019 & 2032
- Table 33: Global Geo Marketing Industry Revenue Million Forecast, by Deployment 2019 & 2032
- Table 34: Global Geo Marketing Industry Revenue Million Forecast, by Location 2019 & 2032
- Table 35: Global Geo Marketing Industry Revenue Million Forecast, by End-User Industry 2019 & 2032
- Table 36: Global Geo Marketing Industry Revenue Million Forecast, by Country 2019 & 2032
- Table 37: Global Geo Marketing Industry Revenue Million Forecast, by Components 2019 & 2032
- Table 38: Global Geo Marketing Industry Revenue Million Forecast, by Deployment 2019 & 2032
- Table 39: Global Geo Marketing Industry Revenue Million Forecast, by Location 2019 & 2032
- Table 40: Global Geo Marketing Industry Revenue Million Forecast, by End-User Industry 2019 & 2032
- Table 41: Global Geo Marketing Industry Revenue Million Forecast, by Country 2019 & 2032
Frequently Asked Questions
1. What is the projected Compound Annual Growth Rate (CAGR) of the Geo Marketing Industry?
The projected CAGR is approximately 20.50%.
2. Which companies are prominent players in the Geo Marketing Industry?
Key companies in the market include Adobe Systems Inc, IBM Corporation, Google LLC, Software AG, Xtremepush Limited, Cisco Systems Inc, Microsoft Corporation, Ericsson Inc, Oracle Corporation, ESRI Business Information Solutions Inc, Qualcomm Inc.
3. What are the main segments of the Geo Marketing Industry?
The market segments include Components, Deployment, Location, End-User Industry.
4. Can you provide details about the market size?
The market size is estimated to be USD 17.29 Million as of 2022.
5. What are some drivers contributing to market growth?
Increasing Adoption of Emerging Technologies in Marketing Sector; Increasing Demand for Location-Based Intelligence to Enhance the Business Revenue.
6. What are the notable trends driving market growth?
Services Components Segment is Expected to Hold Significant Market Share.
7. Are there any restraints impacting market growth?
Increasing Security and Privacy Concerns Among Enterprises.
8. Can you provide examples of recent developments in the market?
Jan 2023: MapZot.AI provides Mobile Location data to assist businesses in increasing foot traffic. MapZot.AI provides site selection, portfolio analytics, and vacancy analysis by providing insights into the exact habits of consumers, allowing company owners to properly estimate customer accessibility. The data provided by MapZot.AI is insightful and simple; by combining detailed metrics such as store saturation and pull rates with a simple UI, any business owner can take advantage of the advanced analytics capabilities that MapZot.AI provides to gain insight into what drives customers to their stores and which potential locations could be advantageous for opening new ones.
9. What pricing options are available for accessing the report?
Pricing options include single-user, multi-user, and enterprise licenses priced at USD 4750, USD 5250, and USD 8750 respectively.
10. Is the market size provided in terms of value or volume?
The market size is provided in terms of value, measured in Million.
11. Are there any specific market keywords associated with the report?
Yes, the market keyword associated with the report is "Geo Marketing Industry," which aids in identifying and referencing the specific market segment covered.
12. How do I determine which pricing option suits my needs best?
The pricing options vary based on user requirements and access needs. Individual users may opt for single-user licenses, while businesses requiring broader access may choose multi-user or enterprise licenses for cost-effective access to the report.
13. Are there any additional resources or data provided in the Geo Marketing Industry report?
While the report offers comprehensive insights, it's advisable to review the specific contents or supplementary materials provided to ascertain if additional resources or data are available.
14. How can I stay updated on further developments or reports in the Geo Marketing Industry?
To stay informed about further developments, trends, and reports in the Geo Marketing Industry, consider subscribing to industry newsletters, following relevant companies and organizations, or regularly checking reputable industry news sources and publications.
Methodology
Step 1 - Identification of Relevant Samples Size from Population Database


Step 2 - Approaches for Defining Global Market Size (Value, Volume* & Price*)

Note*: In applicable scenarios
Step 3 - Data Sources
Primary Research
- Web Analytics
- Survey Reports
- Research Institute
- Latest Research Reports
- Opinion Leaders
Secondary Research
- Annual Reports
- White Paper
- Latest Press Release
- Industry Association
- Paid Database
- Investor Presentations

Step 4 - Data Triangulation
Involves using different sources of information in order to increase the validity of a study
These sources are likely to be stakeholders in a program - participants, other researchers, program staff, other community members, and so on.
Then we put all data in single framework & apply various statistical tools to find out the dynamic on the market.
During the analysis stage, feedback from the stakeholder groups would be compared to determine areas of agreement as well as areas of divergence
