

Key Insights
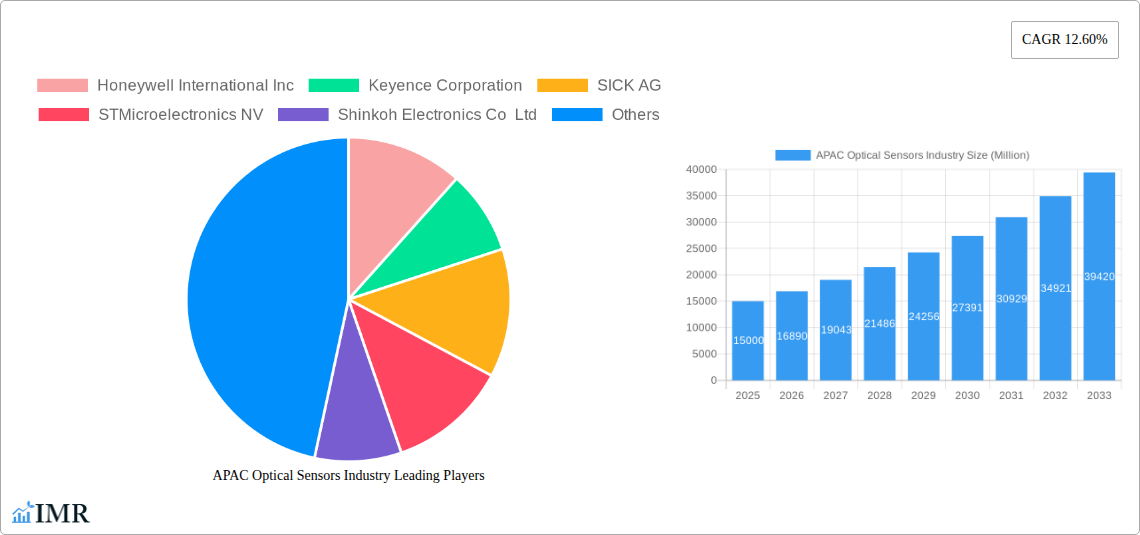
The Asia-Pacific (APAC) optical sensor market is experiencing robust growth, driven by the region's expanding industrial automation, burgeoning automotive sector, and increasing adoption of consumer electronics incorporating advanced sensing technologies. The market's Compound Annual Growth Rate (CAGR) of 12.60% from 2019 to 2024 suggests a significant upward trajectory, expected to continue through 2033. Key growth drivers include the rising demand for high-precision sensors in manufacturing processes, the proliferation of smart devices integrating advanced sensing capabilities, and advancements in sensor technology resulting in smaller, more efficient, and cost-effective solutions. Specifically, countries like China, India, South Korea, and Japan are leading the regional growth, fueled by substantial investments in research and development, technological advancements, and government initiatives promoting industrialization and technological innovation. The increasing demand for automation in manufacturing, particularly within the electronics, automotive, and healthcare sectors, is significantly contributing to the demand for sophisticated optical sensors such as fiber optic, image, and proximity sensors. Furthermore, the increasing adoption of biometric authentication in various applications, from access control to mobile payments, is furthering market expansion.
While the market presents substantial opportunities, certain challenges remain. These include the relatively high cost of advanced optical sensor technologies, which might limit adoption in certain segments, particularly in price-sensitive markets. Another challenge is the need for skilled professionals to design, implement, and maintain sophisticated optical sensor systems. Addressing these challenges through strategic partnerships, investment in training and education, and the development of cost-effective sensor technologies will be critical to sustaining the market's robust growth trajectory. Despite these constraints, the long-term outlook for the APAC optical sensor market remains highly positive, promising continued expansion driven by ongoing technological advancements and increased integration across various industries. The market segmentation by sensor type (fiber optic, image, position, etc.) and application (industrial, automotive, medical, etc.) provides a nuanced understanding of the market dynamics and opportunities for individual players.
APAC Optical Sensors Industry Market Report: 2019-2033
This comprehensive report provides a detailed analysis of the Asia-Pacific (APAC) optical sensors industry, covering market dynamics, growth trends, dominant segments, key players, and future outlook. The study period spans from 2019 to 2033, with 2025 serving as the base and estimated year. The report utilizes data from the historical period (2019-2024) to forecast market trends from 2025 to 2033. The report focuses on key segments including Fiber Optic Sensors, Image Sensors, Position Sensors, Ambient Light Sensors, Proximity Sensors, and Infrared Sensors across diverse applications like Industrial, Medical, Biometric, Automotive, and Consumer Electronics in major APAC countries including China, India, South Korea, Japan, and the Rest of Asia Pacific. The market size is presented in Million Units.
APAC Optical Sensors Industry Market Dynamics & Structure
The APAC optical sensor market is characterized by a moderately concentrated landscape with both global giants and regional players vying for market share. Technological innovation, particularly in miniaturization, higher sensitivity, and improved integration, is a primary growth driver. Stringent regulatory frameworks, particularly concerning safety and data privacy in automotive and medical applications, significantly impact market development. Competitive product substitutes, such as ultrasonic and capacitive sensors, present ongoing challenges, while mergers and acquisitions (M&A) activity is steadily increasing, leading to greater consolidation.
- Market Concentration: The top 5 players hold approximately xx% market share in 2025.
- Technological Innovation: Focus on advanced materials, AI integration, and miniaturization.
- Regulatory Landscape: Stringent safety and data privacy regulations in specific applications.
- Competitive Substitutes: Ultrasonic and capacitive sensors pose competition.
- M&A Activity: xx M&A deals were recorded in the APAC region between 2020 and 2024.
- Innovation Barriers: High R&D costs and the need for specialized expertise hinder innovation.
APAC Optical Sensors Industry Growth Trends & Insights
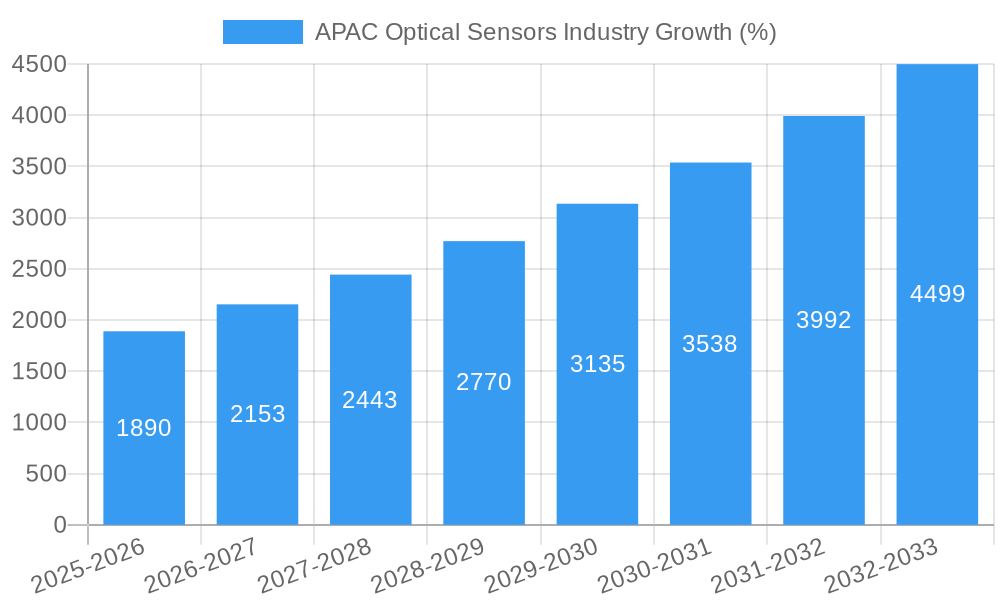
The APAC optical sensors market experienced robust growth during the historical period (2019-2024), driven by increasing automation in industrial settings, the expanding consumer electronics sector, and advancements in healthcare technology. The market is projected to continue its upward trajectory, with a compound annual growth rate (CAGR) of xx% during the forecast period (2025-2033). This growth is fueled by rising adoption rates across various applications, technological disruptions such as the introduction of 3D sensors and LiDAR, and shifting consumer preferences towards more sophisticated devices. Market penetration in emerging economies like India and other Southeast Asian countries presents substantial growth opportunities. Specific sectors, such as automotive and medical applications, are experiencing significantly higher adoption rates and fueling accelerated growth.
Dominant Regions, Countries, or Segments in APAC Optical Sensors Industry
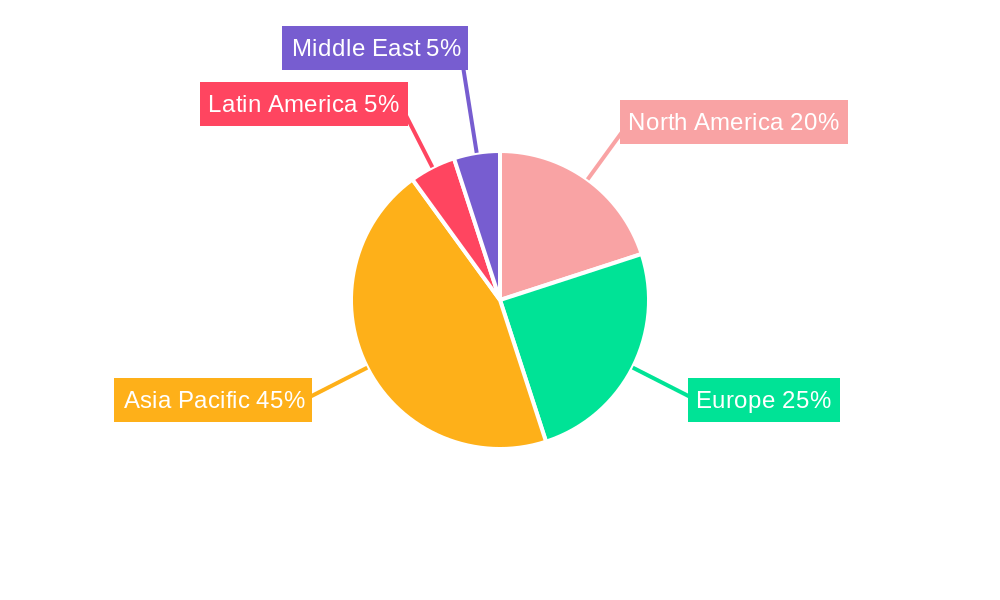
China remains the dominant market for optical sensors in APAC, driven by its robust manufacturing sector and rapid technological advancements. India is witnessing significant growth due to its expanding industrial base and increasing adoption in consumer electronics. The industrial segment, particularly automation and robotics, commands the largest market share, followed closely by the automotive and consumer electronics segments. Within sensor types, image sensors are experiencing the fastest growth owing to applications in advanced driver-assistance systems (ADAS), biometric authentication, and machine vision.
- Key Drivers (China): Strong manufacturing base, government support for technological advancements.
- Key Drivers (India): Expanding industrial sector, growth in consumer electronics market.
- Dominant Segment (by application): Industrial automation (xx Million Units in 2025).
- Fastest-Growing Segment (by sensor type): Image Sensors (xx% CAGR 2025-2033).
- Growth Potential: Significant growth potential in Rest of Asia Pacific due to infrastructure development.
APAC Optical Sensors Industry Product Landscape
The APAC optical sensor market exhibits a diverse product landscape featuring advancements in miniaturization, enhanced sensitivity, and improved integration capabilities. Fiber optic sensors are increasingly preferred for their resilience in harsh industrial environments. Image sensors are leading in innovation with higher resolutions and improved functionalities. Unique selling propositions include enhanced accuracy, improved durability, and lower power consumption. Technological advancements like 3D sensing and LiDAR technologies are driving the development of sophisticated sensors for diverse applications.
Key Drivers, Barriers & Challenges in APAP Optical Sensors Industry
Key Drivers:
- Increasing automation across industries.
- Growth of consumer electronics and automotive sectors.
- Advancements in healthcare technology driving demand for medical sensors.
- Government initiatives promoting technological advancement and digitalization.
Key Challenges:
- Supply chain disruptions impacting component availability and costs.
- Stringent regulatory requirements increasing development costs.
- Intense competition among established and emerging players.
- Fluctuations in raw material prices.
Emerging Opportunities in APAP Optical Sensors Industry
- Expansion into untapped markets in Southeast Asia.
- Development of sensors for emerging applications such as environmental monitoring and smart agriculture.
- Integration of AI and machine learning capabilities into optical sensors for advanced data analysis.
- Growing demand for miniaturized, high-performance sensors for wearable technology.
Growth Accelerators in the APAC Optical Sensors Industry
Technological breakthroughs, strategic partnerships between sensor manufacturers and technology companies, and expansion strategies focusing on emerging markets are key catalysts driving the long-term growth of the APAC optical sensors industry. Investment in R&D to develop innovative sensor technologies and collaboration with system integrators to offer comprehensive solutions will be critical for maintaining a competitive edge.
Key Players Shaping the APAC Optical Sensors Industry Market
- Honeywell International Inc
- Keyence Corporation
- SICK AG
- STMicroelectronics NV
- Shinkoh Electronics Co Ltd
- Robert Bosch GmbH
- Atmel Corporation
- Rockwell Automation Inc
- OZ Optics Ltd
- Neubrex Co Ltd
- List Not Exhaustive
Notable Milestones in APAC Optical Sensors Industry Sector
- September 2022: The Northeast Frontier Railway (NFR) implemented optical sensor technology to detect animals near train tracks, aiming to reduce elephant-train collisions.
In-Depth APAC Optical Sensors Industry Market Outlook
The APAC optical sensors market is poised for sustained growth driven by technological advancements, increasing adoption across diverse applications, and the expansion into new markets. Strategic partnerships, focused R&D efforts, and the development of innovative sensor solutions will be crucial for companies to capitalize on the significant opportunities presented by this dynamic market. The continued miniaturization and improved performance of optical sensors will pave the way for wider adoption, furthering market expansion across multiple sectors in the forecast period.
APAC Optical Sensors Industry Segmentation
-
1. Sensor Type
- 1.1. Fiber Optic Sensors
- 1.2. Image Sensors
- 1.3. Position Sensors
- 1.4. Ambient light
- 1.5. Proximity Sensors
- 1.6. Infrared Sensors
-
2. Application
- 2.1. Industrial
- 2.2. Medical
- 2.3. Biometric
- 2.4. Automotive
- 2.5. Consumer Electronics
- 2.6. Other Applications
APAC Optical Sensors Industry Segmentation By Geography
-
1. North America
- 1.1. United States
- 1.2. Canada
- 1.3. Mexico
-
2. South America
- 2.1. Brazil
- 2.2. Argentina
- 2.3. Rest of South America
-
3. Europe
- 3.1. United Kingdom
- 3.2. Germany
- 3.3. France
- 3.4. Italy
- 3.5. Spain
- 3.6. Russia
- 3.7. Benelux
- 3.8. Nordics
- 3.9. Rest of Europe
-
4. Middle East & Africa
- 4.1. Turkey
- 4.2. Israel
- 4.3. GCC
- 4.4. North Africa
- 4.5. South Africa
- 4.6. Rest of Middle East & Africa
-
5. Asia Pacific
- 5.1. China
- 5.2. India
- 5.3. Japan
- 5.4. South Korea
- 5.5. ASEAN
- 5.6. Oceania
- 5.7. Rest of Asia Pacific
APAC Optical Sensors Industry REPORT HIGHLIGHTS
| Aspects | Details |
|---|---|
| Study Period | 2019-2033 |
| Base Year | 2024 |
| Estimated Year | 2025 |
| Forecast Period | 2025-2033 |
| Historical Period | 2019-2024 |
| Growth Rate | CAGR of 12.60% from 2019-2033 |
| Segmentation |
|
Table of Contents
- 1. Introduction
- 1.1. Research Scope
- 1.2. Market Segmentation
- 1.3. Research Methodology
- 1.4. Definitions and Assumptions
- 2. Executive Summary
- 2.1. Introduction
- 3. Market Dynamics
- 3.1. Introduction
- 3.2. Market Drivers
- 3.2.1. Increasing demand from consumer electronics; Rising adoption of IoT
- 3.3. Market Restrains
- 3.3.1. Intense Competition in the Market
- 3.4. Market Trends
- 3.4.1. Growing consumer electronics demand will boost the market growth
- 4. Market Factor Analysis
- 4.1. Porters Five Forces
- 4.2. Supply/Value Chain
- 4.3. PESTEL analysis
- 4.4. Market Entropy
- 4.5. Patent/Trademark Analysis
- 5. Global APAC Optical Sensors Industry Analysis, Insights and Forecast, 2019-2031
- 5.1. Market Analysis, Insights and Forecast - by Sensor Type
- 5.1.1. Fiber Optic Sensors
- 5.1.2. Image Sensors
- 5.1.3. Position Sensors
- 5.1.4. Ambient light
- 5.1.5. Proximity Sensors
- 5.1.6. Infrared Sensors
- 5.2. Market Analysis, Insights and Forecast - by Application
- 5.2.1. Industrial
- 5.2.2. Medical
- 5.2.3. Biometric
- 5.2.4. Automotive
- 5.2.5. Consumer Electronics
- 5.2.6. Other Applications
- 5.3. Market Analysis, Insights and Forecast - by Region
- 5.3.1. North America
- 5.3.2. South America
- 5.3.3. Europe
- 5.3.4. Middle East & Africa
- 5.3.5. Asia Pacific
- 5.1. Market Analysis, Insights and Forecast - by Sensor Type
- 6. North America APAC Optical Sensors Industry Analysis, Insights and Forecast, 2019-2031
- 6.1. Market Analysis, Insights and Forecast - by Sensor Type
- 6.1.1. Fiber Optic Sensors
- 6.1.2. Image Sensors
- 6.1.3. Position Sensors
- 6.1.4. Ambient light
- 6.1.5. Proximity Sensors
- 6.1.6. Infrared Sensors
- 6.2. Market Analysis, Insights and Forecast - by Application
- 6.2.1. Industrial
- 6.2.2. Medical
- 6.2.3. Biometric
- 6.2.4. Automotive
- 6.2.5. Consumer Electronics
- 6.2.6. Other Applications
- 6.1. Market Analysis, Insights and Forecast - by Sensor Type
- 7. South America APAC Optical Sensors Industry Analysis, Insights and Forecast, 2019-2031
- 7.1. Market Analysis, Insights and Forecast - by Sensor Type
- 7.1.1. Fiber Optic Sensors
- 7.1.2. Image Sensors
- 7.1.3. Position Sensors
- 7.1.4. Ambient light
- 7.1.5. Proximity Sensors
- 7.1.6. Infrared Sensors
- 7.2. Market Analysis, Insights and Forecast - by Application
- 7.2.1. Industrial
- 7.2.2. Medical
- 7.2.3. Biometric
- 7.2.4. Automotive
- 7.2.5. Consumer Electronics
- 7.2.6. Other Applications
- 7.1. Market Analysis, Insights and Forecast - by Sensor Type
- 8. Europe APAC Optical Sensors Industry Analysis, Insights and Forecast, 2019-2031
- 8.1. Market Analysis, Insights and Forecast - by Sensor Type
- 8.1.1. Fiber Optic Sensors
- 8.1.2. Image Sensors
- 8.1.3. Position Sensors
- 8.1.4. Ambient light
- 8.1.5. Proximity Sensors
- 8.1.6. Infrared Sensors
- 8.2. Market Analysis, Insights and Forecast - by Application
- 8.2.1. Industrial
- 8.2.2. Medical
- 8.2.3. Biometric
- 8.2.4. Automotive
- 8.2.5. Consumer Electronics
- 8.2.6. Other Applications
- 8.1. Market Analysis, Insights and Forecast - by Sensor Type
- 9. Middle East & Africa APAC Optical Sensors Industry Analysis, Insights and Forecast, 2019-2031
- 9.1. Market Analysis, Insights and Forecast - by Sensor Type
- 9.1.1. Fiber Optic Sensors
- 9.1.2. Image Sensors
- 9.1.3. Position Sensors
- 9.1.4. Ambient light
- 9.1.5. Proximity Sensors
- 9.1.6. Infrared Sensors
- 9.2. Market Analysis, Insights and Forecast - by Application
- 9.2.1. Industrial
- 9.2.2. Medical
- 9.2.3. Biometric
- 9.2.4. Automotive
- 9.2.5. Consumer Electronics
- 9.2.6. Other Applications
- 9.1. Market Analysis, Insights and Forecast - by Sensor Type
- 10. Asia Pacific APAC Optical Sensors Industry Analysis, Insights and Forecast, 2019-2031
- 10.1. Market Analysis, Insights and Forecast - by Sensor Type
- 10.1.1. Fiber Optic Sensors
- 10.1.2. Image Sensors
- 10.1.3. Position Sensors
- 10.1.4. Ambient light
- 10.1.5. Proximity Sensors
- 10.1.6. Infrared Sensors
- 10.2. Market Analysis, Insights and Forecast - by Application
- 10.2.1. Industrial
- 10.2.2. Medical
- 10.2.3. Biometric
- 10.2.4. Automotive
- 10.2.5. Consumer Electronics
- 10.2.6. Other Applications
- 10.1. Market Analysis, Insights and Forecast - by Sensor Type
- 11. North America APAC Optical Sensors Industry Analysis, Insights and Forecast, 2019-2031
- 11.1. Market Analysis, Insights and Forecast - By Country/Sub-region
- 11.1.1.
- 12. Europe APAC Optical Sensors Industry Analysis, Insights and Forecast, 2019-2031
- 12.1. Market Analysis, Insights and Forecast - By Country/Sub-region
- 12.1.1.
- 13. Asia Pacific APAC Optical Sensors Industry Analysis, Insights and Forecast, 2019-2031
- 13.1. Market Analysis, Insights and Forecast - By Country/Sub-region
- 13.1.1.
- 14. Latin America APAC Optical Sensors Industry Analysis, Insights and Forecast, 2019-2031
- 14.1. Market Analysis, Insights and Forecast - By Country/Sub-region
- 14.1.1.
- 15. Middle East APAC Optical Sensors Industry Analysis, Insights and Forecast, 2019-2031
- 15.1. Market Analysis, Insights and Forecast - By Country/Sub-region
- 15.1.1.
- 16. Competitive Analysis
- 16.1. Global Market Share Analysis 2024
- 16.2. Company Profiles
- 16.2.1 Honeywell International Inc
- 16.2.1.1. Overview
- 16.2.1.2. Products
- 16.2.1.3. SWOT Analysis
- 16.2.1.4. Recent Developments
- 16.2.1.5. Financials (Based on Availability)
- 16.2.2 Keyence Corporation
- 16.2.2.1. Overview
- 16.2.2.2. Products
- 16.2.2.3. SWOT Analysis
- 16.2.2.4. Recent Developments
- 16.2.2.5. Financials (Based on Availability)
- 16.2.3 SICK AG
- 16.2.3.1. Overview
- 16.2.3.2. Products
- 16.2.3.3. SWOT Analysis
- 16.2.3.4. Recent Developments
- 16.2.3.5. Financials (Based on Availability)
- 16.2.4 STMicroelectronics NV
- 16.2.4.1. Overview
- 16.2.4.2. Products
- 16.2.4.3. SWOT Analysis
- 16.2.4.4. Recent Developments
- 16.2.4.5. Financials (Based on Availability)
- 16.2.5 Shinkoh Electronics Co Ltd
- 16.2.5.1. Overview
- 16.2.5.2. Products
- 16.2.5.3. SWOT Analysis
- 16.2.5.4. Recent Developments
- 16.2.5.5. Financials (Based on Availability)
- 16.2.6 Robert Bosch GmbH
- 16.2.6.1. Overview
- 16.2.6.2. Products
- 16.2.6.3. SWOT Analysis
- 16.2.6.4. Recent Developments
- 16.2.6.5. Financials (Based on Availability)
- 16.2.7 Atmel Corporation
- 16.2.7.1. Overview
- 16.2.7.2. Products
- 16.2.7.3. SWOT Analysis
- 16.2.7.4. Recent Developments
- 16.2.7.5. Financials (Based on Availability)
- 16.2.8 Rockwell Automation Inc
- 16.2.8.1. Overview
- 16.2.8.2. Products
- 16.2.8.3. SWOT Analysis
- 16.2.8.4. Recent Developments
- 16.2.8.5. Financials (Based on Availability)
- 16.2.9 OZ Optics Ltd
- 16.2.9.1. Overview
- 16.2.9.2. Products
- 16.2.9.3. SWOT Analysis
- 16.2.9.4. Recent Developments
- 16.2.9.5. Financials (Based on Availability)
- 16.2.10 Neubrex Co Ltd *List Not Exhaustive
- 16.2.10.1. Overview
- 16.2.10.2. Products
- 16.2.10.3. SWOT Analysis
- 16.2.10.4. Recent Developments
- 16.2.10.5. Financials (Based on Availability)
- 16.2.1 Honeywell International Inc
List of Figures
- Figure 1: Global APAC Optical Sensors Industry Revenue Breakdown (Million, %) by Region 2024 & 2032
- Figure 2: North America APAC Optical Sensors Industry Revenue (Million), by Country 2024 & 2032
- Figure 3: North America APAC Optical Sensors Industry Revenue Share (%), by Country 2024 & 2032
- Figure 4: Europe APAC Optical Sensors Industry Revenue (Million), by Country 2024 & 2032
- Figure 5: Europe APAC Optical Sensors Industry Revenue Share (%), by Country 2024 & 2032
- Figure 6: Asia Pacific APAC Optical Sensors Industry Revenue (Million), by Country 2024 & 2032
- Figure 7: Asia Pacific APAC Optical Sensors Industry Revenue Share (%), by Country 2024 & 2032
- Figure 8: Latin America APAC Optical Sensors Industry Revenue (Million), by Country 2024 & 2032
- Figure 9: Latin America APAC Optical Sensors Industry Revenue Share (%), by Country 2024 & 2032
- Figure 10: Middle East APAC Optical Sensors Industry Revenue (Million), by Country 2024 & 2032
- Figure 11: Middle East APAC Optical Sensors Industry Revenue Share (%), by Country 2024 & 2032
- Figure 12: North America APAC Optical Sensors Industry Revenue (Million), by Sensor Type 2024 & 2032
- Figure 13: North America APAC Optical Sensors Industry Revenue Share (%), by Sensor Type 2024 & 2032
- Figure 14: North America APAC Optical Sensors Industry Revenue (Million), by Application 2024 & 2032
- Figure 15: North America APAC Optical Sensors Industry Revenue Share (%), by Application 2024 & 2032
- Figure 16: North America APAC Optical Sensors Industry Revenue (Million), by Country 2024 & 2032
- Figure 17: North America APAC Optical Sensors Industry Revenue Share (%), by Country 2024 & 2032
- Figure 18: South America APAC Optical Sensors Industry Revenue (Million), by Sensor Type 2024 & 2032
- Figure 19: South America APAC Optical Sensors Industry Revenue Share (%), by Sensor Type 2024 & 2032
- Figure 20: South America APAC Optical Sensors Industry Revenue (Million), by Application 2024 & 2032
- Figure 21: South America APAC Optical Sensors Industry Revenue Share (%), by Application 2024 & 2032
- Figure 22: South America APAC Optical Sensors Industry Revenue (Million), by Country 2024 & 2032
- Figure 23: South America APAC Optical Sensors Industry Revenue Share (%), by Country 2024 & 2032
- Figure 24: Europe APAC Optical Sensors Industry Revenue (Million), by Sensor Type 2024 & 2032
- Figure 25: Europe APAC Optical Sensors Industry Revenue Share (%), by Sensor Type 2024 & 2032
- Figure 26: Europe APAC Optical Sensors Industry Revenue (Million), by Application 2024 & 2032
- Figure 27: Europe APAC Optical Sensors Industry Revenue Share (%), by Application 2024 & 2032
- Figure 28: Europe APAC Optical Sensors Industry Revenue (Million), by Country 2024 & 2032
- Figure 29: Europe APAC Optical Sensors Industry Revenue Share (%), by Country 2024 & 2032
- Figure 30: Middle East & Africa APAC Optical Sensors Industry Revenue (Million), by Sensor Type 2024 & 2032
- Figure 31: Middle East & Africa APAC Optical Sensors Industry Revenue Share (%), by Sensor Type 2024 & 2032
- Figure 32: Middle East & Africa APAC Optical Sensors Industry Revenue (Million), by Application 2024 & 2032
- Figure 33: Middle East & Africa APAC Optical Sensors Industry Revenue Share (%), by Application 2024 & 2032
- Figure 34: Middle East & Africa APAC Optical Sensors Industry Revenue (Million), by Country 2024 & 2032
- Figure 35: Middle East & Africa APAC Optical Sensors Industry Revenue Share (%), by Country 2024 & 2032
- Figure 36: Asia Pacific APAC Optical Sensors Industry Revenue (Million), by Sensor Type 2024 & 2032
- Figure 37: Asia Pacific APAC Optical Sensors Industry Revenue Share (%), by Sensor Type 2024 & 2032
- Figure 38: Asia Pacific APAC Optical Sensors Industry Revenue (Million), by Application 2024 & 2032
- Figure 39: Asia Pacific APAC Optical Sensors Industry Revenue Share (%), by Application 2024 & 2032
- Figure 40: Asia Pacific APAC Optical Sensors Industry Revenue (Million), by Country 2024 & 2032
- Figure 41: Asia Pacific APAC Optical Sensors Industry Revenue Share (%), by Country 2024 & 2032
List of Tables
- Table 1: Global APAC Optical Sensors Industry Revenue Million Forecast, by Region 2019 & 2032
- Table 2: Global APAC Optical Sensors Industry Revenue Million Forecast, by Sensor Type 2019 & 2032
- Table 3: Global APAC Optical Sensors Industry Revenue Million Forecast, by Application 2019 & 2032
- Table 4: Global APAC Optical Sensors Industry Revenue Million Forecast, by Region 2019 & 2032
- Table 5: Global APAC Optical Sensors Industry Revenue Million Forecast, by Country 2019 & 2032
- Table 6: APAC Optical Sensors Industry Revenue (Million) Forecast, by Application 2019 & 2032
- Table 7: Global APAC Optical Sensors Industry Revenue Million Forecast, by Country 2019 & 2032
- Table 8: APAC Optical Sensors Industry Revenue (Million) Forecast, by Application 2019 & 2032
- Table 9: Global APAC Optical Sensors Industry Revenue Million Forecast, by Country 2019 & 2032
- Table 10: APAC Optical Sensors Industry Revenue (Million) Forecast, by Application 2019 & 2032
- Table 11: Global APAC Optical Sensors Industry Revenue Million Forecast, by Country 2019 & 2032
- Table 12: APAC Optical Sensors Industry Revenue (Million) Forecast, by Application 2019 & 2032
- Table 13: Global APAC Optical Sensors Industry Revenue Million Forecast, by Country 2019 & 2032
- Table 14: APAC Optical Sensors Industry Revenue (Million) Forecast, by Application 2019 & 2032
- Table 15: Global APAC Optical Sensors Industry Revenue Million Forecast, by Sensor Type 2019 & 2032
- Table 16: Global APAC Optical Sensors Industry Revenue Million Forecast, by Application 2019 & 2032
- Table 17: Global APAC Optical Sensors Industry Revenue Million Forecast, by Country 2019 & 2032
- Table 18: United States APAC Optical Sensors Industry Revenue (Million) Forecast, by Application 2019 & 2032
- Table 19: Canada APAC Optical Sensors Industry Revenue (Million) Forecast, by Application 2019 & 2032
- Table 20: Mexico APAC Optical Sensors Industry Revenue (Million) Forecast, by Application 2019 & 2032
- Table 21: Global APAC Optical Sensors Industry Revenue Million Forecast, by Sensor Type 2019 & 2032
- Table 22: Global APAC Optical Sensors Industry Revenue Million Forecast, by Application 2019 & 2032
- Table 23: Global APAC Optical Sensors Industry Revenue Million Forecast, by Country 2019 & 2032
- Table 24: Brazil APAC Optical Sensors Industry Revenue (Million) Forecast, by Application 2019 & 2032
- Table 25: Argentina APAC Optical Sensors Industry Revenue (Million) Forecast, by Application 2019 & 2032
- Table 26: Rest of South America APAC Optical Sensors Industry Revenue (Million) Forecast, by Application 2019 & 2032
- Table 27: Global APAC Optical Sensors Industry Revenue Million Forecast, by Sensor Type 2019 & 2032
- Table 28: Global APAC Optical Sensors Industry Revenue Million Forecast, by Application 2019 & 2032
- Table 29: Global APAC Optical Sensors Industry Revenue Million Forecast, by Country 2019 & 2032
- Table 30: United Kingdom APAC Optical Sensors Industry Revenue (Million) Forecast, by Application 2019 & 2032
- Table 31: Germany APAC Optical Sensors Industry Revenue (Million) Forecast, by Application 2019 & 2032
- Table 32: France APAC Optical Sensors Industry Revenue (Million) Forecast, by Application 2019 & 2032
- Table 33: Italy APAC Optical Sensors Industry Revenue (Million) Forecast, by Application 2019 & 2032
- Table 34: Spain APAC Optical Sensors Industry Revenue (Million) Forecast, by Application 2019 & 2032
- Table 35: Russia APAC Optical Sensors Industry Revenue (Million) Forecast, by Application 2019 & 2032
- Table 36: Benelux APAC Optical Sensors Industry Revenue (Million) Forecast, by Application 2019 & 2032
- Table 37: Nordics APAC Optical Sensors Industry Revenue (Million) Forecast, by Application 2019 & 2032
- Table 38: Rest of Europe APAC Optical Sensors Industry Revenue (Million) Forecast, by Application 2019 & 2032
- Table 39: Global APAC Optical Sensors Industry Revenue Million Forecast, by Sensor Type 2019 & 2032
- Table 40: Global APAC Optical Sensors Industry Revenue Million Forecast, by Application 2019 & 2032
- Table 41: Global APAC Optical Sensors Industry Revenue Million Forecast, by Country 2019 & 2032
- Table 42: Turkey APAC Optical Sensors Industry Revenue (Million) Forecast, by Application 2019 & 2032
- Table 43: Israel APAC Optical Sensors Industry Revenue (Million) Forecast, by Application 2019 & 2032
- Table 44: GCC APAC Optical Sensors Industry Revenue (Million) Forecast, by Application 2019 & 2032
- Table 45: North Africa APAC Optical Sensors Industry Revenue (Million) Forecast, by Application 2019 & 2032
- Table 46: South Africa APAC Optical Sensors Industry Revenue (Million) Forecast, by Application 2019 & 2032
- Table 47: Rest of Middle East & Africa APAC Optical Sensors Industry Revenue (Million) Forecast, by Application 2019 & 2032
- Table 48: Global APAC Optical Sensors Industry Revenue Million Forecast, by Sensor Type 2019 & 2032
- Table 49: Global APAC Optical Sensors Industry Revenue Million Forecast, by Application 2019 & 2032
- Table 50: Global APAC Optical Sensors Industry Revenue Million Forecast, by Country 2019 & 2032
- Table 51: China APAC Optical Sensors Industry Revenue (Million) Forecast, by Application 2019 & 2032
- Table 52: India APAC Optical Sensors Industry Revenue (Million) Forecast, by Application 2019 & 2032
- Table 53: Japan APAC Optical Sensors Industry Revenue (Million) Forecast, by Application 2019 & 2032
- Table 54: South Korea APAC Optical Sensors Industry Revenue (Million) Forecast, by Application 2019 & 2032
- Table 55: ASEAN APAC Optical Sensors Industry Revenue (Million) Forecast, by Application 2019 & 2032
- Table 56: Oceania APAC Optical Sensors Industry Revenue (Million) Forecast, by Application 2019 & 2032
- Table 57: Rest of Asia Pacific APAC Optical Sensors Industry Revenue (Million) Forecast, by Application 2019 & 2032
Frequently Asked Questions
1. What is the projected Compound Annual Growth Rate (CAGR) of the APAC Optical Sensors Industry?
The projected CAGR is approximately 12.60%.
2. Which companies are prominent players in the APAC Optical Sensors Industry?
Key companies in the market include Honeywell International Inc, Keyence Corporation, SICK AG, STMicroelectronics NV, Shinkoh Electronics Co Ltd, Robert Bosch GmbH, Atmel Corporation, Rockwell Automation Inc, OZ Optics Ltd, Neubrex Co Ltd *List Not Exhaustive.
3. What are the main segments of the APAC Optical Sensors Industry?
The market segments include Sensor Type, Application.
4. Can you provide details about the market size?
The market size is estimated to be USD XX Million as of 2022.
5. What are some drivers contributing to market growth?
Increasing demand from consumer electronics; Rising adoption of IoT.
6. What are the notable trends driving market growth?
Growing consumer electronics demand will boost the market growth.
7. Are there any restraints impacting market growth?
Intense Competition in the Market.
8. Can you provide examples of recent developments in the market?
September 2022 - The Northeast Frontier Railway (NFR) announced rolling out an optical sensor technology to alert locomotive drivers about the presence of animals in the vicinity of trains. The development took place after the amplifying system imitating the buzz of a swarm of honey bees to keep wild jumbos away from rail tracks failed to give an ultimate solution to curb elephant deaths.
9. What pricing options are available for accessing the report?
Pricing options include single-user, multi-user, and enterprise licenses priced at USD 4750, USD 4950, and USD 6800 respectively.
10. Is the market size provided in terms of value or volume?
The market size is provided in terms of value, measured in Million.
11. Are there any specific market keywords associated with the report?
Yes, the market keyword associated with the report is "APAC Optical Sensors Industry," which aids in identifying and referencing the specific market segment covered.
12. How do I determine which pricing option suits my needs best?
The pricing options vary based on user requirements and access needs. Individual users may opt for single-user licenses, while businesses requiring broader access may choose multi-user or enterprise licenses for cost-effective access to the report.
13. Are there any additional resources or data provided in the APAC Optical Sensors Industry report?
While the report offers comprehensive insights, it's advisable to review the specific contents or supplementary materials provided to ascertain if additional resources or data are available.
14. How can I stay updated on further developments or reports in the APAC Optical Sensors Industry?
To stay informed about further developments, trends, and reports in the APAC Optical Sensors Industry, consider subscribing to industry newsletters, following relevant companies and organizations, or regularly checking reputable industry news sources and publications.
Methodology
Step 1 - Identification of Relevant Samples Size from Population Database


Step 2 - Approaches for Defining Global Market Size (Value, Volume* & Price*)

Note*: In applicable scenarios
Step 3 - Data Sources
Primary Research
- Web Analytics
- Survey Reports
- Research Institute
- Latest Research Reports
- Opinion Leaders
Secondary Research
- Annual Reports
- White Paper
- Latest Press Release
- Industry Association
- Paid Database
- Investor Presentations

Step 4 - Data Triangulation
Involves using different sources of information in order to increase the validity of a study
These sources are likely to be stakeholders in a program - participants, other researchers, program staff, other community members, and so on.
Then we put all data in single framework & apply various statistical tools to find out the dynamic on the market.
During the analysis stage, feedback from the stakeholder groups would be compared to determine areas of agreement as well as areas of divergence
