

Key Insights
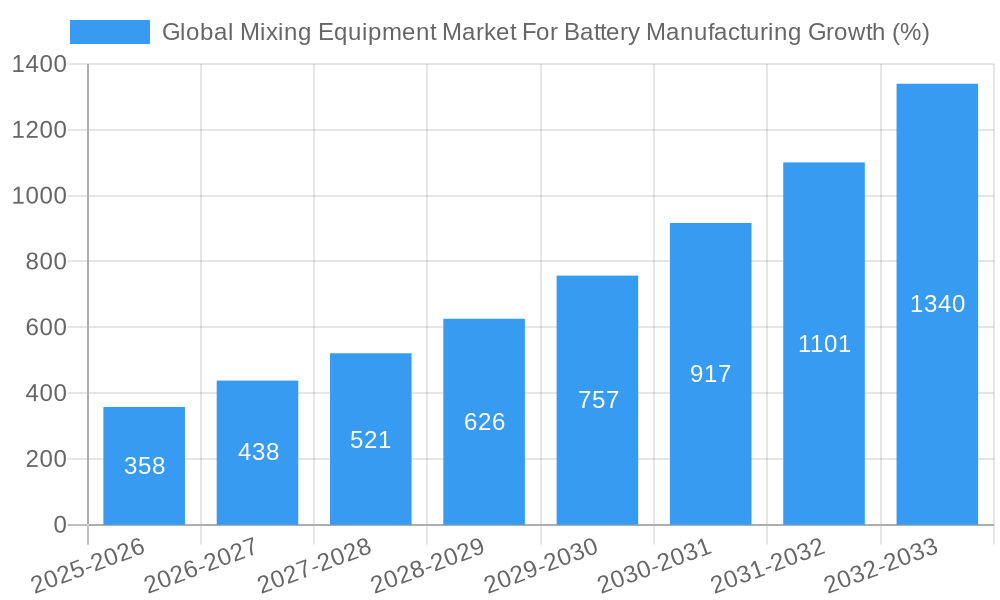
The global market for mixing equipment in battery manufacturing is experiencing robust growth, projected to reach $1.69 billion in 2025 and maintain a Compound Annual Growth Rate (CAGR) of 21.20% from 2025 to 2033. This expansion is driven primarily by the surging demand for electric vehicles (EVs) and energy storage systems (ESS), fueling the need for efficient and high-quality battery production. Technological advancements in mixing equipment, leading to improved mixing efficiency, reduced energy consumption, and enhanced product quality, further contribute to market growth. The increasing adoption of automation and Industry 4.0 technologies in battery manufacturing plants is also a significant driver, as automated mixing systems offer improved precision, reduced human error, and increased throughput. Furthermore, stringent government regulations promoting the adoption of EVs and renewable energy solutions are creating a favorable environment for the expansion of the battery manufacturing sector and, consequently, the demand for sophisticated mixing equipment. The market is segmented by mixer type (wet and dry), with wet mixers currently dominating due to their suitability for various battery chemistries. Key players like Processall, Charles Ross & Son Company, and MIXACO are actively innovating and expanding their product portfolios to cater to the growing market demand, fostering competition and driving further market growth.
Growth is expected to be geographically diverse, with North America and Asia-Pacific regions anticipated to lead the market due to the substantial presence of major battery manufacturers and supportive government policies. Europe is expected to witness significant growth, driven by the increasing adoption of EVs and stringent environmental regulations. While the initial investment in advanced mixing equipment can be substantial, the long-term benefits in terms of efficiency and product quality make it an attractive investment for battery manufacturers. However, challenges such as the high cost of advanced equipment and the need for skilled labor to operate and maintain these systems could potentially restrain market growth to some extent. Nevertheless, the overall outlook for the global mixing equipment market for battery manufacturing remains extremely positive, fueled by continued technological advancements and the global transition towards sustainable energy solutions.

Global Mixing Equipment Market for Battery Manufacturing: A Comprehensive Report (2019-2033)
This in-depth report provides a comprehensive analysis of the global mixing equipment market for battery manufacturing, encompassing market dynamics, growth trends, regional performance, product landscape, key players, and future outlook. The study period covers 2019-2033, with 2025 as the base and estimated year. The market is segmented by type into Wet Mixers and Dry Mixers, offering granular insights into each segment's performance. This report is essential for industry professionals, investors, and researchers seeking a clear understanding of this rapidly evolving market. The total market size in 2025 is estimated at xx Million Units.
Global Mixing Equipment Market For Battery Manufacturing Market Dynamics & Structure
The global mixing equipment market for battery manufacturing is experiencing robust growth driven by the burgeoning electric vehicle (EV) sector and the increasing demand for energy storage solutions. Market concentration is moderate, with several key players vying for market share. Technological innovation is a major driver, with advancements in mixing technologies leading to improved efficiency, higher throughput, and enhanced product quality. Stringent regulatory frameworks related to battery safety and environmental standards are shaping market dynamics, encouraging manufacturers to adopt eco-friendly and high-performance mixing equipment.
- Market Concentration: Moderate, with top 10 players holding approximately xx% market share in 2025.
- Technological Innovation: Focus on high-shear mixers, vacuum mixers, and automated systems to improve process efficiency and product consistency.
- Regulatory Landscape: Increasingly stringent environmental regulations drive demand for energy-efficient and sustainable mixing technologies.
- Competitive Substitutes: Limited direct substitutes; competition is primarily focused on performance, efficiency, and cost-effectiveness.
- End-User Demographics: Primarily driven by battery manufacturers supplying the EV, stationary energy storage, and portable electronics sectors.
- M&A Trends: A moderate level of M&A activity observed in recent years, with larger players acquiring smaller specialized companies to expand their product portfolios and technological capabilities. Approximately xx M&A deals were recorded between 2019 and 2024.
Global Mixing Equipment Market For Battery Manufacturing Growth Trends & Insights
The global mixing equipment market for battery manufacturing is projected to experience significant growth during the forecast period (2025-2033), driven primarily by the exponential rise in EV adoption and the growing demand for energy storage systems. The market is expected to witness a Compound Annual Growth Rate (CAGR) of xx% between 2025 and 2033, reaching an estimated xx Million Units by 2033. This growth is fueled by technological advancements, such as the development of high-efficiency mixers and automated systems that enhance production capacity and reduce operational costs. The increasing adoption of lithium-ion batteries across various applications is further boosting market demand. Consumer behavior shifts towards sustainable and eco-friendly energy solutions are also influencing market growth. Market penetration for advanced mixing technologies is currently at approximately xx% and is projected to increase significantly in the coming years.
Dominant Regions, Countries, or Segments in Global Mixing Equipment Market For Battery Manufacturing
The Asia-Pacific region, particularly China, holds a commanding position in the global mixing equipment market for battery manufacturing. This dominance stems from the region's substantial electric vehicle (EV) production capacity and the concentration of numerous major battery manufacturers. Analyzing the market by equipment type reveals that wet mixers currently capture a significantly larger market share than dry mixers, primarily due to their extensive use in lithium-ion battery production processes. This trend is expected to continue, driven by the increasing demand for high-performance lithium-ion batteries.
- Key Drivers in Asia-Pacific: The explosive growth of the EV industry, coupled with supportive government incentives promoting renewable energy and a robust, well-established manufacturing infrastructure, are key factors propelling market expansion.
- Dominance Factors: The high concentration of battery manufacturing facilities, substantial investments in battery research and development (R&D), and favorable government policies all contribute to the region's leading market share.
- Growth Potential: The ongoing expansion of the EV market and the surging demand for energy storage solutions—from grid-scale deployments to consumer electronics—are projected to fuel substantial growth in the Asia-Pacific region and beyond in the coming years.
- Wet Mixers Market Share (Projected 2025): [Insert Projected Percentage]% market share, driven by the overwhelming demand for lithium-ion battery production, which relies heavily on wet mixing processes.
- Dry Mixers Market Share (Projected 2025): [Insert Projected Percentage]% market share, with potential for growth in niche applications.
Global Mixing Equipment Market For Battery Manufacturing Product Landscape
The global mixing equipment market for battery manufacturing offers a diverse range of products, including high-shear mixers, planetary mixers, vacuum mixers, and specialized mixing systems designed to cater to the unique requirements of battery slurry preparation. These mixers are designed for high throughput, precise mixing, and consistent quality, ensuring optimal performance and longevity of the final battery product. Recent innovations focus on automation, integration with other manufacturing equipment, and enhanced safety features to minimize operational risks and improve efficiency. Unique selling propositions include features like advanced control systems, customizable designs, and improved energy efficiency.
Key Drivers, Barriers & Challenges in Global Mixing Equipment Market For Battery Manufacturing
Key Drivers:
- Exponential Rise in Electric Vehicle Demand: The booming EV market is the primary catalyst, driving the demand for efficient and high-capacity battery production equipment. This demand is further amplified by the increasing adoption of EVs globally.
- Growth of Energy Storage Systems (ESS): Significant investments in grid-scale energy storage and renewable energy solutions are creating a substantial and growing market for battery mixing equipment. This diversification beyond EVs is a significant factor in long-term growth.
- Technological Advancements: Continuous innovations in mixing technologies are leading to improved efficiency, reduced production costs, enhanced product quality (e.g., improved battery consistency and performance), and minimized environmental impact.
- Government Regulations and Incentives: Many governments worldwide are enacting policies that incentivize the adoption of EVs and renewable energy storage, indirectly boosting demand for battery manufacturing equipment.
Challenges and Restraints:
- Supply Chain Disruptions and Material Costs: Global supply chain vulnerabilities continue to pose challenges, impacting the availability of crucial components and raw materials, thus increasing production costs and potentially leading to delivery delays. (e.g., [quantify the impact with specific data if available]).
- Stringent Regulatory Compliance: Meeting increasingly stringent safety and environmental regulations necessitates significant investments in compliance measures, adding to manufacturing complexities and costs. This is particularly relevant for lithium-ion battery production, which involves the handling of hazardous materials.
- Intense Competition and Pricing Pressures: The market is characterized by intense competition among established and emerging players, resulting in pricing pressures and potentially impacting profitability margins.
Emerging Opportunities in Global Mixing Equipment Market For Battery Manufacturing
- Expansion into developing markets: Significant growth potential exists in developing economies with expanding EV and renewable energy sectors.
- Development of advanced mixing technologies: Focus on innovative designs, materials, and automation for higher efficiency and reduced operational costs.
- Integration with smart manufacturing systems: Connecting mixing equipment with Industry 4.0 technologies to optimize processes and improve data analytics.
Growth Accelerators in the Global Mixing Equipment Market For Battery Manufacturing Industry
Long-term growth in this sector is fueled by ongoing technological advancements in mixing technology, leading to improved efficiency, reduced energy consumption, and enhanced process control. Strategic partnerships between equipment manufacturers and battery producers are crucial for developing customized mixing solutions, driving innovation, and facilitating rapid market penetration. Expansion into emerging markets, particularly in regions experiencing rapid growth in EV adoption and renewable energy initiatives, will be critical in accelerating market growth further.
Key Players Shaping the Global Mixing Equipment Market For Battery Manufacturing Market
- Processall
- Charles Ross & Son Company
- MIXACO
- XIAMEN TOB NEW ENERGY TECHNOLOGY Co LTD
- Jongia Mixing Technology
- ONGOAL
- IKA India Private Limited
- SIEHE GROUP
- SCM GROUP LIMITED HK
- Xiamen Tmax Battery Equipments Limited
Notable Milestones in Global Mixing Equipment Market For Battery Manufacturing Sector
- September 2023: Fraunhofer Research Institution for Battery Cell Production used a 30-millimeter extruder at FFB’s new R&D site in Münster, Germany. Fraunhofer-Gesellschaft’s research organization is also building its FFB PreFab test facility, with a throughput of up to 1,200 liters of electrode/battery slurry per hour. This signifies advancements in high-throughput mixing for battery electrode production.
- May 2023: ONGOAL TECH showcased cutting-edge battery slurry mixing and material production line models at The Battery Show Europe 2023, highlighting advancements in slurry mixing processes and comprehensive solutions for battery material production.
In-Depth Global Mixing Equipment Market For Battery Manufacturing Market Outlook
The outlook for the global mixing equipment market for battery manufacturing remains exceptionally positive, driven by the sustained expansion of the EV and renewable energy sectors. Strategic collaborations, technological breakthroughs, and strategic market expansion will be key factors in propelling long-term growth. The ongoing focus on improving efficiency, sustainability, and safety within battery production will further stimulate demand for advanced mixing equipment, presenting substantial opportunities for both established and emerging players to capitalize on the growing need for high-performance, cost-effective mixing solutions. Further market segmentation (e.g., by battery chemistry type) and a detailed analysis of regional trends will provide a more granular understanding of this dynamic market.
Global Mixing Equipment Market For Battery Manufacturing Segmentation
-
1. Type
- 1.1. Wet Mixers
- 1.2. Dry Mixers
Global Mixing Equipment Market For Battery Manufacturing Segmentation By Geography
-
1. North America
- 1.1. United States
- 1.2. Canada
- 1.3. Rest of North America
-
2. Europe
- 2.1. Germany
- 2.2. France
- 2.3. United Kingdom
- 2.4. Italy
- 2.5. Spain
- 2.6. NORDIC
- 2.7. Turkey
- 2.8. Russia
- 2.9. Rest of Europe
-
3. Asia Pacific
- 3.1. China
- 3.2. India
- 3.3. Australia
- 3.4. Japan
- 3.5. Malaysia
- 3.6. Thailand
- 3.7. Indonesia
- 3.8. Vietnam
- 3.9. Rest of Asia Pacific
-
4. Middle East and Africa
- 4.1. Saudi Arabia
- 4.2. United Arab Emirates
- 4.3. Qatar
- 4.4. Egypt
- 4.5. Nigeria
- 4.6. South Africa
- 4.7. Rest of Middle East and Africa
-
5. South America
- 5.1. Brazil
- 5.2. Argentina
- 5.3. Columbia
- 5.4. Rest of South America

Global Mixing Equipment Market For Battery Manufacturing REPORT HIGHLIGHTS
| Aspects | Details |
|---|---|
| Study Period | 2019-2033 |
| Base Year | 2024 |
| Estimated Year | 2025 |
| Forecast Period | 2025-2033 |
| Historical Period | 2019-2024 |
| Growth Rate | CAGR of 21.20% from 2019-2033 |
| Segmentation |
|
Table of Contents
- 1. Introduction
- 1.1. Research Scope
- 1.2. Market Segmentation
- 1.3. Research Methodology
- 1.4. Definitions and Assumptions
- 2. Executive Summary
- 2.1. Introduction
- 3. Market Dynamics
- 3.1. Introduction
- 3.2. Market Drivers
- 3.2.1. 4.; The Increase in Investments to Enhance the Battery Production Capacity4.; Rising Adoption of Electric Vehicles
- 3.3. Market Restrains
- 3.3.1. 4.; The High Logistic Cost
- 3.4. Market Trends
- 3.4.1. Investments To Enhance the Battery Production Capacity is expected to Drive the Market Growth
- 4. Market Factor Analysis
- 4.1. Porters Five Forces
- 4.2. Supply/Value Chain
- 4.3. PESTEL analysis
- 4.4. Market Entropy
- 4.5. Patent/Trademark Analysis
- 5. Global Mixing Equipment Market For Battery Manufacturing Analysis, Insights and Forecast, 2019-2031
- 5.1. Market Analysis, Insights and Forecast - by Type
- 5.1.1. Wet Mixers
- 5.1.2. Dry Mixers
- 5.2. Market Analysis, Insights and Forecast - by Region
- 5.2.1. North America
- 5.2.2. Europe
- 5.2.3. Asia Pacific
- 5.2.4. Middle East and Africa
- 5.2.5. South America
- 5.1. Market Analysis, Insights and Forecast - by Type
- 6. North America Global Mixing Equipment Market For Battery Manufacturing Analysis, Insights and Forecast, 2019-2031
- 6.1. Market Analysis, Insights and Forecast - by Type
- 6.1.1. Wet Mixers
- 6.1.2. Dry Mixers
- 6.1. Market Analysis, Insights and Forecast - by Type
- 7. Europe Global Mixing Equipment Market For Battery Manufacturing Analysis, Insights and Forecast, 2019-2031
- 7.1. Market Analysis, Insights and Forecast - by Type
- 7.1.1. Wet Mixers
- 7.1.2. Dry Mixers
- 7.1. Market Analysis, Insights and Forecast - by Type
- 8. Asia Pacific Global Mixing Equipment Market For Battery Manufacturing Analysis, Insights and Forecast, 2019-2031
- 8.1. Market Analysis, Insights and Forecast - by Type
- 8.1.1. Wet Mixers
- 8.1.2. Dry Mixers
- 8.1. Market Analysis, Insights and Forecast - by Type
- 9. Middle East and Africa Global Mixing Equipment Market For Battery Manufacturing Analysis, Insights and Forecast, 2019-2031
- 9.1. Market Analysis, Insights and Forecast - by Type
- 9.1.1. Wet Mixers
- 9.1.2. Dry Mixers
- 9.1. Market Analysis, Insights and Forecast - by Type
- 10. South America Global Mixing Equipment Market For Battery Manufacturing Analysis, Insights and Forecast, 2019-2031
- 10.1. Market Analysis, Insights and Forecast - by Type
- 10.1.1. Wet Mixers
- 10.1.2. Dry Mixers
- 10.1. Market Analysis, Insights and Forecast - by Type
- 11. North America Global Mixing Equipment Market For Battery Manufacturing Analysis, Insights and Forecast, 2019-2031
- 11.1. Market Analysis, Insights and Forecast - By Country/Sub-region
- 11.1.1 United States
- 11.1.2 Canada
- 11.1.3 Mexico
- 12. Europe Global Mixing Equipment Market For Battery Manufacturing Analysis, Insights and Forecast, 2019-2031
- 12.1. Market Analysis, Insights and Forecast - By Country/Sub-region
- 12.1.1 Germany
- 12.1.2 United Kingdom
- 12.1.3 France
- 12.1.4 Spain
- 12.1.5 Italy
- 12.1.6 Spain
- 12.1.7 Belgium
- 12.1.8 Netherland
- 12.1.9 Nordics
- 12.1.10 Rest of Europe
- 13. Asia Pacific Global Mixing Equipment Market For Battery Manufacturing Analysis, Insights and Forecast, 2019-2031
- 13.1. Market Analysis, Insights and Forecast - By Country/Sub-region
- 13.1.1 China
- 13.1.2 Japan
- 13.1.3 India
- 13.1.4 South Korea
- 13.1.5 Southeast Asia
- 13.1.6 Australia
- 13.1.7 Indonesia
- 13.1.8 Phillipes
- 13.1.9 Singapore
- 13.1.10 Thailandc
- 13.1.11 Rest of Asia Pacific
- 14. South America Global Mixing Equipment Market For Battery Manufacturing Analysis, Insights and Forecast, 2019-2031
- 14.1. Market Analysis, Insights and Forecast - By Country/Sub-region
- 14.1.1 Brazil
- 14.1.2 Argentina
- 14.1.3 Peru
- 14.1.4 Chile
- 14.1.5 Colombia
- 14.1.6 Ecuador
- 14.1.7 Venezuela
- 14.1.8 Rest of South America
- 15. MEA Global Mixing Equipment Market For Battery Manufacturing Analysis, Insights and Forecast, 2019-2031
- 15.1. Market Analysis, Insights and Forecast - By Country/Sub-region
- 15.1.1 United Arab Emirates
- 15.1.2 Saudi Arabia
- 15.1.3 South Africa
- 15.1.4 Rest of Middle East and Africa
- 16. Competitive Analysis
- 16.1. Market Share Analysis 2024
- 16.2. Company Profiles
- 16.2.1 Processall
- 16.2.1.1. Overview
- 16.2.1.2. Products
- 16.2.1.3. SWOT Analysis
- 16.2.1.4. Recent Developments
- 16.2.1.5. Financials (Based on Availability)
- 16.2.2 Charles Ross & Son Company
- 16.2.2.1. Overview
- 16.2.2.2. Products
- 16.2.2.3. SWOT Analysis
- 16.2.2.4. Recent Developments
- 16.2.2.5. Financials (Based on Availability)
- 16.2.3 MIXACO
- 16.2.3.1. Overview
- 16.2.3.2. Products
- 16.2.3.3. SWOT Analysis
- 16.2.3.4. Recent Developments
- 16.2.3.5. Financials (Based on Availability)
- 16.2.4 XIAMEN TOB NEW ENERGY TECHNOLOGY Co LTD
- 16.2.4.1. Overview
- 16.2.4.2. Products
- 16.2.4.3. SWOT Analysis
- 16.2.4.4. Recent Developments
- 16.2.4.5. Financials (Based on Availability)
- 16.2.5 Jongia Mixing Technology
- 16.2.5.1. Overview
- 16.2.5.2. Products
- 16.2.5.3. SWOT Analysis
- 16.2.5.4. Recent Developments
- 16.2.5.5. Financials (Based on Availability)
- 16.2.6 ONGOAL
- 16.2.6.1. Overview
- 16.2.6.2. Products
- 16.2.6.3. SWOT Analysis
- 16.2.6.4. Recent Developments
- 16.2.6.5. Financials (Based on Availability)
- 16.2.7 IKA India Private Limited
- 16.2.7.1. Overview
- 16.2.7.2. Products
- 16.2.7.3. SWOT Analysis
- 16.2.7.4. Recent Developments
- 16.2.7.5. Financials (Based on Availability)
- 16.2.8 SIEHE GROUP
- 16.2.8.1. Overview
- 16.2.8.2. Products
- 16.2.8.3. SWOT Analysis
- 16.2.8.4. Recent Developments
- 16.2.8.5. Financials (Based on Availability)
- 16.2.9 SCM GROUP LIMITED HK
- 16.2.9.1. Overview
- 16.2.9.2. Products
- 16.2.9.3. SWOT Analysis
- 16.2.9.4. Recent Developments
- 16.2.9.5. Financials (Based on Availability)
- 16.2.10 Xiamen Tmax Battery Equipments Limited
- 16.2.10.1. Overview
- 16.2.10.2. Products
- 16.2.10.3. SWOT Analysis
- 16.2.10.4. Recent Developments
- 16.2.10.5. Financials (Based on Availability)
- 16.2.1 Processall
List of Figures
- Figure 1: Global Global Mixing Equipment Market For Battery Manufacturing Revenue Breakdown (Million, %) by Region 2024 & 2032
- Figure 2: Global Global Mixing Equipment Market For Battery Manufacturing Volume Breakdown (K Unit, %) by Region 2024 & 2032
- Figure 3: North America Global Mixing Equipment Market For Battery Manufacturing Revenue (Million), by Country 2024 & 2032
- Figure 4: North America Global Mixing Equipment Market For Battery Manufacturing Volume (K Unit), by Country 2024 & 2032
- Figure 5: North America Global Mixing Equipment Market For Battery Manufacturing Revenue Share (%), by Country 2024 & 2032
- Figure 6: North America Global Mixing Equipment Market For Battery Manufacturing Volume Share (%), by Country 2024 & 2032
- Figure 7: Europe Global Mixing Equipment Market For Battery Manufacturing Revenue (Million), by Country 2024 & 2032
- Figure 8: Europe Global Mixing Equipment Market For Battery Manufacturing Volume (K Unit), by Country 2024 & 2032
- Figure 9: Europe Global Mixing Equipment Market For Battery Manufacturing Revenue Share (%), by Country 2024 & 2032
- Figure 10: Europe Global Mixing Equipment Market For Battery Manufacturing Volume Share (%), by Country 2024 & 2032
- Figure 11: Asia Pacific Global Mixing Equipment Market For Battery Manufacturing Revenue (Million), by Country 2024 & 2032
- Figure 12: Asia Pacific Global Mixing Equipment Market For Battery Manufacturing Volume (K Unit), by Country 2024 & 2032
- Figure 13: Asia Pacific Global Mixing Equipment Market For Battery Manufacturing Revenue Share (%), by Country 2024 & 2032
- Figure 14: Asia Pacific Global Mixing Equipment Market For Battery Manufacturing Volume Share (%), by Country 2024 & 2032
- Figure 15: South America Global Mixing Equipment Market For Battery Manufacturing Revenue (Million), by Country 2024 & 2032
- Figure 16: South America Global Mixing Equipment Market For Battery Manufacturing Volume (K Unit), by Country 2024 & 2032
- Figure 17: South America Global Mixing Equipment Market For Battery Manufacturing Revenue Share (%), by Country 2024 & 2032
- Figure 18: South America Global Mixing Equipment Market For Battery Manufacturing Volume Share (%), by Country 2024 & 2032
- Figure 19: MEA Global Mixing Equipment Market For Battery Manufacturing Revenue (Million), by Country 2024 & 2032
- Figure 20: MEA Global Mixing Equipment Market For Battery Manufacturing Volume (K Unit), by Country 2024 & 2032
- Figure 21: MEA Global Mixing Equipment Market For Battery Manufacturing Revenue Share (%), by Country 2024 & 2032
- Figure 22: MEA Global Mixing Equipment Market For Battery Manufacturing Volume Share (%), by Country 2024 & 2032
- Figure 23: North America Global Mixing Equipment Market For Battery Manufacturing Revenue (Million), by Type 2024 & 2032
- Figure 24: North America Global Mixing Equipment Market For Battery Manufacturing Volume (K Unit), by Type 2024 & 2032
- Figure 25: North America Global Mixing Equipment Market For Battery Manufacturing Revenue Share (%), by Type 2024 & 2032
- Figure 26: North America Global Mixing Equipment Market For Battery Manufacturing Volume Share (%), by Type 2024 & 2032
- Figure 27: North America Global Mixing Equipment Market For Battery Manufacturing Revenue (Million), by Country 2024 & 2032
- Figure 28: North America Global Mixing Equipment Market For Battery Manufacturing Volume (K Unit), by Country 2024 & 2032
- Figure 29: North America Global Mixing Equipment Market For Battery Manufacturing Revenue Share (%), by Country 2024 & 2032
- Figure 30: North America Global Mixing Equipment Market For Battery Manufacturing Volume Share (%), by Country 2024 & 2032
- Figure 31: Europe Global Mixing Equipment Market For Battery Manufacturing Revenue (Million), by Type 2024 & 2032
- Figure 32: Europe Global Mixing Equipment Market For Battery Manufacturing Volume (K Unit), by Type 2024 & 2032
- Figure 33: Europe Global Mixing Equipment Market For Battery Manufacturing Revenue Share (%), by Type 2024 & 2032
- Figure 34: Europe Global Mixing Equipment Market For Battery Manufacturing Volume Share (%), by Type 2024 & 2032
- Figure 35: Europe Global Mixing Equipment Market For Battery Manufacturing Revenue (Million), by Country 2024 & 2032
- Figure 36: Europe Global Mixing Equipment Market For Battery Manufacturing Volume (K Unit), by Country 2024 & 2032
- Figure 37: Europe Global Mixing Equipment Market For Battery Manufacturing Revenue Share (%), by Country 2024 & 2032
- Figure 38: Europe Global Mixing Equipment Market For Battery Manufacturing Volume Share (%), by Country 2024 & 2032
- Figure 39: Asia Pacific Global Mixing Equipment Market For Battery Manufacturing Revenue (Million), by Type 2024 & 2032
- Figure 40: Asia Pacific Global Mixing Equipment Market For Battery Manufacturing Volume (K Unit), by Type 2024 & 2032
- Figure 41: Asia Pacific Global Mixing Equipment Market For Battery Manufacturing Revenue Share (%), by Type 2024 & 2032
- Figure 42: Asia Pacific Global Mixing Equipment Market For Battery Manufacturing Volume Share (%), by Type 2024 & 2032
- Figure 43: Asia Pacific Global Mixing Equipment Market For Battery Manufacturing Revenue (Million), by Country 2024 & 2032
- Figure 44: Asia Pacific Global Mixing Equipment Market For Battery Manufacturing Volume (K Unit), by Country 2024 & 2032
- Figure 45: Asia Pacific Global Mixing Equipment Market For Battery Manufacturing Revenue Share (%), by Country 2024 & 2032
- Figure 46: Asia Pacific Global Mixing Equipment Market For Battery Manufacturing Volume Share (%), by Country 2024 & 2032
- Figure 47: Middle East and Africa Global Mixing Equipment Market For Battery Manufacturing Revenue (Million), by Type 2024 & 2032
- Figure 48: Middle East and Africa Global Mixing Equipment Market For Battery Manufacturing Volume (K Unit), by Type 2024 & 2032
- Figure 49: Middle East and Africa Global Mixing Equipment Market For Battery Manufacturing Revenue Share (%), by Type 2024 & 2032
- Figure 50: Middle East and Africa Global Mixing Equipment Market For Battery Manufacturing Volume Share (%), by Type 2024 & 2032
- Figure 51: Middle East and Africa Global Mixing Equipment Market For Battery Manufacturing Revenue (Million), by Country 2024 & 2032
- Figure 52: Middle East and Africa Global Mixing Equipment Market For Battery Manufacturing Volume (K Unit), by Country 2024 & 2032
- Figure 53: Middle East and Africa Global Mixing Equipment Market For Battery Manufacturing Revenue Share (%), by Country 2024 & 2032
- Figure 54: Middle East and Africa Global Mixing Equipment Market For Battery Manufacturing Volume Share (%), by Country 2024 & 2032
- Figure 55: South America Global Mixing Equipment Market For Battery Manufacturing Revenue (Million), by Type 2024 & 2032
- Figure 56: South America Global Mixing Equipment Market For Battery Manufacturing Volume (K Unit), by Type 2024 & 2032
- Figure 57: South America Global Mixing Equipment Market For Battery Manufacturing Revenue Share (%), by Type 2024 & 2032
- Figure 58: South America Global Mixing Equipment Market For Battery Manufacturing Volume Share (%), by Type 2024 & 2032
- Figure 59: South America Global Mixing Equipment Market For Battery Manufacturing Revenue (Million), by Country 2024 & 2032
- Figure 60: South America Global Mixing Equipment Market For Battery Manufacturing Volume (K Unit), by Country 2024 & 2032
- Figure 61: South America Global Mixing Equipment Market For Battery Manufacturing Revenue Share (%), by Country 2024 & 2032
- Figure 62: South America Global Mixing Equipment Market For Battery Manufacturing Volume Share (%), by Country 2024 & 2032
List of Tables
- Table 1: Global Mixing Equipment Market For Battery Manufacturing Revenue Million Forecast, by Region 2019 & 2032
- Table 2: Global Mixing Equipment Market For Battery Manufacturing Volume K Unit Forecast, by Region 2019 & 2032
- Table 3: Global Mixing Equipment Market For Battery Manufacturing Revenue Million Forecast, by Type 2019 & 2032
- Table 4: Global Mixing Equipment Market For Battery Manufacturing Volume K Unit Forecast, by Type 2019 & 2032
- Table 5: Global Mixing Equipment Market For Battery Manufacturing Revenue Million Forecast, by Region 2019 & 2032
- Table 6: Global Mixing Equipment Market For Battery Manufacturing Volume K Unit Forecast, by Region 2019 & 2032
- Table 7: Global Mixing Equipment Market For Battery Manufacturing Revenue Million Forecast, by Country 2019 & 2032
- Table 8: Global Mixing Equipment Market For Battery Manufacturing Volume K Unit Forecast, by Country 2019 & 2032
- Table 9: United States Global Mixing Equipment Market For Battery Manufacturing Revenue (Million) Forecast, by Application 2019 & 2032
- Table 10: United States Global Mixing Equipment Market For Battery Manufacturing Volume (K Unit) Forecast, by Application 2019 & 2032
- Table 11: Canada Global Mixing Equipment Market For Battery Manufacturing Revenue (Million) Forecast, by Application 2019 & 2032
- Table 12: Canada Global Mixing Equipment Market For Battery Manufacturing Volume (K Unit) Forecast, by Application 2019 & 2032
- Table 13: Mexico Global Mixing Equipment Market For Battery Manufacturing Revenue (Million) Forecast, by Application 2019 & 2032
- Table 14: Mexico Global Mixing Equipment Market For Battery Manufacturing Volume (K Unit) Forecast, by Application 2019 & 2032
- Table 15: Global Mixing Equipment Market For Battery Manufacturing Revenue Million Forecast, by Country 2019 & 2032
- Table 16: Global Mixing Equipment Market For Battery Manufacturing Volume K Unit Forecast, by Country 2019 & 2032
- Table 17: Germany Global Mixing Equipment Market For Battery Manufacturing Revenue (Million) Forecast, by Application 2019 & 2032
- Table 18: Germany Global Mixing Equipment Market For Battery Manufacturing Volume (K Unit) Forecast, by Application 2019 & 2032
- Table 19: United Kingdom Global Mixing Equipment Market For Battery Manufacturing Revenue (Million) Forecast, by Application 2019 & 2032
- Table 20: United Kingdom Global Mixing Equipment Market For Battery Manufacturing Volume (K Unit) Forecast, by Application 2019 & 2032
- Table 21: France Global Mixing Equipment Market For Battery Manufacturing Revenue (Million) Forecast, by Application 2019 & 2032
- Table 22: France Global Mixing Equipment Market For Battery Manufacturing Volume (K Unit) Forecast, by Application 2019 & 2032
- Table 23: Spain Global Mixing Equipment Market For Battery Manufacturing Revenue (Million) Forecast, by Application 2019 & 2032
- Table 24: Spain Global Mixing Equipment Market For Battery Manufacturing Volume (K Unit) Forecast, by Application 2019 & 2032
- Table 25: Italy Global Mixing Equipment Market For Battery Manufacturing Revenue (Million) Forecast, by Application 2019 & 2032
- Table 26: Italy Global Mixing Equipment Market For Battery Manufacturing Volume (K Unit) Forecast, by Application 2019 & 2032
- Table 27: Spain Global Mixing Equipment Market For Battery Manufacturing Revenue (Million) Forecast, by Application 2019 & 2032
- Table 28: Spain Global Mixing Equipment Market For Battery Manufacturing Volume (K Unit) Forecast, by Application 2019 & 2032
- Table 29: Belgium Global Mixing Equipment Market For Battery Manufacturing Revenue (Million) Forecast, by Application 2019 & 2032
- Table 30: Belgium Global Mixing Equipment Market For Battery Manufacturing Volume (K Unit) Forecast, by Application 2019 & 2032
- Table 31: Netherland Global Mixing Equipment Market For Battery Manufacturing Revenue (Million) Forecast, by Application 2019 & 2032
- Table 32: Netherland Global Mixing Equipment Market For Battery Manufacturing Volume (K Unit) Forecast, by Application 2019 & 2032
- Table 33: Nordics Global Mixing Equipment Market For Battery Manufacturing Revenue (Million) Forecast, by Application 2019 & 2032
- Table 34: Nordics Global Mixing Equipment Market For Battery Manufacturing Volume (K Unit) Forecast, by Application 2019 & 2032
- Table 35: Rest of Europe Global Mixing Equipment Market For Battery Manufacturing Revenue (Million) Forecast, by Application 2019 & 2032
- Table 36: Rest of Europe Global Mixing Equipment Market For Battery Manufacturing Volume (K Unit) Forecast, by Application 2019 & 2032
- Table 37: Global Mixing Equipment Market For Battery Manufacturing Revenue Million Forecast, by Country 2019 & 2032
- Table 38: Global Mixing Equipment Market For Battery Manufacturing Volume K Unit Forecast, by Country 2019 & 2032
- Table 39: China Global Mixing Equipment Market For Battery Manufacturing Revenue (Million) Forecast, by Application 2019 & 2032
- Table 40: China Global Mixing Equipment Market For Battery Manufacturing Volume (K Unit) Forecast, by Application 2019 & 2032
- Table 41: Japan Global Mixing Equipment Market For Battery Manufacturing Revenue (Million) Forecast, by Application 2019 & 2032
- Table 42: Japan Global Mixing Equipment Market For Battery Manufacturing Volume (K Unit) Forecast, by Application 2019 & 2032
- Table 43: India Global Mixing Equipment Market For Battery Manufacturing Revenue (Million) Forecast, by Application 2019 & 2032
- Table 44: India Global Mixing Equipment Market For Battery Manufacturing Volume (K Unit) Forecast, by Application 2019 & 2032
- Table 45: South Korea Global Mixing Equipment Market For Battery Manufacturing Revenue (Million) Forecast, by Application 2019 & 2032
- Table 46: South Korea Global Mixing Equipment Market For Battery Manufacturing Volume (K Unit) Forecast, by Application 2019 & 2032
- Table 47: Southeast Asia Global Mixing Equipment Market For Battery Manufacturing Revenue (Million) Forecast, by Application 2019 & 2032
- Table 48: Southeast Asia Global Mixing Equipment Market For Battery Manufacturing Volume (K Unit) Forecast, by Application 2019 & 2032
- Table 49: Australia Global Mixing Equipment Market For Battery Manufacturing Revenue (Million) Forecast, by Application 2019 & 2032
- Table 50: Australia Global Mixing Equipment Market For Battery Manufacturing Volume (K Unit) Forecast, by Application 2019 & 2032
- Table 51: Indonesia Global Mixing Equipment Market For Battery Manufacturing Revenue (Million) Forecast, by Application 2019 & 2032
- Table 52: Indonesia Global Mixing Equipment Market For Battery Manufacturing Volume (K Unit) Forecast, by Application 2019 & 2032
- Table 53: Phillipes Global Mixing Equipment Market For Battery Manufacturing Revenue (Million) Forecast, by Application 2019 & 2032
- Table 54: Phillipes Global Mixing Equipment Market For Battery Manufacturing Volume (K Unit) Forecast, by Application 2019 & 2032
- Table 55: Singapore Global Mixing Equipment Market For Battery Manufacturing Revenue (Million) Forecast, by Application 2019 & 2032
- Table 56: Singapore Global Mixing Equipment Market For Battery Manufacturing Volume (K Unit) Forecast, by Application 2019 & 2032
- Table 57: Thailandc Global Mixing Equipment Market For Battery Manufacturing Revenue (Million) Forecast, by Application 2019 & 2032
- Table 58: Thailandc Global Mixing Equipment Market For Battery Manufacturing Volume (K Unit) Forecast, by Application 2019 & 2032
- Table 59: Rest of Asia Pacific Global Mixing Equipment Market For Battery Manufacturing Revenue (Million) Forecast, by Application 2019 & 2032
- Table 60: Rest of Asia Pacific Global Mixing Equipment Market For Battery Manufacturing Volume (K Unit) Forecast, by Application 2019 & 2032
- Table 61: Global Mixing Equipment Market For Battery Manufacturing Revenue Million Forecast, by Country 2019 & 2032
- Table 62: Global Mixing Equipment Market For Battery Manufacturing Volume K Unit Forecast, by Country 2019 & 2032
- Table 63: Brazil Global Mixing Equipment Market For Battery Manufacturing Revenue (Million) Forecast, by Application 2019 & 2032
- Table 64: Brazil Global Mixing Equipment Market For Battery Manufacturing Volume (K Unit) Forecast, by Application 2019 & 2032
- Table 65: Argentina Global Mixing Equipment Market For Battery Manufacturing Revenue (Million) Forecast, by Application 2019 & 2032
- Table 66: Argentina Global Mixing Equipment Market For Battery Manufacturing Volume (K Unit) Forecast, by Application 2019 & 2032
- Table 67: Peru Global Mixing Equipment Market For Battery Manufacturing Revenue (Million) Forecast, by Application 2019 & 2032
- Table 68: Peru Global Mixing Equipment Market For Battery Manufacturing Volume (K Unit) Forecast, by Application 2019 & 2032
- Table 69: Chile Global Mixing Equipment Market For Battery Manufacturing Revenue (Million) Forecast, by Application 2019 & 2032
- Table 70: Chile Global Mixing Equipment Market For Battery Manufacturing Volume (K Unit) Forecast, by Application 2019 & 2032
- Table 71: Colombia Global Mixing Equipment Market For Battery Manufacturing Revenue (Million) Forecast, by Application 2019 & 2032
- Table 72: Colombia Global Mixing Equipment Market For Battery Manufacturing Volume (K Unit) Forecast, by Application 2019 & 2032
- Table 73: Ecuador Global Mixing Equipment Market For Battery Manufacturing Revenue (Million) Forecast, by Application 2019 & 2032
- Table 74: Ecuador Global Mixing Equipment Market For Battery Manufacturing Volume (K Unit) Forecast, by Application 2019 & 2032
- Table 75: Venezuela Global Mixing Equipment Market For Battery Manufacturing Revenue (Million) Forecast, by Application 2019 & 2032
- Table 76: Venezuela Global Mixing Equipment Market For Battery Manufacturing Volume (K Unit) Forecast, by Application 2019 & 2032
- Table 77: Rest of South America Global Mixing Equipment Market For Battery Manufacturing Revenue (Million) Forecast, by Application 2019 & 2032
- Table 78: Rest of South America Global Mixing Equipment Market For Battery Manufacturing Volume (K Unit) Forecast, by Application 2019 & 2032
- Table 79: Global Mixing Equipment Market For Battery Manufacturing Revenue Million Forecast, by Country 2019 & 2032
- Table 80: Global Mixing Equipment Market For Battery Manufacturing Volume K Unit Forecast, by Country 2019 & 2032
- Table 81: United Arab Emirates Global Mixing Equipment Market For Battery Manufacturing Revenue (Million) Forecast, by Application 2019 & 2032
- Table 82: United Arab Emirates Global Mixing Equipment Market For Battery Manufacturing Volume (K Unit) Forecast, by Application 2019 & 2032
- Table 83: Saudi Arabia Global Mixing Equipment Market For Battery Manufacturing Revenue (Million) Forecast, by Application 2019 & 2032
- Table 84: Saudi Arabia Global Mixing Equipment Market For Battery Manufacturing Volume (K Unit) Forecast, by Application 2019 & 2032
- Table 85: South Africa Global Mixing Equipment Market For Battery Manufacturing Revenue (Million) Forecast, by Application 2019 & 2032
- Table 86: South Africa Global Mixing Equipment Market For Battery Manufacturing Volume (K Unit) Forecast, by Application 2019 & 2032
- Table 87: Rest of Middle East and Africa Global Mixing Equipment Market For Battery Manufacturing Revenue (Million) Forecast, by Application 2019 & 2032
- Table 88: Rest of Middle East and Africa Global Mixing Equipment Market For Battery Manufacturing Volume (K Unit) Forecast, by Application 2019 & 2032
- Table 89: Global Mixing Equipment Market For Battery Manufacturing Revenue Million Forecast, by Type 2019 & 2032
- Table 90: Global Mixing Equipment Market For Battery Manufacturing Volume K Unit Forecast, by Type 2019 & 2032
- Table 91: Global Mixing Equipment Market For Battery Manufacturing Revenue Million Forecast, by Country 2019 & 2032
- Table 92: Global Mixing Equipment Market For Battery Manufacturing Volume K Unit Forecast, by Country 2019 & 2032
- Table 93: United States Global Mixing Equipment Market For Battery Manufacturing Revenue (Million) Forecast, by Application 2019 & 2032
- Table 94: United States Global Mixing Equipment Market For Battery Manufacturing Volume (K Unit) Forecast, by Application 2019 & 2032
- Table 95: Canada Global Mixing Equipment Market For Battery Manufacturing Revenue (Million) Forecast, by Application 2019 & 2032
- Table 96: Canada Global Mixing Equipment Market For Battery Manufacturing Volume (K Unit) Forecast, by Application 2019 & 2032
- Table 97: Rest of North America Global Mixing Equipment Market For Battery Manufacturing Revenue (Million) Forecast, by Application 2019 & 2032
- Table 98: Rest of North America Global Mixing Equipment Market For Battery Manufacturing Volume (K Unit) Forecast, by Application 2019 & 2032
- Table 99: Global Mixing Equipment Market For Battery Manufacturing Revenue Million Forecast, by Type 2019 & 2032
- Table 100: Global Mixing Equipment Market For Battery Manufacturing Volume K Unit Forecast, by Type 2019 & 2032
- Table 101: Global Mixing Equipment Market For Battery Manufacturing Revenue Million Forecast, by Country 2019 & 2032
- Table 102: Global Mixing Equipment Market For Battery Manufacturing Volume K Unit Forecast, by Country 2019 & 2032
- Table 103: Germany Global Mixing Equipment Market For Battery Manufacturing Revenue (Million) Forecast, by Application 2019 & 2032
- Table 104: Germany Global Mixing Equipment Market For Battery Manufacturing Volume (K Unit) Forecast, by Application 2019 & 2032
- Table 105: France Global Mixing Equipment Market For Battery Manufacturing Revenue (Million) Forecast, by Application 2019 & 2032
- Table 106: France Global Mixing Equipment Market For Battery Manufacturing Volume (K Unit) Forecast, by Application 2019 & 2032
- Table 107: United Kingdom Global Mixing Equipment Market For Battery Manufacturing Revenue (Million) Forecast, by Application 2019 & 2032
- Table 108: United Kingdom Global Mixing Equipment Market For Battery Manufacturing Volume (K Unit) Forecast, by Application 2019 & 2032
- Table 109: Italy Global Mixing Equipment Market For Battery Manufacturing Revenue (Million) Forecast, by Application 2019 & 2032
- Table 110: Italy Global Mixing Equipment Market For Battery Manufacturing Volume (K Unit) Forecast, by Application 2019 & 2032
- Table 111: Spain Global Mixing Equipment Market For Battery Manufacturing Revenue (Million) Forecast, by Application 2019 & 2032
- Table 112: Spain Global Mixing Equipment Market For Battery Manufacturing Volume (K Unit) Forecast, by Application 2019 & 2032
- Table 113: NORDIC Global Mixing Equipment Market For Battery Manufacturing Revenue (Million) Forecast, by Application 2019 & 2032
- Table 114: NORDIC Global Mixing Equipment Market For Battery Manufacturing Volume (K Unit) Forecast, by Application 2019 & 2032
- Table 115: Turkey Global Mixing Equipment Market For Battery Manufacturing Revenue (Million) Forecast, by Application 2019 & 2032
- Table 116: Turkey Global Mixing Equipment Market For Battery Manufacturing Volume (K Unit) Forecast, by Application 2019 & 2032
- Table 117: Russia Global Mixing Equipment Market For Battery Manufacturing Revenue (Million) Forecast, by Application 2019 & 2032
- Table 118: Russia Global Mixing Equipment Market For Battery Manufacturing Volume (K Unit) Forecast, by Application 2019 & 2032
- Table 119: Rest of Europe Global Mixing Equipment Market For Battery Manufacturing Revenue (Million) Forecast, by Application 2019 & 2032
- Table 120: Rest of Europe Global Mixing Equipment Market For Battery Manufacturing Volume (K Unit) Forecast, by Application 2019 & 2032
- Table 121: Global Mixing Equipment Market For Battery Manufacturing Revenue Million Forecast, by Type 2019 & 2032
- Table 122: Global Mixing Equipment Market For Battery Manufacturing Volume K Unit Forecast, by Type 2019 & 2032
- Table 123: Global Mixing Equipment Market For Battery Manufacturing Revenue Million Forecast, by Country 2019 & 2032
- Table 124: Global Mixing Equipment Market For Battery Manufacturing Volume K Unit Forecast, by Country 2019 & 2032
- Table 125: China Global Mixing Equipment Market For Battery Manufacturing Revenue (Million) Forecast, by Application 2019 & 2032
- Table 126: China Global Mixing Equipment Market For Battery Manufacturing Volume (K Unit) Forecast, by Application 2019 & 2032
- Table 127: India Global Mixing Equipment Market For Battery Manufacturing Revenue (Million) Forecast, by Application 2019 & 2032
- Table 128: India Global Mixing Equipment Market For Battery Manufacturing Volume (K Unit) Forecast, by Application 2019 & 2032
- Table 129: Australia Global Mixing Equipment Market For Battery Manufacturing Revenue (Million) Forecast, by Application 2019 & 2032
- Table 130: Australia Global Mixing Equipment Market For Battery Manufacturing Volume (K Unit) Forecast, by Application 2019 & 2032
- Table 131: Japan Global Mixing Equipment Market For Battery Manufacturing Revenue (Million) Forecast, by Application 2019 & 2032
- Table 132: Japan Global Mixing Equipment Market For Battery Manufacturing Volume (K Unit) Forecast, by Application 2019 & 2032
- Table 133: Malaysia Global Mixing Equipment Market For Battery Manufacturing Revenue (Million) Forecast, by Application 2019 & 2032
- Table 134: Malaysia Global Mixing Equipment Market For Battery Manufacturing Volume (K Unit) Forecast, by Application 2019 & 2032
- Table 135: Thailand Global Mixing Equipment Market For Battery Manufacturing Revenue (Million) Forecast, by Application 2019 & 2032
- Table 136: Thailand Global Mixing Equipment Market For Battery Manufacturing Volume (K Unit) Forecast, by Application 2019 & 2032
- Table 137: Indonesia Global Mixing Equipment Market For Battery Manufacturing Revenue (Million) Forecast, by Application 2019 & 2032
- Table 138: Indonesia Global Mixing Equipment Market For Battery Manufacturing Volume (K Unit) Forecast, by Application 2019 & 2032
- Table 139: Vietnam Global Mixing Equipment Market For Battery Manufacturing Revenue (Million) Forecast, by Application 2019 & 2032
- Table 140: Vietnam Global Mixing Equipment Market For Battery Manufacturing Volume (K Unit) Forecast, by Application 2019 & 2032
- Table 141: Rest of Asia Pacific Global Mixing Equipment Market For Battery Manufacturing Revenue (Million) Forecast, by Application 2019 & 2032
- Table 142: Rest of Asia Pacific Global Mixing Equipment Market For Battery Manufacturing Volume (K Unit) Forecast, by Application 2019 & 2032
- Table 143: Global Mixing Equipment Market For Battery Manufacturing Revenue Million Forecast, by Type 2019 & 2032
- Table 144: Global Mixing Equipment Market For Battery Manufacturing Volume K Unit Forecast, by Type 2019 & 2032
- Table 145: Global Mixing Equipment Market For Battery Manufacturing Revenue Million Forecast, by Country 2019 & 2032
- Table 146: Global Mixing Equipment Market For Battery Manufacturing Volume K Unit Forecast, by Country 2019 & 2032
- Table 147: Saudi Arabia Global Mixing Equipment Market For Battery Manufacturing Revenue (Million) Forecast, by Application 2019 & 2032
- Table 148: Saudi Arabia Global Mixing Equipment Market For Battery Manufacturing Volume (K Unit) Forecast, by Application 2019 & 2032
- Table 149: United Arab Emirates Global Mixing Equipment Market For Battery Manufacturing Revenue (Million) Forecast, by Application 2019 & 2032
- Table 150: United Arab Emirates Global Mixing Equipment Market For Battery Manufacturing Volume (K Unit) Forecast, by Application 2019 & 2032
- Table 151: Qatar Global Mixing Equipment Market For Battery Manufacturing Revenue (Million) Forecast, by Application 2019 & 2032
- Table 152: Qatar Global Mixing Equipment Market For Battery Manufacturing Volume (K Unit) Forecast, by Application 2019 & 2032
- Table 153: Egypt Global Mixing Equipment Market For Battery Manufacturing Revenue (Million) Forecast, by Application 2019 & 2032
- Table 154: Egypt Global Mixing Equipment Market For Battery Manufacturing Volume (K Unit) Forecast, by Application 2019 & 2032
- Table 155: Nigeria Global Mixing Equipment Market For Battery Manufacturing Revenue (Million) Forecast, by Application 2019 & 2032
- Table 156: Nigeria Global Mixing Equipment Market For Battery Manufacturing Volume (K Unit) Forecast, by Application 2019 & 2032
- Table 157: South Africa Global Mixing Equipment Market For Battery Manufacturing Revenue (Million) Forecast, by Application 2019 & 2032
- Table 158: South Africa Global Mixing Equipment Market For Battery Manufacturing Volume (K Unit) Forecast, by Application 2019 & 2032
- Table 159: Rest of Middle East and Africa Global Mixing Equipment Market For Battery Manufacturing Revenue (Million) Forecast, by Application 2019 & 2032
- Table 160: Rest of Middle East and Africa Global Mixing Equipment Market For Battery Manufacturing Volume (K Unit) Forecast, by Application 2019 & 2032
- Table 161: Global Mixing Equipment Market For Battery Manufacturing Revenue Million Forecast, by Type 2019 & 2032
- Table 162: Global Mixing Equipment Market For Battery Manufacturing Volume K Unit Forecast, by Type 2019 & 2032
- Table 163: Global Mixing Equipment Market For Battery Manufacturing Revenue Million Forecast, by Country 2019 & 2032
- Table 164: Global Mixing Equipment Market For Battery Manufacturing Volume K Unit Forecast, by Country 2019 & 2032
- Table 165: Brazil Global Mixing Equipment Market For Battery Manufacturing Revenue (Million) Forecast, by Application 2019 & 2032
- Table 166: Brazil Global Mixing Equipment Market For Battery Manufacturing Volume (K Unit) Forecast, by Application 2019 & 2032
- Table 167: Argentina Global Mixing Equipment Market For Battery Manufacturing Revenue (Million) Forecast, by Application 2019 & 2032
- Table 168: Argentina Global Mixing Equipment Market For Battery Manufacturing Volume (K Unit) Forecast, by Application 2019 & 2032
- Table 169: Columbia Global Mixing Equipment Market For Battery Manufacturing Revenue (Million) Forecast, by Application 2019 & 2032
- Table 170: Columbia Global Mixing Equipment Market For Battery Manufacturing Volume (K Unit) Forecast, by Application 2019 & 2032
- Table 171: Rest of South America Global Mixing Equipment Market For Battery Manufacturing Revenue (Million) Forecast, by Application 2019 & 2032
- Table 172: Rest of South America Global Mixing Equipment Market For Battery Manufacturing Volume (K Unit) Forecast, by Application 2019 & 2032
Frequently Asked Questions
1. What is the projected Compound Annual Growth Rate (CAGR) of the Global Mixing Equipment Market For Battery Manufacturing?
The projected CAGR is approximately 21.20%.
2. Which companies are prominent players in the Global Mixing Equipment Market For Battery Manufacturing?
Key companies in the market include Processall, Charles Ross & Son Company, MIXACO, XIAMEN TOB NEW ENERGY TECHNOLOGY Co LTD, Jongia Mixing Technology, ONGOAL, IKA India Private Limited, SIEHE GROUP, SCM GROUP LIMITED HK, Xiamen Tmax Battery Equipments Limited.
3. What are the main segments of the Global Mixing Equipment Market For Battery Manufacturing?
The market segments include Type.
4. Can you provide details about the market size?
The market size is estimated to be USD 1.69 Million as of 2022.
5. What are some drivers contributing to market growth?
4.; The Increase in Investments to Enhance the Battery Production Capacity4.; Rising Adoption of Electric Vehicles.
6. What are the notable trends driving market growth?
Investments To Enhance the Battery Production Capacity is expected to Drive the Market Growth.
7. Are there any restraints impacting market growth?
4.; The High Logistic Cost.
8. Can you provide examples of recent developments in the market?
September 2023: Fraunhofer Research Institution for Battery Cell Production used a 30-millimeter extruder at FFB’s new R&D site in Münster, Germany. Fraunhofer-Gesellschaft’s research organization is also building its FFB PreFab test facility, with a throughput of up to 1,200 liters of electrode/battery slurry per hour.
9. What pricing options are available for accessing the report?
Pricing options include single-user, multi-user, and enterprise licenses priced at USD 4750, USD 5250, and USD 8750 respectively.
10. Is the market size provided in terms of value or volume?
The market size is provided in terms of value, measured in Million and volume, measured in K Unit.
11. Are there any specific market keywords associated with the report?
Yes, the market keyword associated with the report is "Global Mixing Equipment Market For Battery Manufacturing," which aids in identifying and referencing the specific market segment covered.
12. How do I determine which pricing option suits my needs best?
The pricing options vary based on user requirements and access needs. Individual users may opt for single-user licenses, while businesses requiring broader access may choose multi-user or enterprise licenses for cost-effective access to the report.
13. Are there any additional resources or data provided in the Global Mixing Equipment Market For Battery Manufacturing report?
While the report offers comprehensive insights, it's advisable to review the specific contents or supplementary materials provided to ascertain if additional resources or data are available.
14. How can I stay updated on further developments or reports in the Global Mixing Equipment Market For Battery Manufacturing?
To stay informed about further developments, trends, and reports in the Global Mixing Equipment Market For Battery Manufacturing, consider subscribing to industry newsletters, following relevant companies and organizations, or regularly checking reputable industry news sources and publications.
Methodology
Step 1 - Identification of Relevant Samples Size from Population Database


Step 2 - Approaches for Defining Global Market Size (Value, Volume* & Price*)

Note*: In applicable scenarios
Step 3 - Data Sources
Primary Research
- Web Analytics
- Survey Reports
- Research Institute
- Latest Research Reports
- Opinion Leaders
Secondary Research
- Annual Reports
- White Paper
- Latest Press Release
- Industry Association
- Paid Database
- Investor Presentations

Step 4 - Data Triangulation
Involves using different sources of information in order to increase the validity of a study
These sources are likely to be stakeholders in a program - participants, other researchers, program staff, other community members, and so on.
Then we put all data in single framework & apply various statistical tools to find out the dynamic on the market.
During the analysis stage, feedback from the stakeholder groups would be compared to determine areas of agreement as well as areas of divergence
