

Key Insights
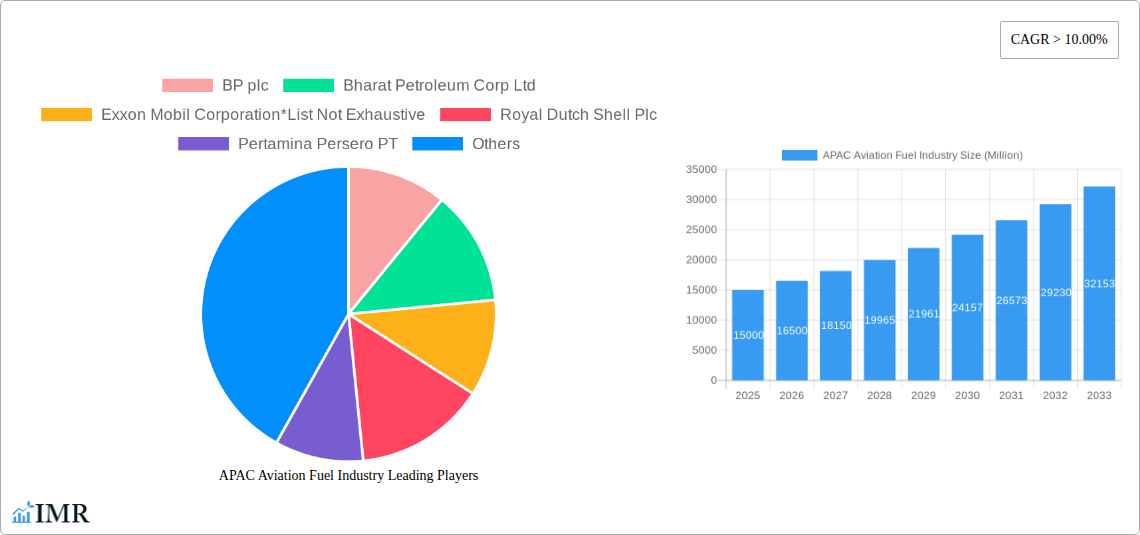
The Asia-Pacific (APAC) aviation fuel market is experiencing robust growth, driven by a surge in air passenger traffic and the expansion of low-cost carriers across the region. This burgeoning market, projected to maintain a Compound Annual Growth Rate (CAGR) exceeding 10%, presents significant opportunities for both established players and new entrants. Key growth drivers include increasing disposable incomes, rising tourism, and the development of improved airport infrastructure in rapidly developing economies like India, China, and Southeast Asia. The segment is further fueled by the increasing adoption of larger and more fuel-efficient aircraft, although concerns regarding environmental sustainability are prompting a gradual shift toward the utilization of sustainable aviation fuels (SAFs), including aviation biofuels. However, challenges persist, including volatile crude oil prices, geopolitical instability impacting fuel supply chains, and the need for consistent regulatory frameworks supporting SAF development and adoption. The market is segmented by fuel type (ATF, Aviation Biofuel, Others) and application (Commercial Aircraft, Military Aircraft, General Aviation), with commercial aviation currently dominating the market share. Competition is intense, with major international and regional players vying for market dominance, leading to price competition and a push for innovation in fuel efficiency and sustainability.
Within the APAC region, China and India are expected to be the primary growth engines, fueled by their expanding middle classes and burgeoning aviation sectors. Southeast Asia also presents a significant opportunity, driven by increasing tourism and the expansion of regional air travel networks. While ATF currently holds the largest market share, the adoption of Aviation Biofuel is poised for significant expansion over the forecast period due to rising environmental concerns and government incentives promoting sustainable aviation. However, the high initial investment costs associated with SAF production and infrastructure remain a significant barrier to widespread adoption. The market will likely see increased consolidation amongst players, with larger companies acquiring smaller ones to expand their market reach and diversify their fuel offerings, ensuring a competitive landscape throughout the forecast period (2025-2033).
APAC Aviation Fuel Industry Market Report: 2019-2033
This comprehensive report provides an in-depth analysis of the Asia-Pacific (APAC) aviation fuel industry, encompassing market dynamics, growth trends, key players, and future outlook. The study period covers 2019-2033, with 2025 as the base and estimated year. The report meticulously examines the parent market (APAC energy sector) and its child market (APAC aviation fuel), offering granular insights for informed decision-making. The market size is presented in million units throughout.
APAC Aviation Fuel Industry Market Dynamics & Structure
This section analyzes the competitive landscape, technological advancements, regulatory environment, and market trends within the APAC aviation fuel industry. We explore market concentration, identifying key players and their market share (e.g., BP plc holding xx%, Shell holding xx%, etc.). The impact of technological innovations, such as sustainable aviation fuels (SAFs), on market dynamics is thoroughly examined. We also analyze the regulatory frameworks governing fuel production, distribution, and consumption, alongside competitive product substitutes and their influence. The report further delves into end-user demographics (commercial vs. military aviation) and the prevalence of mergers and acquisitions (M&A) activities within the sector, including estimated deal volumes (xx deals in the past five years).
- Market Concentration: Highly concentrated market with top 10 players holding xx% market share.
- Technological Innovation: Focus on SAF development and adoption is a primary driver. Barriers include high production costs and limited infrastructure.
- Regulatory Landscape: Varying regulations across APAC nations influencing fuel specifications and pricing.
- M&A Activity: Consolidation expected to continue, driven by economies of scale and market share expansion.
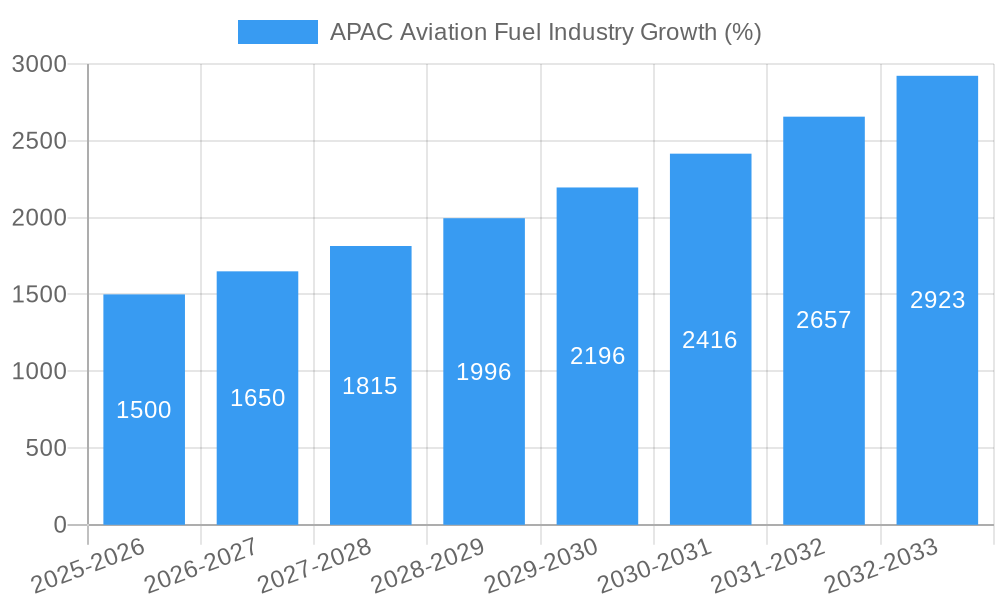
APAC Aviation Fuel Industry Growth Trends & Insights
This section presents a detailed analysis of the APAC aviation fuel market's growth trajectory. Using historical data from 2019-2024 and projected figures up to 2033, we illustrate the market size evolution, demonstrating a CAGR of xx% from 2025 to 2033. The analysis encompasses factors such as fluctuating fuel prices, air travel demand, economic growth across APAC nations, and the adoption of new technologies like SAFs and improved engine efficiency. We examine shifts in consumer behavior, including increasing awareness of environmental concerns and a growing preference for sustainable travel options. The section will also feature market penetration of various fuel types and the impact of technological disruptions on market share.
- Market Size Evolution: From xx million units in 2019 to a projected xx million units in 2033.
- Adoption Rates of SAFs: Expected to increase from xx% in 2025 to xx% by 2033.
- Technological Disruptions: Continuous improvement in engine efficiency affecting fuel consumption.
- Consumer Behavior: Growing demand for sustainable aviation fuels.
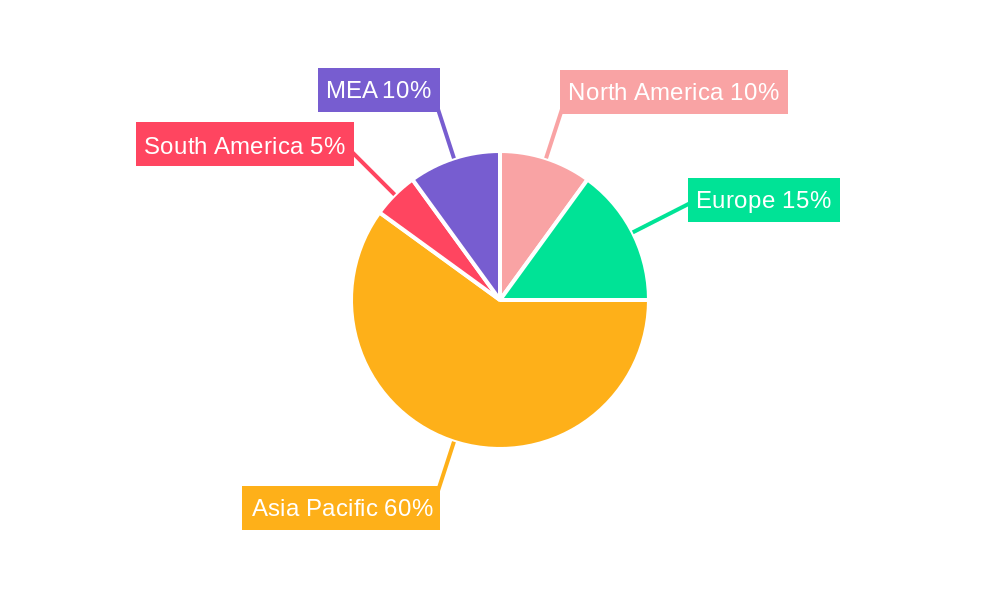
Dominant Regions, Countries, or Segments in APAC Aviation Fuel Industry
This section pinpoints the leading regions, countries, and segments within the APAC aviation fuel market driving its growth. We analyze market share and growth potential for each fuel type (Air Turbine Fuel (ATF), Aviation Biofuel, Others) and application (Commercial Aircraft, Military Aircraft, General Aviation). Key drivers for each dominant segment are identified, including economic policies, infrastructure development, and government initiatives promoting sustainable aviation. Specific examples such as India's rapid air travel growth impacting ATF demand, or China's investment in SAF production will be discussed.
- Leading Region: xx (based on market size and growth rate)
- Leading Country: xx (due to factors such as xx)
- Dominant Fuel Type: ATF (xx% market share), followed by xx
- Dominant Application: Commercial Aircraft (xx% market share) due to xx
APAC Aviation Fuel Industry Product Landscape
The APAC aviation fuel market offers a range of products, primarily ATF, with a growing emphasis on SAFs and other alternative fuels. Product innovations focus on enhancing fuel efficiency, reducing emissions, and improving fuel quality. Performance metrics such as energy density, freezing point, and sulfur content are key considerations. Unique selling propositions for various products are analyzed, along with technological advancements that are improving the environmental impact and economic viability of alternative fuels. This market sees a steady influx of improved products and technology.
Key Drivers, Barriers & Challenges in APAC Aviation Fuel Industry
Several factors drive growth in the APAC aviation fuel market. Primarily, the increasing air passenger traffic driven by economic growth and rising disposable incomes in many APAC nations is a major driver. Furthermore, government policies supporting infrastructure development and the aviation sector are also pivotal. Lastly, technological advancements in fuel efficiency and sustainable alternatives also fuel market growth.
However, challenges exist. Price volatility in crude oil significantly impacts aviation fuel prices. Stringent environmental regulations necessitate investment in sustainable fuel technologies, and supply chain disruptions can hinder fuel availability. Geopolitical events further add to uncertainties.
Emerging Opportunities in APAC Aviation Fuel Industry
The APAC aviation fuel industry presents several opportunities. The expanding middle class in several nations boosts air travel demand, while the growing focus on sustainability creates demand for SAFs. Untapped markets in less-developed regions offer potential for expansion. The development of innovative fuel technologies and strategic partnerships to secure fuel supply are key to seizing these opportunities.
Growth Accelerators in the APAC Aviation Fuel Industry Industry
Long-term growth in the APAC aviation fuel industry will be fueled by technological breakthroughs in SAF production, leading to cost reductions and increased availability. Strategic partnerships between fuel suppliers, airlines, and technology providers will accelerate the adoption of sustainable aviation fuels. Market expansion into underserved regions and the development of efficient fuel distribution networks will also contribute significantly to growth.
Key Players Shaping the APAC Aviation Fuel Industry Market
- BP plc
- Bharat Petroleum Corp Ltd
- Exxon Mobil Corporation
- Royal Dutch Shell Plc
- Pertamina Persero PT
- Chevron Corporation
- World Fuel Services Corp
- Petronas Aviation Sdn Bhd
- China Aviation Oil Corporation Ltd
- Vitol Holding BV
Notable Milestones in APAC Aviation Fuel Industry Sector
- 2021: Significant investment in SAF production announced by several key players.
- 2022: Introduction of new regulations on aviation fuel emissions in several APAC countries.
- 2023: Successful trial of a new generation SAF blend by a major airline.
In-Depth APAC Aviation Fuel Industry Market Outlook
The future of the APAC aviation fuel market is promising. Continued growth in air travel, coupled with increasing adoption of sustainable aviation fuels, will drive demand. Strategic partnerships and technological advancements will play a crucial role in shaping the market's trajectory, creating significant opportunities for businesses to capitalize on the growing demand for efficient and environmentally responsible aviation fuel solutions. The long-term growth prospects are very positive, with the market projected to reach xx million units by 2033.
APAC Aviation Fuel Industry Segmentation
-
1. Fuel Type
- 1.1. Air Turbine Fuel (ATF)
- 1.2. Aviation Biofuel
- 1.3. Others
-
2. Application
- 2.1. Commercial Aircraft
- 2.2. Military Aircraft
- 2.3. General Aviation
-
3. Geography
- 3.1. China
- 3.2. Japan
- 3.3. India
- 3.4. Indonesia
- 3.5. Australia
- 3.6. Rest of Asia-Pacific
APAC Aviation Fuel Industry Segmentation By Geography
- 1. China
- 2. Japan
- 3. India
- 4. Indonesia
- 5. Australia
- 6. Rest of Asia Pacific
APAC Aviation Fuel Industry REPORT HIGHLIGHTS
| Aspects | Details |
|---|---|
| Study Period | 2019-2033 |
| Base Year | 2024 |
| Estimated Year | 2025 |
| Forecast Period | 2025-2033 |
| Historical Period | 2019-2024 |
| Growth Rate | CAGR of > 10.00% from 2019-2033 |
| Segmentation |
|
Table of Contents
- 1. Introduction
- 1.1. Research Scope
- 1.2. Market Segmentation
- 1.3. Research Methodology
- 1.4. Definitions and Assumptions
- 2. Executive Summary
- 2.1. Introduction
- 3. Market Dynamics
- 3.1. Introduction
- 3.2. Market Drivers
- 3.2.1. 4.; Increase in Prices of Electricity Procured from Conventional Mechanisms 4.; Decline in Cost of Solar Energy Infrastructure
- 3.3. Market Restrains
- 3.3.1. 4.; Competition from Other Alternative Energy Sources
- 3.4. Market Trends
- 3.4.1. Commercial Aircraft Segment to Dominate the Market
- 4. Market Factor Analysis
- 4.1. Porters Five Forces
- 4.2. Supply/Value Chain
- 4.3. PESTEL analysis
- 4.4. Market Entropy
- 4.5. Patent/Trademark Analysis
- 5. Global APAC Aviation Fuel Industry Analysis, Insights and Forecast, 2019-2031
- 5.1. Market Analysis, Insights and Forecast - by Fuel Type
- 5.1.1. Air Turbine Fuel (ATF)
- 5.1.2. Aviation Biofuel
- 5.1.3. Others
- 5.2. Market Analysis, Insights and Forecast - by Application
- 5.2.1. Commercial Aircraft
- 5.2.2. Military Aircraft
- 5.2.3. General Aviation
- 5.3. Market Analysis, Insights and Forecast - by Geography
- 5.3.1. China
- 5.3.2. Japan
- 5.3.3. India
- 5.3.4. Indonesia
- 5.3.5. Australia
- 5.3.6. Rest of Asia-Pacific
- 5.4. Market Analysis, Insights and Forecast - by Region
- 5.4.1. China
- 5.4.2. Japan
- 5.4.3. India
- 5.4.4. Indonesia
- 5.4.5. Australia
- 5.4.6. Rest of Asia Pacific
- 5.1. Market Analysis, Insights and Forecast - by Fuel Type
- 6. China APAC Aviation Fuel Industry Analysis, Insights and Forecast, 2019-2031
- 6.1. Market Analysis, Insights and Forecast - by Fuel Type
- 6.1.1. Air Turbine Fuel (ATF)
- 6.1.2. Aviation Biofuel
- 6.1.3. Others
- 6.2. Market Analysis, Insights and Forecast - by Application
- 6.2.1. Commercial Aircraft
- 6.2.2. Military Aircraft
- 6.2.3. General Aviation
- 6.3. Market Analysis, Insights and Forecast - by Geography
- 6.3.1. China
- 6.3.2. Japan
- 6.3.3. India
- 6.3.4. Indonesia
- 6.3.5. Australia
- 6.3.6. Rest of Asia-Pacific
- 6.1. Market Analysis, Insights and Forecast - by Fuel Type
- 7. Japan APAC Aviation Fuel Industry Analysis, Insights and Forecast, 2019-2031
- 7.1. Market Analysis, Insights and Forecast - by Fuel Type
- 7.1.1. Air Turbine Fuel (ATF)
- 7.1.2. Aviation Biofuel
- 7.1.3. Others
- 7.2. Market Analysis, Insights and Forecast - by Application
- 7.2.1. Commercial Aircraft
- 7.2.2. Military Aircraft
- 7.2.3. General Aviation
- 7.3. Market Analysis, Insights and Forecast - by Geography
- 7.3.1. China
- 7.3.2. Japan
- 7.3.3. India
- 7.3.4. Indonesia
- 7.3.5. Australia
- 7.3.6. Rest of Asia-Pacific
- 7.1. Market Analysis, Insights and Forecast - by Fuel Type
- 8. India APAC Aviation Fuel Industry Analysis, Insights and Forecast, 2019-2031
- 8.1. Market Analysis, Insights and Forecast - by Fuel Type
- 8.1.1. Air Turbine Fuel (ATF)
- 8.1.2. Aviation Biofuel
- 8.1.3. Others
- 8.2. Market Analysis, Insights and Forecast - by Application
- 8.2.1. Commercial Aircraft
- 8.2.2. Military Aircraft
- 8.2.3. General Aviation
- 8.3. Market Analysis, Insights and Forecast - by Geography
- 8.3.1. China
- 8.3.2. Japan
- 8.3.3. India
- 8.3.4. Indonesia
- 8.3.5. Australia
- 8.3.6. Rest of Asia-Pacific
- 8.1. Market Analysis, Insights and Forecast - by Fuel Type
- 9. Indonesia APAC Aviation Fuel Industry Analysis, Insights and Forecast, 2019-2031
- 9.1. Market Analysis, Insights and Forecast - by Fuel Type
- 9.1.1. Air Turbine Fuel (ATF)
- 9.1.2. Aviation Biofuel
- 9.1.3. Others
- 9.2. Market Analysis, Insights and Forecast - by Application
- 9.2.1. Commercial Aircraft
- 9.2.2. Military Aircraft
- 9.2.3. General Aviation
- 9.3. Market Analysis, Insights and Forecast - by Geography
- 9.3.1. China
- 9.3.2. Japan
- 9.3.3. India
- 9.3.4. Indonesia
- 9.3.5. Australia
- 9.3.6. Rest of Asia-Pacific
- 9.1. Market Analysis, Insights and Forecast - by Fuel Type
- 10. Australia APAC Aviation Fuel Industry Analysis, Insights and Forecast, 2019-2031
- 10.1. Market Analysis, Insights and Forecast - by Fuel Type
- 10.1.1. Air Turbine Fuel (ATF)
- 10.1.2. Aviation Biofuel
- 10.1.3. Others
- 10.2. Market Analysis, Insights and Forecast - by Application
- 10.2.1. Commercial Aircraft
- 10.2.2. Military Aircraft
- 10.2.3. General Aviation
- 10.3. Market Analysis, Insights and Forecast - by Geography
- 10.3.1. China
- 10.3.2. Japan
- 10.3.3. India
- 10.3.4. Indonesia
- 10.3.5. Australia
- 10.3.6. Rest of Asia-Pacific
- 10.1. Market Analysis, Insights and Forecast - by Fuel Type
- 11. Rest of Asia Pacific APAC Aviation Fuel Industry Analysis, Insights and Forecast, 2019-2031
- 11.1. Market Analysis, Insights and Forecast - by Fuel Type
- 11.1.1. Air Turbine Fuel (ATF)
- 11.1.2. Aviation Biofuel
- 11.1.3. Others
- 11.2. Market Analysis, Insights and Forecast - by Application
- 11.2.1. Commercial Aircraft
- 11.2.2. Military Aircraft
- 11.2.3. General Aviation
- 11.3. Market Analysis, Insights and Forecast - by Geography
- 11.3.1. China
- 11.3.2. Japan
- 11.3.3. India
- 11.3.4. Indonesia
- 11.3.5. Australia
- 11.3.6. Rest of Asia-Pacific
- 11.1. Market Analysis, Insights and Forecast - by Fuel Type
- 12. North America APAC Aviation Fuel Industry Analysis, Insights and Forecast, 2019-2031
- 12.1. Market Analysis, Insights and Forecast - By Country/Sub-region
- 12.1.1 United States
- 12.1.2 Canada
- 12.1.3 Mexico
- 13. Europe APAC Aviation Fuel Industry Analysis, Insights and Forecast, 2019-2031
- 13.1. Market Analysis, Insights and Forecast - By Country/Sub-region
- 13.1.1 Germany
- 13.1.2 United Kingdom
- 13.1.3 France
- 13.1.4 Spain
- 13.1.5 Italy
- 13.1.6 Spain
- 13.1.7 Belgium
- 13.1.8 Netherland
- 13.1.9 Nordics
- 13.1.10 Rest of Europe
- 14. Asia Pacific APAC Aviation Fuel Industry Analysis, Insights and Forecast, 2019-2031
- 14.1. Market Analysis, Insights and Forecast - By Country/Sub-region
- 14.1.1 China
- 14.1.2 Japan
- 14.1.3 India
- 14.1.4 South Korea
- 14.1.5 Southeast Asia
- 14.1.6 Australia
- 14.1.7 Indonesia
- 14.1.8 Phillipes
- 14.1.9 Singapore
- 14.1.10 Thailandc
- 14.1.11 Rest of Asia Pacific
- 15. South America APAC Aviation Fuel Industry Analysis, Insights and Forecast, 2019-2031
- 15.1. Market Analysis, Insights and Forecast - By Country/Sub-region
- 15.1.1 Brazil
- 15.1.2 Argentina
- 15.1.3 Peru
- 15.1.4 Chile
- 15.1.5 Colombia
- 15.1.6 Ecuador
- 15.1.7 Venezuela
- 15.1.8 Rest of South America
- 16. North America APAC Aviation Fuel Industry Analysis, Insights and Forecast, 2019-2031
- 16.1. Market Analysis, Insights and Forecast - By Country/Sub-region
- 16.1.1 United States
- 16.1.2 Canada
- 16.1.3 Mexico
- 17. MEA APAC Aviation Fuel Industry Analysis, Insights and Forecast, 2019-2031
- 17.1. Market Analysis, Insights and Forecast - By Country/Sub-region
- 17.1.1 United Arab Emirates
- 17.1.2 Saudi Arabia
- 17.1.3 South Africa
- 17.1.4 Rest of Middle East and Africa
- 18. Competitive Analysis
- 18.1. Global Market Share Analysis 2024
- 18.2. Company Profiles
- 18.2.1 BP plc
- 18.2.1.1. Overview
- 18.2.1.2. Products
- 18.2.1.3. SWOT Analysis
- 18.2.1.4. Recent Developments
- 18.2.1.5. Financials (Based on Availability)
- 18.2.2 Bharat Petroleum Corp Ltd
- 18.2.2.1. Overview
- 18.2.2.2. Products
- 18.2.2.3. SWOT Analysis
- 18.2.2.4. Recent Developments
- 18.2.2.5. Financials (Based on Availability)
- 18.2.3 Exxon Mobil Corporation*List Not Exhaustive
- 18.2.3.1. Overview
- 18.2.3.2. Products
- 18.2.3.3. SWOT Analysis
- 18.2.3.4. Recent Developments
- 18.2.3.5. Financials (Based on Availability)
- 18.2.4 Royal Dutch Shell Plc
- 18.2.4.1. Overview
- 18.2.4.2. Products
- 18.2.4.3. SWOT Analysis
- 18.2.4.4. Recent Developments
- 18.2.4.5. Financials (Based on Availability)
- 18.2.5 Pertamina Persero PT
- 18.2.5.1. Overview
- 18.2.5.2. Products
- 18.2.5.3. SWOT Analysis
- 18.2.5.4. Recent Developments
- 18.2.5.5. Financials (Based on Availability)
- 18.2.6 Chevron Corporation
- 18.2.6.1. Overview
- 18.2.6.2. Products
- 18.2.6.3. SWOT Analysis
- 18.2.6.4. Recent Developments
- 18.2.6.5. Financials (Based on Availability)
- 18.2.7 World Fuel Services Corp
- 18.2.7.1. Overview
- 18.2.7.2. Products
- 18.2.7.3. SWOT Analysis
- 18.2.7.4. Recent Developments
- 18.2.7.5. Financials (Based on Availability)
- 18.2.8 Petronas Aviation Sdn Bhd
- 18.2.8.1. Overview
- 18.2.8.2. Products
- 18.2.8.3. SWOT Analysis
- 18.2.8.4. Recent Developments
- 18.2.8.5. Financials (Based on Availability)
- 18.2.9 China Aviation Oil Corporation Ltd
- 18.2.9.1. Overview
- 18.2.9.2. Products
- 18.2.9.3. SWOT Analysis
- 18.2.9.4. Recent Developments
- 18.2.9.5. Financials (Based on Availability)
- 18.2.10 Vitol Holding BV
- 18.2.10.1. Overview
- 18.2.10.2. Products
- 18.2.10.3. SWOT Analysis
- 18.2.10.4. Recent Developments
- 18.2.10.5. Financials (Based on Availability)
- 18.2.1 BP plc
List of Figures
- Figure 1: Global APAC Aviation Fuel Industry Revenue Breakdown (Million, %) by Region 2024 & 2032
- Figure 2: Global APAC Aviation Fuel Industry Volume Breakdown (Litre, %) by Region 2024 & 2032
- Figure 3: North America APAC Aviation Fuel Industry Revenue (Million), by Country 2024 & 2032
- Figure 4: North America APAC Aviation Fuel Industry Volume (Litre), by Country 2024 & 2032
- Figure 5: North America APAC Aviation Fuel Industry Revenue Share (%), by Country 2024 & 2032
- Figure 6: North America APAC Aviation Fuel Industry Volume Share (%), by Country 2024 & 2032
- Figure 7: Europe APAC Aviation Fuel Industry Revenue (Million), by Country 2024 & 2032
- Figure 8: Europe APAC Aviation Fuel Industry Volume (Litre), by Country 2024 & 2032
- Figure 9: Europe APAC Aviation Fuel Industry Revenue Share (%), by Country 2024 & 2032
- Figure 10: Europe APAC Aviation Fuel Industry Volume Share (%), by Country 2024 & 2032
- Figure 11: Asia Pacific APAC Aviation Fuel Industry Revenue (Million), by Country 2024 & 2032
- Figure 12: Asia Pacific APAC Aviation Fuel Industry Volume (Litre), by Country 2024 & 2032
- Figure 13: Asia Pacific APAC Aviation Fuel Industry Revenue Share (%), by Country 2024 & 2032
- Figure 14: Asia Pacific APAC Aviation Fuel Industry Volume Share (%), by Country 2024 & 2032
- Figure 15: South America APAC Aviation Fuel Industry Revenue (Million), by Country 2024 & 2032
- Figure 16: South America APAC Aviation Fuel Industry Volume (Litre), by Country 2024 & 2032
- Figure 17: South America APAC Aviation Fuel Industry Revenue Share (%), by Country 2024 & 2032
- Figure 18: South America APAC Aviation Fuel Industry Volume Share (%), by Country 2024 & 2032
- Figure 19: North America APAC Aviation Fuel Industry Revenue (Million), by Country 2024 & 2032
- Figure 20: North America APAC Aviation Fuel Industry Volume (Litre), by Country 2024 & 2032
- Figure 21: North America APAC Aviation Fuel Industry Revenue Share (%), by Country 2024 & 2032
- Figure 22: North America APAC Aviation Fuel Industry Volume Share (%), by Country 2024 & 2032
- Figure 23: MEA APAC Aviation Fuel Industry Revenue (Million), by Country 2024 & 2032
- Figure 24: MEA APAC Aviation Fuel Industry Volume (Litre), by Country 2024 & 2032
- Figure 25: MEA APAC Aviation Fuel Industry Revenue Share (%), by Country 2024 & 2032
- Figure 26: MEA APAC Aviation Fuel Industry Volume Share (%), by Country 2024 & 2032
- Figure 27: China APAC Aviation Fuel Industry Revenue (Million), by Fuel Type 2024 & 2032
- Figure 28: China APAC Aviation Fuel Industry Volume (Litre), by Fuel Type 2024 & 2032
- Figure 29: China APAC Aviation Fuel Industry Revenue Share (%), by Fuel Type 2024 & 2032
- Figure 30: China APAC Aviation Fuel Industry Volume Share (%), by Fuel Type 2024 & 2032
- Figure 31: China APAC Aviation Fuel Industry Revenue (Million), by Application 2024 & 2032
- Figure 32: China APAC Aviation Fuel Industry Volume (Litre), by Application 2024 & 2032
- Figure 33: China APAC Aviation Fuel Industry Revenue Share (%), by Application 2024 & 2032
- Figure 34: China APAC Aviation Fuel Industry Volume Share (%), by Application 2024 & 2032
- Figure 35: China APAC Aviation Fuel Industry Revenue (Million), by Geography 2024 & 2032
- Figure 36: China APAC Aviation Fuel Industry Volume (Litre), by Geography 2024 & 2032
- Figure 37: China APAC Aviation Fuel Industry Revenue Share (%), by Geography 2024 & 2032
- Figure 38: China APAC Aviation Fuel Industry Volume Share (%), by Geography 2024 & 2032
- Figure 39: China APAC Aviation Fuel Industry Revenue (Million), by Country 2024 & 2032
- Figure 40: China APAC Aviation Fuel Industry Volume (Litre), by Country 2024 & 2032
- Figure 41: China APAC Aviation Fuel Industry Revenue Share (%), by Country 2024 & 2032
- Figure 42: China APAC Aviation Fuel Industry Volume Share (%), by Country 2024 & 2032
- Figure 43: Japan APAC Aviation Fuel Industry Revenue (Million), by Fuel Type 2024 & 2032
- Figure 44: Japan APAC Aviation Fuel Industry Volume (Litre), by Fuel Type 2024 & 2032
- Figure 45: Japan APAC Aviation Fuel Industry Revenue Share (%), by Fuel Type 2024 & 2032
- Figure 46: Japan APAC Aviation Fuel Industry Volume Share (%), by Fuel Type 2024 & 2032
- Figure 47: Japan APAC Aviation Fuel Industry Revenue (Million), by Application 2024 & 2032
- Figure 48: Japan APAC Aviation Fuel Industry Volume (Litre), by Application 2024 & 2032
- Figure 49: Japan APAC Aviation Fuel Industry Revenue Share (%), by Application 2024 & 2032
- Figure 50: Japan APAC Aviation Fuel Industry Volume Share (%), by Application 2024 & 2032
- Figure 51: Japan APAC Aviation Fuel Industry Revenue (Million), by Geography 2024 & 2032
- Figure 52: Japan APAC Aviation Fuel Industry Volume (Litre), by Geography 2024 & 2032
- Figure 53: Japan APAC Aviation Fuel Industry Revenue Share (%), by Geography 2024 & 2032
- Figure 54: Japan APAC Aviation Fuel Industry Volume Share (%), by Geography 2024 & 2032
- Figure 55: Japan APAC Aviation Fuel Industry Revenue (Million), by Country 2024 & 2032
- Figure 56: Japan APAC Aviation Fuel Industry Volume (Litre), by Country 2024 & 2032
- Figure 57: Japan APAC Aviation Fuel Industry Revenue Share (%), by Country 2024 & 2032
- Figure 58: Japan APAC Aviation Fuel Industry Volume Share (%), by Country 2024 & 2032
- Figure 59: India APAC Aviation Fuel Industry Revenue (Million), by Fuel Type 2024 & 2032
- Figure 60: India APAC Aviation Fuel Industry Volume (Litre), by Fuel Type 2024 & 2032
- Figure 61: India APAC Aviation Fuel Industry Revenue Share (%), by Fuel Type 2024 & 2032
- Figure 62: India APAC Aviation Fuel Industry Volume Share (%), by Fuel Type 2024 & 2032
- Figure 63: India APAC Aviation Fuel Industry Revenue (Million), by Application 2024 & 2032
- Figure 64: India APAC Aviation Fuel Industry Volume (Litre), by Application 2024 & 2032
- Figure 65: India APAC Aviation Fuel Industry Revenue Share (%), by Application 2024 & 2032
- Figure 66: India APAC Aviation Fuel Industry Volume Share (%), by Application 2024 & 2032
- Figure 67: India APAC Aviation Fuel Industry Revenue (Million), by Geography 2024 & 2032
- Figure 68: India APAC Aviation Fuel Industry Volume (Litre), by Geography 2024 & 2032
- Figure 69: India APAC Aviation Fuel Industry Revenue Share (%), by Geography 2024 & 2032
- Figure 70: India APAC Aviation Fuel Industry Volume Share (%), by Geography 2024 & 2032
- Figure 71: India APAC Aviation Fuel Industry Revenue (Million), by Country 2024 & 2032
- Figure 72: India APAC Aviation Fuel Industry Volume (Litre), by Country 2024 & 2032
- Figure 73: India APAC Aviation Fuel Industry Revenue Share (%), by Country 2024 & 2032
- Figure 74: India APAC Aviation Fuel Industry Volume Share (%), by Country 2024 & 2032
- Figure 75: Indonesia APAC Aviation Fuel Industry Revenue (Million), by Fuel Type 2024 & 2032
- Figure 76: Indonesia APAC Aviation Fuel Industry Volume (Litre), by Fuel Type 2024 & 2032
- Figure 77: Indonesia APAC Aviation Fuel Industry Revenue Share (%), by Fuel Type 2024 & 2032
- Figure 78: Indonesia APAC Aviation Fuel Industry Volume Share (%), by Fuel Type 2024 & 2032
- Figure 79: Indonesia APAC Aviation Fuel Industry Revenue (Million), by Application 2024 & 2032
- Figure 80: Indonesia APAC Aviation Fuel Industry Volume (Litre), by Application 2024 & 2032
- Figure 81: Indonesia APAC Aviation Fuel Industry Revenue Share (%), by Application 2024 & 2032
- Figure 82: Indonesia APAC Aviation Fuel Industry Volume Share (%), by Application 2024 & 2032
- Figure 83: Indonesia APAC Aviation Fuel Industry Revenue (Million), by Geography 2024 & 2032
- Figure 84: Indonesia APAC Aviation Fuel Industry Volume (Litre), by Geography 2024 & 2032
- Figure 85: Indonesia APAC Aviation Fuel Industry Revenue Share (%), by Geography 2024 & 2032
- Figure 86: Indonesia APAC Aviation Fuel Industry Volume Share (%), by Geography 2024 & 2032
- Figure 87: Indonesia APAC Aviation Fuel Industry Revenue (Million), by Country 2024 & 2032
- Figure 88: Indonesia APAC Aviation Fuel Industry Volume (Litre), by Country 2024 & 2032
- Figure 89: Indonesia APAC Aviation Fuel Industry Revenue Share (%), by Country 2024 & 2032
- Figure 90: Indonesia APAC Aviation Fuel Industry Volume Share (%), by Country 2024 & 2032
- Figure 91: Australia APAC Aviation Fuel Industry Revenue (Million), by Fuel Type 2024 & 2032
- Figure 92: Australia APAC Aviation Fuel Industry Volume (Litre), by Fuel Type 2024 & 2032
- Figure 93: Australia APAC Aviation Fuel Industry Revenue Share (%), by Fuel Type 2024 & 2032
- Figure 94: Australia APAC Aviation Fuel Industry Volume Share (%), by Fuel Type 2024 & 2032
- Figure 95: Australia APAC Aviation Fuel Industry Revenue (Million), by Application 2024 & 2032
- Figure 96: Australia APAC Aviation Fuel Industry Volume (Litre), by Application 2024 & 2032
- Figure 97: Australia APAC Aviation Fuel Industry Revenue Share (%), by Application 2024 & 2032
- Figure 98: Australia APAC Aviation Fuel Industry Volume Share (%), by Application 2024 & 2032
- Figure 99: Australia APAC Aviation Fuel Industry Revenue (Million), by Geography 2024 & 2032
- Figure 100: Australia APAC Aviation Fuel Industry Volume (Litre), by Geography 2024 & 2032
- Figure 101: Australia APAC Aviation Fuel Industry Revenue Share (%), by Geography 2024 & 2032
- Figure 102: Australia APAC Aviation Fuel Industry Volume Share (%), by Geography 2024 & 2032
- Figure 103: Australia APAC Aviation Fuel Industry Revenue (Million), by Country 2024 & 2032
- Figure 104: Australia APAC Aviation Fuel Industry Volume (Litre), by Country 2024 & 2032
- Figure 105: Australia APAC Aviation Fuel Industry Revenue Share (%), by Country 2024 & 2032
- Figure 106: Australia APAC Aviation Fuel Industry Volume Share (%), by Country 2024 & 2032
- Figure 107: Rest of Asia Pacific APAC Aviation Fuel Industry Revenue (Million), by Fuel Type 2024 & 2032
- Figure 108: Rest of Asia Pacific APAC Aviation Fuel Industry Volume (Litre), by Fuel Type 2024 & 2032
- Figure 109: Rest of Asia Pacific APAC Aviation Fuel Industry Revenue Share (%), by Fuel Type 2024 & 2032
- Figure 110: Rest of Asia Pacific APAC Aviation Fuel Industry Volume Share (%), by Fuel Type 2024 & 2032
- Figure 111: Rest of Asia Pacific APAC Aviation Fuel Industry Revenue (Million), by Application 2024 & 2032
- Figure 112: Rest of Asia Pacific APAC Aviation Fuel Industry Volume (Litre), by Application 2024 & 2032
- Figure 113: Rest of Asia Pacific APAC Aviation Fuel Industry Revenue Share (%), by Application 2024 & 2032
- Figure 114: Rest of Asia Pacific APAC Aviation Fuel Industry Volume Share (%), by Application 2024 & 2032
- Figure 115: Rest of Asia Pacific APAC Aviation Fuel Industry Revenue (Million), by Geography 2024 & 2032
- Figure 116: Rest of Asia Pacific APAC Aviation Fuel Industry Volume (Litre), by Geography 2024 & 2032
- Figure 117: Rest of Asia Pacific APAC Aviation Fuel Industry Revenue Share (%), by Geography 2024 & 2032
- Figure 118: Rest of Asia Pacific APAC Aviation Fuel Industry Volume Share (%), by Geography 2024 & 2032
- Figure 119: Rest of Asia Pacific APAC Aviation Fuel Industry Revenue (Million), by Country 2024 & 2032
- Figure 120: Rest of Asia Pacific APAC Aviation Fuel Industry Volume (Litre), by Country 2024 & 2032
- Figure 121: Rest of Asia Pacific APAC Aviation Fuel Industry Revenue Share (%), by Country 2024 & 2032
- Figure 122: Rest of Asia Pacific APAC Aviation Fuel Industry Volume Share (%), by Country 2024 & 2032
List of Tables
- Table 1: Global APAC Aviation Fuel Industry Revenue Million Forecast, by Region 2019 & 2032
- Table 2: Global APAC Aviation Fuel Industry Volume Litre Forecast, by Region 2019 & 2032
- Table 3: Global APAC Aviation Fuel Industry Revenue Million Forecast, by Fuel Type 2019 & 2032
- Table 4: Global APAC Aviation Fuel Industry Volume Litre Forecast, by Fuel Type 2019 & 2032
- Table 5: Global APAC Aviation Fuel Industry Revenue Million Forecast, by Application 2019 & 2032
- Table 6: Global APAC Aviation Fuel Industry Volume Litre Forecast, by Application 2019 & 2032
- Table 7: Global APAC Aviation Fuel Industry Revenue Million Forecast, by Geography 2019 & 2032
- Table 8: Global APAC Aviation Fuel Industry Volume Litre Forecast, by Geography 2019 & 2032
- Table 9: Global APAC Aviation Fuel Industry Revenue Million Forecast, by Region 2019 & 2032
- Table 10: Global APAC Aviation Fuel Industry Volume Litre Forecast, by Region 2019 & 2032
- Table 11: Global APAC Aviation Fuel Industry Revenue Million Forecast, by Country 2019 & 2032
- Table 12: Global APAC Aviation Fuel Industry Volume Litre Forecast, by Country 2019 & 2032
- Table 13: United States APAC Aviation Fuel Industry Revenue (Million) Forecast, by Application 2019 & 2032
- Table 14: United States APAC Aviation Fuel Industry Volume (Litre) Forecast, by Application 2019 & 2032
- Table 15: Canada APAC Aviation Fuel Industry Revenue (Million) Forecast, by Application 2019 & 2032
- Table 16: Canada APAC Aviation Fuel Industry Volume (Litre) Forecast, by Application 2019 & 2032
- Table 17: Mexico APAC Aviation Fuel Industry Revenue (Million) Forecast, by Application 2019 & 2032
- Table 18: Mexico APAC Aviation Fuel Industry Volume (Litre) Forecast, by Application 2019 & 2032
- Table 19: Global APAC Aviation Fuel Industry Revenue Million Forecast, by Country 2019 & 2032
- Table 20: Global APAC Aviation Fuel Industry Volume Litre Forecast, by Country 2019 & 2032
- Table 21: Germany APAC Aviation Fuel Industry Revenue (Million) Forecast, by Application 2019 & 2032
- Table 22: Germany APAC Aviation Fuel Industry Volume (Litre) Forecast, by Application 2019 & 2032
- Table 23: United Kingdom APAC Aviation Fuel Industry Revenue (Million) Forecast, by Application 2019 & 2032
- Table 24: United Kingdom APAC Aviation Fuel Industry Volume (Litre) Forecast, by Application 2019 & 2032
- Table 25: France APAC Aviation Fuel Industry Revenue (Million) Forecast, by Application 2019 & 2032
- Table 26: France APAC Aviation Fuel Industry Volume (Litre) Forecast, by Application 2019 & 2032
- Table 27: Spain APAC Aviation Fuel Industry Revenue (Million) Forecast, by Application 2019 & 2032
- Table 28: Spain APAC Aviation Fuel Industry Volume (Litre) Forecast, by Application 2019 & 2032
- Table 29: Italy APAC Aviation Fuel Industry Revenue (Million) Forecast, by Application 2019 & 2032
- Table 30: Italy APAC Aviation Fuel Industry Volume (Litre) Forecast, by Application 2019 & 2032
- Table 31: Spain APAC Aviation Fuel Industry Revenue (Million) Forecast, by Application 2019 & 2032
- Table 32: Spain APAC Aviation Fuel Industry Volume (Litre) Forecast, by Application 2019 & 2032
- Table 33: Belgium APAC Aviation Fuel Industry Revenue (Million) Forecast, by Application 2019 & 2032
- Table 34: Belgium APAC Aviation Fuel Industry Volume (Litre) Forecast, by Application 2019 & 2032
- Table 35: Netherland APAC Aviation Fuel Industry Revenue (Million) Forecast, by Application 2019 & 2032
- Table 36: Netherland APAC Aviation Fuel Industry Volume (Litre) Forecast, by Application 2019 & 2032
- Table 37: Nordics APAC Aviation Fuel Industry Revenue (Million) Forecast, by Application 2019 & 2032
- Table 38: Nordics APAC Aviation Fuel Industry Volume (Litre) Forecast, by Application 2019 & 2032
- Table 39: Rest of Europe APAC Aviation Fuel Industry Revenue (Million) Forecast, by Application 2019 & 2032
- Table 40: Rest of Europe APAC Aviation Fuel Industry Volume (Litre) Forecast, by Application 2019 & 2032
- Table 41: Global APAC Aviation Fuel Industry Revenue Million Forecast, by Country 2019 & 2032
- Table 42: Global APAC Aviation Fuel Industry Volume Litre Forecast, by Country 2019 & 2032
- Table 43: China APAC Aviation Fuel Industry Revenue (Million) Forecast, by Application 2019 & 2032
- Table 44: China APAC Aviation Fuel Industry Volume (Litre) Forecast, by Application 2019 & 2032
- Table 45: Japan APAC Aviation Fuel Industry Revenue (Million) Forecast, by Application 2019 & 2032
- Table 46: Japan APAC Aviation Fuel Industry Volume (Litre) Forecast, by Application 2019 & 2032
- Table 47: India APAC Aviation Fuel Industry Revenue (Million) Forecast, by Application 2019 & 2032
- Table 48: India APAC Aviation Fuel Industry Volume (Litre) Forecast, by Application 2019 & 2032
- Table 49: South Korea APAC Aviation Fuel Industry Revenue (Million) Forecast, by Application 2019 & 2032
- Table 50: South Korea APAC Aviation Fuel Industry Volume (Litre) Forecast, by Application 2019 & 2032
- Table 51: Southeast Asia APAC Aviation Fuel Industry Revenue (Million) Forecast, by Application 2019 & 2032
- Table 52: Southeast Asia APAC Aviation Fuel Industry Volume (Litre) Forecast, by Application 2019 & 2032
- Table 53: Australia APAC Aviation Fuel Industry Revenue (Million) Forecast, by Application 2019 & 2032
- Table 54: Australia APAC Aviation Fuel Industry Volume (Litre) Forecast, by Application 2019 & 2032
- Table 55: Indonesia APAC Aviation Fuel Industry Revenue (Million) Forecast, by Application 2019 & 2032
- Table 56: Indonesia APAC Aviation Fuel Industry Volume (Litre) Forecast, by Application 2019 & 2032
- Table 57: Phillipes APAC Aviation Fuel Industry Revenue (Million) Forecast, by Application 2019 & 2032
- Table 58: Phillipes APAC Aviation Fuel Industry Volume (Litre) Forecast, by Application 2019 & 2032
- Table 59: Singapore APAC Aviation Fuel Industry Revenue (Million) Forecast, by Application 2019 & 2032
- Table 60: Singapore APAC Aviation Fuel Industry Volume (Litre) Forecast, by Application 2019 & 2032
- Table 61: Thailandc APAC Aviation Fuel Industry Revenue (Million) Forecast, by Application 2019 & 2032
- Table 62: Thailandc APAC Aviation Fuel Industry Volume (Litre) Forecast, by Application 2019 & 2032
- Table 63: Rest of Asia Pacific APAC Aviation Fuel Industry Revenue (Million) Forecast, by Application 2019 & 2032
- Table 64: Rest of Asia Pacific APAC Aviation Fuel Industry Volume (Litre) Forecast, by Application 2019 & 2032
- Table 65: Global APAC Aviation Fuel Industry Revenue Million Forecast, by Country 2019 & 2032
- Table 66: Global APAC Aviation Fuel Industry Volume Litre Forecast, by Country 2019 & 2032
- Table 67: Brazil APAC Aviation Fuel Industry Revenue (Million) Forecast, by Application 2019 & 2032
- Table 68: Brazil APAC Aviation Fuel Industry Volume (Litre) Forecast, by Application 2019 & 2032
- Table 69: Argentina APAC Aviation Fuel Industry Revenue (Million) Forecast, by Application 2019 & 2032
- Table 70: Argentina APAC Aviation Fuel Industry Volume (Litre) Forecast, by Application 2019 & 2032
- Table 71: Peru APAC Aviation Fuel Industry Revenue (Million) Forecast, by Application 2019 & 2032
- Table 72: Peru APAC Aviation Fuel Industry Volume (Litre) Forecast, by Application 2019 & 2032
- Table 73: Chile APAC Aviation Fuel Industry Revenue (Million) Forecast, by Application 2019 & 2032
- Table 74: Chile APAC Aviation Fuel Industry Volume (Litre) Forecast, by Application 2019 & 2032
- Table 75: Colombia APAC Aviation Fuel Industry Revenue (Million) Forecast, by Application 2019 & 2032
- Table 76: Colombia APAC Aviation Fuel Industry Volume (Litre) Forecast, by Application 2019 & 2032
- Table 77: Ecuador APAC Aviation Fuel Industry Revenue (Million) Forecast, by Application 2019 & 2032
- Table 78: Ecuador APAC Aviation Fuel Industry Volume (Litre) Forecast, by Application 2019 & 2032
- Table 79: Venezuela APAC Aviation Fuel Industry Revenue (Million) Forecast, by Application 2019 & 2032
- Table 80: Venezuela APAC Aviation Fuel Industry Volume (Litre) Forecast, by Application 2019 & 2032
- Table 81: Rest of South America APAC Aviation Fuel Industry Revenue (Million) Forecast, by Application 2019 & 2032
- Table 82: Rest of South America APAC Aviation Fuel Industry Volume (Litre) Forecast, by Application 2019 & 2032
- Table 83: Global APAC Aviation Fuel Industry Revenue Million Forecast, by Country 2019 & 2032
- Table 84: Global APAC Aviation Fuel Industry Volume Litre Forecast, by Country 2019 & 2032
- Table 85: United States APAC Aviation Fuel Industry Revenue (Million) Forecast, by Application 2019 & 2032
- Table 86: United States APAC Aviation Fuel Industry Volume (Litre) Forecast, by Application 2019 & 2032
- Table 87: Canada APAC Aviation Fuel Industry Revenue (Million) Forecast, by Application 2019 & 2032
- Table 88: Canada APAC Aviation Fuel Industry Volume (Litre) Forecast, by Application 2019 & 2032
- Table 89: Mexico APAC Aviation Fuel Industry Revenue (Million) Forecast, by Application 2019 & 2032
- Table 90: Mexico APAC Aviation Fuel Industry Volume (Litre) Forecast, by Application 2019 & 2032
- Table 91: Global APAC Aviation Fuel Industry Revenue Million Forecast, by Country 2019 & 2032
- Table 92: Global APAC Aviation Fuel Industry Volume Litre Forecast, by Country 2019 & 2032
- Table 93: United Arab Emirates APAC Aviation Fuel Industry Revenue (Million) Forecast, by Application 2019 & 2032
- Table 94: United Arab Emirates APAC Aviation Fuel Industry Volume (Litre) Forecast, by Application 2019 & 2032
- Table 95: Saudi Arabia APAC Aviation Fuel Industry Revenue (Million) Forecast, by Application 2019 & 2032
- Table 96: Saudi Arabia APAC Aviation Fuel Industry Volume (Litre) Forecast, by Application 2019 & 2032
- Table 97: South Africa APAC Aviation Fuel Industry Revenue (Million) Forecast, by Application 2019 & 2032
- Table 98: South Africa APAC Aviation Fuel Industry Volume (Litre) Forecast, by Application 2019 & 2032
- Table 99: Rest of Middle East and Africa APAC Aviation Fuel Industry Revenue (Million) Forecast, by Application 2019 & 2032
- Table 100: Rest of Middle East and Africa APAC Aviation Fuel Industry Volume (Litre) Forecast, by Application 2019 & 2032
- Table 101: Global APAC Aviation Fuel Industry Revenue Million Forecast, by Fuel Type 2019 & 2032
- Table 102: Global APAC Aviation Fuel Industry Volume Litre Forecast, by Fuel Type 2019 & 2032
- Table 103: Global APAC Aviation Fuel Industry Revenue Million Forecast, by Application 2019 & 2032
- Table 104: Global APAC Aviation Fuel Industry Volume Litre Forecast, by Application 2019 & 2032
- Table 105: Global APAC Aviation Fuel Industry Revenue Million Forecast, by Geography 2019 & 2032
- Table 106: Global APAC Aviation Fuel Industry Volume Litre Forecast, by Geography 2019 & 2032
- Table 107: Global APAC Aviation Fuel Industry Revenue Million Forecast, by Country 2019 & 2032
- Table 108: Global APAC Aviation Fuel Industry Volume Litre Forecast, by Country 2019 & 2032
- Table 109: Global APAC Aviation Fuel Industry Revenue Million Forecast, by Fuel Type 2019 & 2032
- Table 110: Global APAC Aviation Fuel Industry Volume Litre Forecast, by Fuel Type 2019 & 2032
- Table 111: Global APAC Aviation Fuel Industry Revenue Million Forecast, by Application 2019 & 2032
- Table 112: Global APAC Aviation Fuel Industry Volume Litre Forecast, by Application 2019 & 2032
- Table 113: Global APAC Aviation Fuel Industry Revenue Million Forecast, by Geography 2019 & 2032
- Table 114: Global APAC Aviation Fuel Industry Volume Litre Forecast, by Geography 2019 & 2032
- Table 115: Global APAC Aviation Fuel Industry Revenue Million Forecast, by Country 2019 & 2032
- Table 116: Global APAC Aviation Fuel Industry Volume Litre Forecast, by Country 2019 & 2032
- Table 117: Global APAC Aviation Fuel Industry Revenue Million Forecast, by Fuel Type 2019 & 2032
- Table 118: Global APAC Aviation Fuel Industry Volume Litre Forecast, by Fuel Type 2019 & 2032
- Table 119: Global APAC Aviation Fuel Industry Revenue Million Forecast, by Application 2019 & 2032
- Table 120: Global APAC Aviation Fuel Industry Volume Litre Forecast, by Application 2019 & 2032
- Table 121: Global APAC Aviation Fuel Industry Revenue Million Forecast, by Geography 2019 & 2032
- Table 122: Global APAC Aviation Fuel Industry Volume Litre Forecast, by Geography 2019 & 2032
- Table 123: Global APAC Aviation Fuel Industry Revenue Million Forecast, by Country 2019 & 2032
- Table 124: Global APAC Aviation Fuel Industry Volume Litre Forecast, by Country 2019 & 2032
- Table 125: Global APAC Aviation Fuel Industry Revenue Million Forecast, by Fuel Type 2019 & 2032
- Table 126: Global APAC Aviation Fuel Industry Volume Litre Forecast, by Fuel Type 2019 & 2032
- Table 127: Global APAC Aviation Fuel Industry Revenue Million Forecast, by Application 2019 & 2032
- Table 128: Global APAC Aviation Fuel Industry Volume Litre Forecast, by Application 2019 & 2032
- Table 129: Global APAC Aviation Fuel Industry Revenue Million Forecast, by Geography 2019 & 2032
- Table 130: Global APAC Aviation Fuel Industry Volume Litre Forecast, by Geography 2019 & 2032
- Table 131: Global APAC Aviation Fuel Industry Revenue Million Forecast, by Country 2019 & 2032
- Table 132: Global APAC Aviation Fuel Industry Volume Litre Forecast, by Country 2019 & 2032
- Table 133: Global APAC Aviation Fuel Industry Revenue Million Forecast, by Fuel Type 2019 & 2032
- Table 134: Global APAC Aviation Fuel Industry Volume Litre Forecast, by Fuel Type 2019 & 2032
- Table 135: Global APAC Aviation Fuel Industry Revenue Million Forecast, by Application 2019 & 2032
- Table 136: Global APAC Aviation Fuel Industry Volume Litre Forecast, by Application 2019 & 2032
- Table 137: Global APAC Aviation Fuel Industry Revenue Million Forecast, by Geography 2019 & 2032
- Table 138: Global APAC Aviation Fuel Industry Volume Litre Forecast, by Geography 2019 & 2032
- Table 139: Global APAC Aviation Fuel Industry Revenue Million Forecast, by Country 2019 & 2032
- Table 140: Global APAC Aviation Fuel Industry Volume Litre Forecast, by Country 2019 & 2032
- Table 141: Global APAC Aviation Fuel Industry Revenue Million Forecast, by Fuel Type 2019 & 2032
- Table 142: Global APAC Aviation Fuel Industry Volume Litre Forecast, by Fuel Type 2019 & 2032
- Table 143: Global APAC Aviation Fuel Industry Revenue Million Forecast, by Application 2019 & 2032
- Table 144: Global APAC Aviation Fuel Industry Volume Litre Forecast, by Application 2019 & 2032
- Table 145: Global APAC Aviation Fuel Industry Revenue Million Forecast, by Geography 2019 & 2032
- Table 146: Global APAC Aviation Fuel Industry Volume Litre Forecast, by Geography 2019 & 2032
- Table 147: Global APAC Aviation Fuel Industry Revenue Million Forecast, by Country 2019 & 2032
- Table 148: Global APAC Aviation Fuel Industry Volume Litre Forecast, by Country 2019 & 2032
Frequently Asked Questions
1. What is the projected Compound Annual Growth Rate (CAGR) of the APAC Aviation Fuel Industry?
The projected CAGR is approximately > 10.00%.
2. Which companies are prominent players in the APAC Aviation Fuel Industry?
Key companies in the market include BP plc, Bharat Petroleum Corp Ltd, Exxon Mobil Corporation*List Not Exhaustive, Royal Dutch Shell Plc, Pertamina Persero PT, Chevron Corporation, World Fuel Services Corp, Petronas Aviation Sdn Bhd, China Aviation Oil Corporation Ltd, Vitol Holding BV.
3. What are the main segments of the APAC Aviation Fuel Industry?
The market segments include Fuel Type, Application, Geography.
4. Can you provide details about the market size?
The market size is estimated to be USD XX Million as of 2022.
5. What are some drivers contributing to market growth?
4.; Increase in Prices of Electricity Procured from Conventional Mechanisms 4.; Decline in Cost of Solar Energy Infrastructure.
6. What are the notable trends driving market growth?
Commercial Aircraft Segment to Dominate the Market.
7. Are there any restraints impacting market growth?
4.; Competition from Other Alternative Energy Sources.
8. Can you provide examples of recent developments in the market?
N/A
9. What pricing options are available for accessing the report?
Pricing options include single-user, multi-user, and enterprise licenses priced at USD 4750, USD 5250, and USD 8750 respectively.
10. Is the market size provided in terms of value or volume?
The market size is provided in terms of value, measured in Million and volume, measured in Litre.
11. Are there any specific market keywords associated with the report?
Yes, the market keyword associated with the report is "APAC Aviation Fuel Industry," which aids in identifying and referencing the specific market segment covered.
12. How do I determine which pricing option suits my needs best?
The pricing options vary based on user requirements and access needs. Individual users may opt for single-user licenses, while businesses requiring broader access may choose multi-user or enterprise licenses for cost-effective access to the report.
13. Are there any additional resources or data provided in the APAC Aviation Fuel Industry report?
While the report offers comprehensive insights, it's advisable to review the specific contents or supplementary materials provided to ascertain if additional resources or data are available.
14. How can I stay updated on further developments or reports in the APAC Aviation Fuel Industry?
To stay informed about further developments, trends, and reports in the APAC Aviation Fuel Industry, consider subscribing to industry newsletters, following relevant companies and organizations, or regularly checking reputable industry news sources and publications.
Methodology
Step 1 - Identification of Relevant Samples Size from Population Database


Step 2 - Approaches for Defining Global Market Size (Value, Volume* & Price*)

Note*: In applicable scenarios
Step 3 - Data Sources
Primary Research
- Web Analytics
- Survey Reports
- Research Institute
- Latest Research Reports
- Opinion Leaders
Secondary Research
- Annual Reports
- White Paper
- Latest Press Release
- Industry Association
- Paid Database
- Investor Presentations

Step 4 - Data Triangulation
Involves using different sources of information in order to increase the validity of a study
These sources are likely to be stakeholders in a program - participants, other researchers, program staff, other community members, and so on.
Then we put all data in single framework & apply various statistical tools to find out the dynamic on the market.
During the analysis stage, feedback from the stakeholder groups would be compared to determine areas of agreement as well as areas of divergence
