

Key Insights
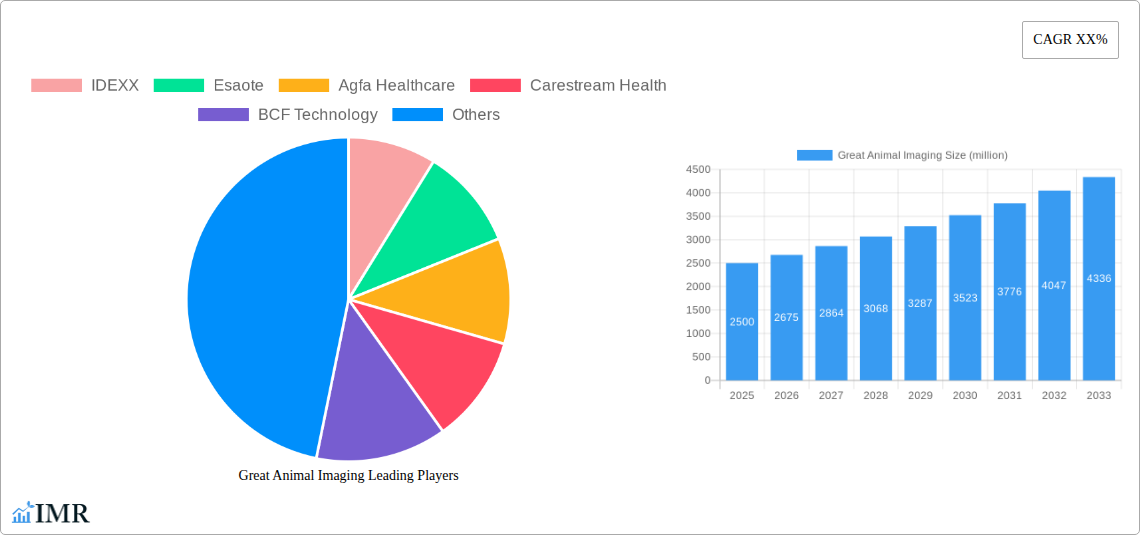
The global market for veterinary imaging is experiencing robust growth, driven by increasing pet ownership, rising pet healthcare expenditure, and advancements in imaging technologies. The market, estimated at $2.5 billion in 2025, is projected to exhibit a Compound Annual Growth Rate (CAGR) of 7% from 2025 to 2033, reaching approximately $4.2 billion by 2033. This growth is fueled by several factors including the rising prevalence of chronic diseases in animals necessitating advanced diagnostic tools, the increasing adoption of minimally invasive procedures requiring precise imaging guidance, and the expanding availability of portable and affordable imaging systems suitable for veterinary clinics of all sizes. Key technological advancements such as improved ultrasound systems with enhanced resolution, the wider application of digital X-ray systems offering faster processing and reduced radiation exposure, and the growing adoption of MRI and CT scanners in specialized veterinary hospitals are further propelling market expansion.
However, the market faces certain restraints. High initial investment costs associated with advanced imaging equipment can be a barrier to entry for smaller veterinary clinics, particularly in developing regions. Furthermore, the need for skilled technicians and radiologists to operate and interpret the imaging results creates a bottleneck in market penetration. Despite these challenges, the market's strong fundamentals, driven by the increasing human-animal bond and growing awareness of animal health, suggest a positive long-term outlook. The segmentation of the market includes various imaging modalities like ultrasound, X-ray, CT, MRI, and nuclear medicine, each experiencing unique growth trajectories depending on technological advancements and market adoption. Leading players like IDEXX, Esaote, and Agfa Healthcare are actively investing in research and development, product innovation, and strategic partnerships to maintain their market positions and capitalize on the burgeoning opportunities within the veterinary imaging sector.
Great Animal Imaging Market Report: 2019-2033
This comprehensive report provides an in-depth analysis of the Great Animal Imaging market, offering invaluable insights for industry professionals, investors, and stakeholders. Covering the period from 2019 to 2033, with a focus on 2025, this report meticulously examines market dynamics, growth trends, regional dominance, product innovation, and key players shaping this dynamic sector. The report segments the market by technology type (e.g., X-ray, Ultrasound, MRI, CT) and animal type (e.g., companion animals, livestock).
The parent market is the broader veterinary diagnostics market, valued at $xx billion in 2024, while the child market is animal imaging, predicted to reach $xx billion by 2033. This report leverages extensive primary and secondary research to deliver actionable intelligence, forecasting market growth and identifying lucrative opportunities.
Great Animal Imaging Market Dynamics & Structure
The Great Animal Imaging market is characterized by moderate concentration, with key players like IDEXX, Esaote, and Agfa Healthcare holding significant market share. Technological innovation, particularly in portable and digital imaging systems, is a primary growth driver. Regulatory frameworks, varying across regions, influence market access and adoption. Competitive product substitutes, such as traditional diagnostic methods, pose a challenge. The end-user demographic is expanding, driven by rising pet ownership and increasing veterinary care spending. M&A activity has been moderate, with approximately xx deals recorded between 2019 and 2024, primarily focused on expanding product portfolios and geographical reach.
- Market Concentration: IDEXX holds an estimated xx% market share in 2025, followed by Esaote with xx% and Agfa Healthcare with xx%.
- Technological Innovation: Advancements in AI-powered image analysis and portable ultrasound are key drivers.
- Regulatory Landscape: Variations in regulatory approvals across countries create market access complexities.
- Competitive Substitutes: Traditional diagnostic methods, though less efficient, remain prevalent in certain regions.
- End-User Demographics: Growing pet ownership and increased disposable incomes are boosting demand.
- M&A Activity: Approximately xx M&A deals occurred between 2019 and 2024, driving consolidation.
Great Animal Imaging Growth Trends & Insights
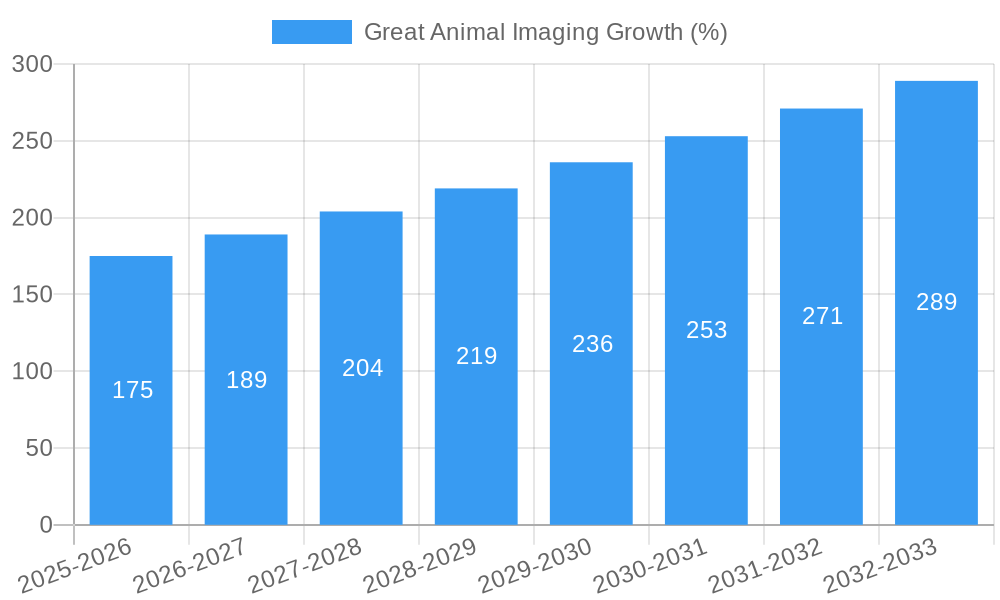
The Great Animal Imaging market exhibited a CAGR of xx% during the historical period (2019-2024) and is projected to grow at a CAGR of xx% during the forecast period (2025-2033). This growth is fueled by several factors, including increasing adoption of advanced imaging technologies in veterinary practices, rising pet ownership globally, and the growing demand for improved animal healthcare. Technological advancements, such as the development of portable and wireless imaging systems, are further enhancing market penetration. Shifts in consumer behavior, with pet owners increasingly seeking advanced diagnostic services, also contribute to growth. Market penetration is estimated at xx% in 2025, projected to reach xx% by 2033.
Dominant Regions, Countries, or Segments in Great Animal Imaging
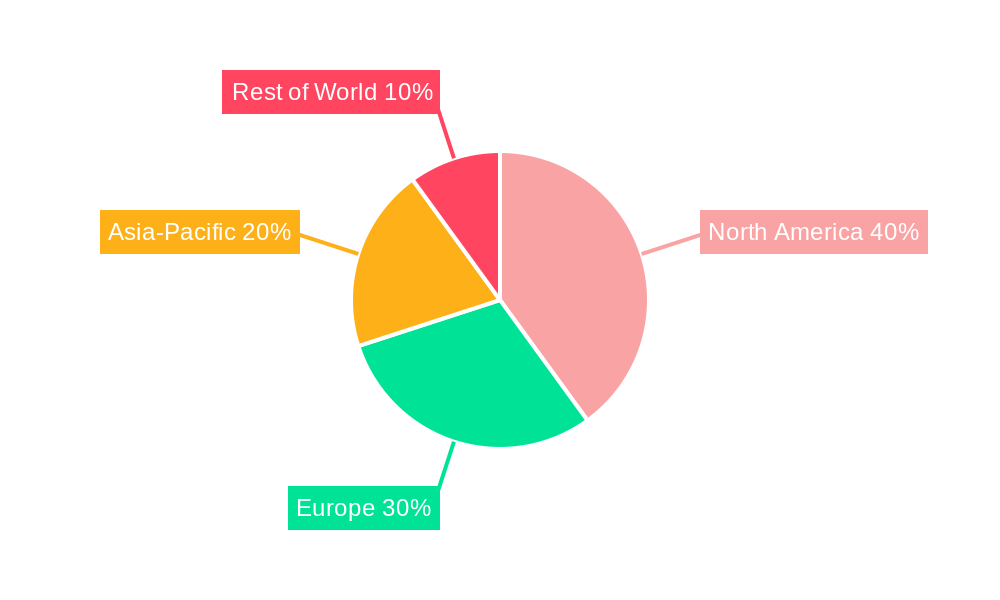
North America currently dominates the Great Animal Imaging market, driven by high pet ownership rates, advanced healthcare infrastructure, and strong regulatory support. Europe follows as a significant market, with growth propelled by increasing veterinary spending and technological adoption. The Asia-Pacific region is experiencing rapid growth, fueled by rising disposable incomes and increasing awareness of animal healthcare.
- North America: High pet ownership, advanced healthcare infrastructure, and strong regulatory support drive market leadership.
- Europe: Increasing veterinary spending and technological adoption contribute to significant market share.
- Asia-Pacific: Rapid growth is fueled by rising disposable incomes and increasing awareness of animal healthcare.
- Market Share: North America holds an estimated xx% market share in 2025, followed by Europe with xx% and Asia-Pacific with xx%.
Great Animal Imaging Product Landscape
The Great Animal Imaging market offers a diverse range of products, including digital X-ray systems, ultrasound machines, MRI systems, and CT scanners, each designed to meet specific diagnostic needs. Recent innovations focus on portability, improved image quality, and AI-powered image analysis for faster and more accurate diagnoses. Unique selling propositions include features like wireless connectivity, user-friendly interfaces, and advanced image processing capabilities. Technological advancements emphasize miniaturization, improved resolution, and the integration of advanced software.
Key Drivers, Barriers & Challenges in Great Animal Imaging
Key Drivers: Rising pet ownership, increasing veterinary care spending, technological advancements in imaging technology, and supportive government regulations are major growth drivers. The development of cost-effective and portable imaging systems is expanding access to care.
Key Challenges: High initial investment costs for advanced imaging systems can limit adoption in smaller veterinary clinics. Stringent regulatory requirements for medical device approvals can create market entry barriers. Intense competition among established players and the emergence of new entrants further complicates the market landscape. Supply chain disruptions can lead to delays and increased costs.
Emerging Opportunities in Great Animal Imaging
Untapped markets in developing economies present significant growth opportunities. Innovative applications, such as tele-veterinary services leveraging remote imaging analysis, are gaining traction. Evolving consumer preferences towards minimally invasive diagnostic procedures are driving demand for advanced, less-invasive imaging technologies.
Growth Accelerators in the Great Animal Imaging Industry
Technological breakthroughs, such as the development of AI-powered diagnostic tools and portable imaging devices, will significantly accelerate market growth. Strategic partnerships between imaging equipment manufacturers and veterinary clinics can improve market penetration. Expanding into emerging markets and focusing on specialized animal imaging segments (e.g., equine imaging) represent further growth avenues.
Key Players Shaping the Great Animal Imaging Market
- IDEXX
- Esaote
- Agfa Healthcare
- Carestream Health
- BCF Technology
- Mindray
- Hallmarq
- Heska
- Sedecal
- Kaixin Electric
- Chison
- MinXray
- Diagnostic Imaging Systems
- Bruker Corporation
Notable Milestones in Great Animal Imaging Sector
- 2020: IDEXX launched a new portable ultrasound system.
- 2021: Esaote acquired a smaller competitor specializing in veterinary imaging.
- 2022: Agfa Healthcare released new software for enhanced image analysis.
- 2023: FDA approval granted for a new AI-powered diagnostic tool for canine cancer detection.
- 2024: Significant investment in research and development across the sector for improving image quality and AI capabilities.
In-Depth Great Animal Imaging Market Outlook
The Great Animal Imaging market is poised for significant growth in the coming years, driven by continued technological advancements, expanding pet ownership globally, and increased awareness of animal healthcare. Strategic opportunities exist in the development of cost-effective and accessible imaging solutions for underserved markets. Partnerships and collaborations between key players and veterinary institutions will play a crucial role in shaping the future of animal imaging.
Great Animal Imaging Segmentation
-
1. Application
- 1.1. Lion
- 1.2. Elephant
- 1.3. Others
-
2. Types
- 2.1. Optical Imaging
- 2.2. Radionuclide Imaging
- 2.3. MRI
- 2.4. Computed Tomography Imaging
- 2.5. Ultrasound Imaging
Great Animal Imaging Segmentation By Geography
-
1. North America
- 1.1. United States
- 1.2. Canada
- 1.3. Mexico
-
2. South America
- 2.1. Brazil
- 2.2. Argentina
- 2.3. Rest of South America
-
3. Europe
- 3.1. United Kingdom
- 3.2. Germany
- 3.3. France
- 3.4. Italy
- 3.5. Spain
- 3.6. Russia
- 3.7. Benelux
- 3.8. Nordics
- 3.9. Rest of Europe
-
4. Middle East & Africa
- 4.1. Turkey
- 4.2. Israel
- 4.3. GCC
- 4.4. North Africa
- 4.5. South Africa
- 4.6. Rest of Middle East & Africa
-
5. Asia Pacific
- 5.1. China
- 5.2. India
- 5.3. Japan
- 5.4. South Korea
- 5.5. ASEAN
- 5.6. Oceania
- 5.7. Rest of Asia Pacific
Great Animal Imaging REPORT HIGHLIGHTS
| Aspects | Details |
|---|---|
| Study Period | 2019-2033 |
| Base Year | 2024 |
| Estimated Year | 2025 |
| Forecast Period | 2025-2033 |
| Historical Period | 2019-2024 |
| Growth Rate | CAGR of XX% from 2019-2033 |
| Segmentation |
|
Table of Contents
- 1. Introduction
- 1.1. Research Scope
- 1.2. Market Segmentation
- 1.3. Research Methodology
- 1.4. Definitions and Assumptions
- 2. Executive Summary
- 2.1. Introduction
- 3. Market Dynamics
- 3.1. Introduction
- 3.2. Market Drivers
- 3.3. Market Restrains
- 3.4. Market Trends
- 4. Market Factor Analysis
- 4.1. Porters Five Forces
- 4.2. Supply/Value Chain
- 4.3. PESTEL analysis
- 4.4. Market Entropy
- 4.5. Patent/Trademark Analysis
- 5. Global Great Animal Imaging Analysis, Insights and Forecast, 2019-2031
- 5.1. Market Analysis, Insights and Forecast - by Application
- 5.1.1. Lion
- 5.1.2. Elephant
- 5.1.3. Others
- 5.2. Market Analysis, Insights and Forecast - by Types
- 5.2.1. Optical Imaging
- 5.2.2. Radionuclide Imaging
- 5.2.3. MRI
- 5.2.4. Computed Tomography Imaging
- 5.2.5. Ultrasound Imaging
- 5.3. Market Analysis, Insights and Forecast - by Region
- 5.3.1. North America
- 5.3.2. South America
- 5.3.3. Europe
- 5.3.4. Middle East & Africa
- 5.3.5. Asia Pacific
- 5.1. Market Analysis, Insights and Forecast - by Application
- 6. North America Great Animal Imaging Analysis, Insights and Forecast, 2019-2031
- 6.1. Market Analysis, Insights and Forecast - by Application
- 6.1.1. Lion
- 6.1.2. Elephant
- 6.1.3. Others
- 6.2. Market Analysis, Insights and Forecast - by Types
- 6.2.1. Optical Imaging
- 6.2.2. Radionuclide Imaging
- 6.2.3. MRI
- 6.2.4. Computed Tomography Imaging
- 6.2.5. Ultrasound Imaging
- 6.1. Market Analysis, Insights and Forecast - by Application
- 7. South America Great Animal Imaging Analysis, Insights and Forecast, 2019-2031
- 7.1. Market Analysis, Insights and Forecast - by Application
- 7.1.1. Lion
- 7.1.2. Elephant
- 7.1.3. Others
- 7.2. Market Analysis, Insights and Forecast - by Types
- 7.2.1. Optical Imaging
- 7.2.2. Radionuclide Imaging
- 7.2.3. MRI
- 7.2.4. Computed Tomography Imaging
- 7.2.5. Ultrasound Imaging
- 7.1. Market Analysis, Insights and Forecast - by Application
- 8. Europe Great Animal Imaging Analysis, Insights and Forecast, 2019-2031
- 8.1. Market Analysis, Insights and Forecast - by Application
- 8.1.1. Lion
- 8.1.2. Elephant
- 8.1.3. Others
- 8.2. Market Analysis, Insights and Forecast - by Types
- 8.2.1. Optical Imaging
- 8.2.2. Radionuclide Imaging
- 8.2.3. MRI
- 8.2.4. Computed Tomography Imaging
- 8.2.5. Ultrasound Imaging
- 8.1. Market Analysis, Insights and Forecast - by Application
- 9. Middle East & Africa Great Animal Imaging Analysis, Insights and Forecast, 2019-2031
- 9.1. Market Analysis, Insights and Forecast - by Application
- 9.1.1. Lion
- 9.1.2. Elephant
- 9.1.3. Others
- 9.2. Market Analysis, Insights and Forecast - by Types
- 9.2.1. Optical Imaging
- 9.2.2. Radionuclide Imaging
- 9.2.3. MRI
- 9.2.4. Computed Tomography Imaging
- 9.2.5. Ultrasound Imaging
- 9.1. Market Analysis, Insights and Forecast - by Application
- 10. Asia Pacific Great Animal Imaging Analysis, Insights and Forecast, 2019-2031
- 10.1. Market Analysis, Insights and Forecast - by Application
- 10.1.1. Lion
- 10.1.2. Elephant
- 10.1.3. Others
- 10.2. Market Analysis, Insights and Forecast - by Types
- 10.2.1. Optical Imaging
- 10.2.2. Radionuclide Imaging
- 10.2.3. MRI
- 10.2.4. Computed Tomography Imaging
- 10.2.5. Ultrasound Imaging
- 10.1. Market Analysis, Insights and Forecast - by Application
- 11. Competitive Analysis
- 11.1. Global Market Share Analysis 2024
- 11.2. Company Profiles
- 11.2.1 IDEXX
- 11.2.1.1. Overview
- 11.2.1.2. Products
- 11.2.1.3. SWOT Analysis
- 11.2.1.4. Recent Developments
- 11.2.1.5. Financials (Based on Availability)
- 11.2.2 Esaote
- 11.2.2.1. Overview
- 11.2.2.2. Products
- 11.2.2.3. SWOT Analysis
- 11.2.2.4. Recent Developments
- 11.2.2.5. Financials (Based on Availability)
- 11.2.3 Agfa Healthcare
- 11.2.3.1. Overview
- 11.2.3.2. Products
- 11.2.3.3. SWOT Analysis
- 11.2.3.4. Recent Developments
- 11.2.3.5. Financials (Based on Availability)
- 11.2.4 Carestream Health
- 11.2.4.1. Overview
- 11.2.4.2. Products
- 11.2.4.3. SWOT Analysis
- 11.2.4.4. Recent Developments
- 11.2.4.5. Financials (Based on Availability)
- 11.2.5 BCF Technology
- 11.2.5.1. Overview
- 11.2.5.2. Products
- 11.2.5.3. SWOT Analysis
- 11.2.5.4. Recent Developments
- 11.2.5.5. Financials (Based on Availability)
- 11.2.6 Mindray
- 11.2.6.1. Overview
- 11.2.6.2. Products
- 11.2.6.3. SWOT Analysis
- 11.2.6.4. Recent Developments
- 11.2.6.5. Financials (Based on Availability)
- 11.2.7 Hallmarq
- 11.2.7.1. Overview
- 11.2.7.2. Products
- 11.2.7.3. SWOT Analysis
- 11.2.7.4. Recent Developments
- 11.2.7.5. Financials (Based on Availability)
- 11.2.8 Heska
- 11.2.8.1. Overview
- 11.2.8.2. Products
- 11.2.8.3. SWOT Analysis
- 11.2.8.4. Recent Developments
- 11.2.8.5. Financials (Based on Availability)
- 11.2.9 Sedecal
- 11.2.9.1. Overview
- 11.2.9.2. Products
- 11.2.9.3. SWOT Analysis
- 11.2.9.4. Recent Developments
- 11.2.9.5. Financials (Based on Availability)
- 11.2.10 Kaixin Electric
- 11.2.10.1. Overview
- 11.2.10.2. Products
- 11.2.10.3. SWOT Analysis
- 11.2.10.4. Recent Developments
- 11.2.10.5. Financials (Based on Availability)
- 11.2.11 Chison
- 11.2.11.1. Overview
- 11.2.11.2. Products
- 11.2.11.3. SWOT Analysis
- 11.2.11.4. Recent Developments
- 11.2.11.5. Financials (Based on Availability)
- 11.2.12 MinXray
- 11.2.12.1. Overview
- 11.2.12.2. Products
- 11.2.12.3. SWOT Analysis
- 11.2.12.4. Recent Developments
- 11.2.12.5. Financials (Based on Availability)
- 11.2.13 Diagnostic Imaging Systems
- 11.2.13.1. Overview
- 11.2.13.2. Products
- 11.2.13.3. SWOT Analysis
- 11.2.13.4. Recent Developments
- 11.2.13.5. Financials (Based on Availability)
- 11.2.14 Bruker Corporation
- 11.2.14.1. Overview
- 11.2.14.2. Products
- 11.2.14.3. SWOT Analysis
- 11.2.14.4. Recent Developments
- 11.2.14.5. Financials (Based on Availability)
- 11.2.1 IDEXX
List of Figures
- Figure 1: Global Great Animal Imaging Revenue Breakdown (million, %) by Region 2024 & 2032
- Figure 2: Global Great Animal Imaging Volume Breakdown (K, %) by Region 2024 & 2032
- Figure 3: North America Great Animal Imaging Revenue (million), by Application 2024 & 2032
- Figure 4: North America Great Animal Imaging Volume (K), by Application 2024 & 2032
- Figure 5: North America Great Animal Imaging Revenue Share (%), by Application 2024 & 2032
- Figure 6: North America Great Animal Imaging Volume Share (%), by Application 2024 & 2032
- Figure 7: North America Great Animal Imaging Revenue (million), by Types 2024 & 2032
- Figure 8: North America Great Animal Imaging Volume (K), by Types 2024 & 2032
- Figure 9: North America Great Animal Imaging Revenue Share (%), by Types 2024 & 2032
- Figure 10: North America Great Animal Imaging Volume Share (%), by Types 2024 & 2032
- Figure 11: North America Great Animal Imaging Revenue (million), by Country 2024 & 2032
- Figure 12: North America Great Animal Imaging Volume (K), by Country 2024 & 2032
- Figure 13: North America Great Animal Imaging Revenue Share (%), by Country 2024 & 2032
- Figure 14: North America Great Animal Imaging Volume Share (%), by Country 2024 & 2032
- Figure 15: South America Great Animal Imaging Revenue (million), by Application 2024 & 2032
- Figure 16: South America Great Animal Imaging Volume (K), by Application 2024 & 2032
- Figure 17: South America Great Animal Imaging Revenue Share (%), by Application 2024 & 2032
- Figure 18: South America Great Animal Imaging Volume Share (%), by Application 2024 & 2032
- Figure 19: South America Great Animal Imaging Revenue (million), by Types 2024 & 2032
- Figure 20: South America Great Animal Imaging Volume (K), by Types 2024 & 2032
- Figure 21: South America Great Animal Imaging Revenue Share (%), by Types 2024 & 2032
- Figure 22: South America Great Animal Imaging Volume Share (%), by Types 2024 & 2032
- Figure 23: South America Great Animal Imaging Revenue (million), by Country 2024 & 2032
- Figure 24: South America Great Animal Imaging Volume (K), by Country 2024 & 2032
- Figure 25: South America Great Animal Imaging Revenue Share (%), by Country 2024 & 2032
- Figure 26: South America Great Animal Imaging Volume Share (%), by Country 2024 & 2032
- Figure 27: Europe Great Animal Imaging Revenue (million), by Application 2024 & 2032
- Figure 28: Europe Great Animal Imaging Volume (K), by Application 2024 & 2032
- Figure 29: Europe Great Animal Imaging Revenue Share (%), by Application 2024 & 2032
- Figure 30: Europe Great Animal Imaging Volume Share (%), by Application 2024 & 2032
- Figure 31: Europe Great Animal Imaging Revenue (million), by Types 2024 & 2032
- Figure 32: Europe Great Animal Imaging Volume (K), by Types 2024 & 2032
- Figure 33: Europe Great Animal Imaging Revenue Share (%), by Types 2024 & 2032
- Figure 34: Europe Great Animal Imaging Volume Share (%), by Types 2024 & 2032
- Figure 35: Europe Great Animal Imaging Revenue (million), by Country 2024 & 2032
- Figure 36: Europe Great Animal Imaging Volume (K), by Country 2024 & 2032
- Figure 37: Europe Great Animal Imaging Revenue Share (%), by Country 2024 & 2032
- Figure 38: Europe Great Animal Imaging Volume Share (%), by Country 2024 & 2032
- Figure 39: Middle East & Africa Great Animal Imaging Revenue (million), by Application 2024 & 2032
- Figure 40: Middle East & Africa Great Animal Imaging Volume (K), by Application 2024 & 2032
- Figure 41: Middle East & Africa Great Animal Imaging Revenue Share (%), by Application 2024 & 2032
- Figure 42: Middle East & Africa Great Animal Imaging Volume Share (%), by Application 2024 & 2032
- Figure 43: Middle East & Africa Great Animal Imaging Revenue (million), by Types 2024 & 2032
- Figure 44: Middle East & Africa Great Animal Imaging Volume (K), by Types 2024 & 2032
- Figure 45: Middle East & Africa Great Animal Imaging Revenue Share (%), by Types 2024 & 2032
- Figure 46: Middle East & Africa Great Animal Imaging Volume Share (%), by Types 2024 & 2032
- Figure 47: Middle East & Africa Great Animal Imaging Revenue (million), by Country 2024 & 2032
- Figure 48: Middle East & Africa Great Animal Imaging Volume (K), by Country 2024 & 2032
- Figure 49: Middle East & Africa Great Animal Imaging Revenue Share (%), by Country 2024 & 2032
- Figure 50: Middle East & Africa Great Animal Imaging Volume Share (%), by Country 2024 & 2032
- Figure 51: Asia Pacific Great Animal Imaging Revenue (million), by Application 2024 & 2032
- Figure 52: Asia Pacific Great Animal Imaging Volume (K), by Application 2024 & 2032
- Figure 53: Asia Pacific Great Animal Imaging Revenue Share (%), by Application 2024 & 2032
- Figure 54: Asia Pacific Great Animal Imaging Volume Share (%), by Application 2024 & 2032
- Figure 55: Asia Pacific Great Animal Imaging Revenue (million), by Types 2024 & 2032
- Figure 56: Asia Pacific Great Animal Imaging Volume (K), by Types 2024 & 2032
- Figure 57: Asia Pacific Great Animal Imaging Revenue Share (%), by Types 2024 & 2032
- Figure 58: Asia Pacific Great Animal Imaging Volume Share (%), by Types 2024 & 2032
- Figure 59: Asia Pacific Great Animal Imaging Revenue (million), by Country 2024 & 2032
- Figure 60: Asia Pacific Great Animal Imaging Volume (K), by Country 2024 & 2032
- Figure 61: Asia Pacific Great Animal Imaging Revenue Share (%), by Country 2024 & 2032
- Figure 62: Asia Pacific Great Animal Imaging Volume Share (%), by Country 2024 & 2032
List of Tables
- Table 1: Global Great Animal Imaging Revenue million Forecast, by Region 2019 & 2032
- Table 2: Global Great Animal Imaging Volume K Forecast, by Region 2019 & 2032
- Table 3: Global Great Animal Imaging Revenue million Forecast, by Application 2019 & 2032
- Table 4: Global Great Animal Imaging Volume K Forecast, by Application 2019 & 2032
- Table 5: Global Great Animal Imaging Revenue million Forecast, by Types 2019 & 2032
- Table 6: Global Great Animal Imaging Volume K Forecast, by Types 2019 & 2032
- Table 7: Global Great Animal Imaging Revenue million Forecast, by Region 2019 & 2032
- Table 8: Global Great Animal Imaging Volume K Forecast, by Region 2019 & 2032
- Table 9: Global Great Animal Imaging Revenue million Forecast, by Application 2019 & 2032
- Table 10: Global Great Animal Imaging Volume K Forecast, by Application 2019 & 2032
- Table 11: Global Great Animal Imaging Revenue million Forecast, by Types 2019 & 2032
- Table 12: Global Great Animal Imaging Volume K Forecast, by Types 2019 & 2032
- Table 13: Global Great Animal Imaging Revenue million Forecast, by Country 2019 & 2032
- Table 14: Global Great Animal Imaging Volume K Forecast, by Country 2019 & 2032
- Table 15: United States Great Animal Imaging Revenue (million) Forecast, by Application 2019 & 2032
- Table 16: United States Great Animal Imaging Volume (K) Forecast, by Application 2019 & 2032
- Table 17: Canada Great Animal Imaging Revenue (million) Forecast, by Application 2019 & 2032
- Table 18: Canada Great Animal Imaging Volume (K) Forecast, by Application 2019 & 2032
- Table 19: Mexico Great Animal Imaging Revenue (million) Forecast, by Application 2019 & 2032
- Table 20: Mexico Great Animal Imaging Volume (K) Forecast, by Application 2019 & 2032
- Table 21: Global Great Animal Imaging Revenue million Forecast, by Application 2019 & 2032
- Table 22: Global Great Animal Imaging Volume K Forecast, by Application 2019 & 2032
- Table 23: Global Great Animal Imaging Revenue million Forecast, by Types 2019 & 2032
- Table 24: Global Great Animal Imaging Volume K Forecast, by Types 2019 & 2032
- Table 25: Global Great Animal Imaging Revenue million Forecast, by Country 2019 & 2032
- Table 26: Global Great Animal Imaging Volume K Forecast, by Country 2019 & 2032
- Table 27: Brazil Great Animal Imaging Revenue (million) Forecast, by Application 2019 & 2032
- Table 28: Brazil Great Animal Imaging Volume (K) Forecast, by Application 2019 & 2032
- Table 29: Argentina Great Animal Imaging Revenue (million) Forecast, by Application 2019 & 2032
- Table 30: Argentina Great Animal Imaging Volume (K) Forecast, by Application 2019 & 2032
- Table 31: Rest of South America Great Animal Imaging Revenue (million) Forecast, by Application 2019 & 2032
- Table 32: Rest of South America Great Animal Imaging Volume (K) Forecast, by Application 2019 & 2032
- Table 33: Global Great Animal Imaging Revenue million Forecast, by Application 2019 & 2032
- Table 34: Global Great Animal Imaging Volume K Forecast, by Application 2019 & 2032
- Table 35: Global Great Animal Imaging Revenue million Forecast, by Types 2019 & 2032
- Table 36: Global Great Animal Imaging Volume K Forecast, by Types 2019 & 2032
- Table 37: Global Great Animal Imaging Revenue million Forecast, by Country 2019 & 2032
- Table 38: Global Great Animal Imaging Volume K Forecast, by Country 2019 & 2032
- Table 39: United Kingdom Great Animal Imaging Revenue (million) Forecast, by Application 2019 & 2032
- Table 40: United Kingdom Great Animal Imaging Volume (K) Forecast, by Application 2019 & 2032
- Table 41: Germany Great Animal Imaging Revenue (million) Forecast, by Application 2019 & 2032
- Table 42: Germany Great Animal Imaging Volume (K) Forecast, by Application 2019 & 2032
- Table 43: France Great Animal Imaging Revenue (million) Forecast, by Application 2019 & 2032
- Table 44: France Great Animal Imaging Volume (K) Forecast, by Application 2019 & 2032
- Table 45: Italy Great Animal Imaging Revenue (million) Forecast, by Application 2019 & 2032
- Table 46: Italy Great Animal Imaging Volume (K) Forecast, by Application 2019 & 2032
- Table 47: Spain Great Animal Imaging Revenue (million) Forecast, by Application 2019 & 2032
- Table 48: Spain Great Animal Imaging Volume (K) Forecast, by Application 2019 & 2032
- Table 49: Russia Great Animal Imaging Revenue (million) Forecast, by Application 2019 & 2032
- Table 50: Russia Great Animal Imaging Volume (K) Forecast, by Application 2019 & 2032
- Table 51: Benelux Great Animal Imaging Revenue (million) Forecast, by Application 2019 & 2032
- Table 52: Benelux Great Animal Imaging Volume (K) Forecast, by Application 2019 & 2032
- Table 53: Nordics Great Animal Imaging Revenue (million) Forecast, by Application 2019 & 2032
- Table 54: Nordics Great Animal Imaging Volume (K) Forecast, by Application 2019 & 2032
- Table 55: Rest of Europe Great Animal Imaging Revenue (million) Forecast, by Application 2019 & 2032
- Table 56: Rest of Europe Great Animal Imaging Volume (K) Forecast, by Application 2019 & 2032
- Table 57: Global Great Animal Imaging Revenue million Forecast, by Application 2019 & 2032
- Table 58: Global Great Animal Imaging Volume K Forecast, by Application 2019 & 2032
- Table 59: Global Great Animal Imaging Revenue million Forecast, by Types 2019 & 2032
- Table 60: Global Great Animal Imaging Volume K Forecast, by Types 2019 & 2032
- Table 61: Global Great Animal Imaging Revenue million Forecast, by Country 2019 & 2032
- Table 62: Global Great Animal Imaging Volume K Forecast, by Country 2019 & 2032
- Table 63: Turkey Great Animal Imaging Revenue (million) Forecast, by Application 2019 & 2032
- Table 64: Turkey Great Animal Imaging Volume (K) Forecast, by Application 2019 & 2032
- Table 65: Israel Great Animal Imaging Revenue (million) Forecast, by Application 2019 & 2032
- Table 66: Israel Great Animal Imaging Volume (K) Forecast, by Application 2019 & 2032
- Table 67: GCC Great Animal Imaging Revenue (million) Forecast, by Application 2019 & 2032
- Table 68: GCC Great Animal Imaging Volume (K) Forecast, by Application 2019 & 2032
- Table 69: North Africa Great Animal Imaging Revenue (million) Forecast, by Application 2019 & 2032
- Table 70: North Africa Great Animal Imaging Volume (K) Forecast, by Application 2019 & 2032
- Table 71: South Africa Great Animal Imaging Revenue (million) Forecast, by Application 2019 & 2032
- Table 72: South Africa Great Animal Imaging Volume (K) Forecast, by Application 2019 & 2032
- Table 73: Rest of Middle East & Africa Great Animal Imaging Revenue (million) Forecast, by Application 2019 & 2032
- Table 74: Rest of Middle East & Africa Great Animal Imaging Volume (K) Forecast, by Application 2019 & 2032
- Table 75: Global Great Animal Imaging Revenue million Forecast, by Application 2019 & 2032
- Table 76: Global Great Animal Imaging Volume K Forecast, by Application 2019 & 2032
- Table 77: Global Great Animal Imaging Revenue million Forecast, by Types 2019 & 2032
- Table 78: Global Great Animal Imaging Volume K Forecast, by Types 2019 & 2032
- Table 79: Global Great Animal Imaging Revenue million Forecast, by Country 2019 & 2032
- Table 80: Global Great Animal Imaging Volume K Forecast, by Country 2019 & 2032
- Table 81: China Great Animal Imaging Revenue (million) Forecast, by Application 2019 & 2032
- Table 82: China Great Animal Imaging Volume (K) Forecast, by Application 2019 & 2032
- Table 83: India Great Animal Imaging Revenue (million) Forecast, by Application 2019 & 2032
- Table 84: India Great Animal Imaging Volume (K) Forecast, by Application 2019 & 2032
- Table 85: Japan Great Animal Imaging Revenue (million) Forecast, by Application 2019 & 2032
- Table 86: Japan Great Animal Imaging Volume (K) Forecast, by Application 2019 & 2032
- Table 87: South Korea Great Animal Imaging Revenue (million) Forecast, by Application 2019 & 2032
- Table 88: South Korea Great Animal Imaging Volume (K) Forecast, by Application 2019 & 2032
- Table 89: ASEAN Great Animal Imaging Revenue (million) Forecast, by Application 2019 & 2032
- Table 90: ASEAN Great Animal Imaging Volume (K) Forecast, by Application 2019 & 2032
- Table 91: Oceania Great Animal Imaging Revenue (million) Forecast, by Application 2019 & 2032
- Table 92: Oceania Great Animal Imaging Volume (K) Forecast, by Application 2019 & 2032
- Table 93: Rest of Asia Pacific Great Animal Imaging Revenue (million) Forecast, by Application 2019 & 2032
- Table 94: Rest of Asia Pacific Great Animal Imaging Volume (K) Forecast, by Application 2019 & 2032
Frequently Asked Questions
1. What is the projected Compound Annual Growth Rate (CAGR) of the Great Animal Imaging?
The projected CAGR is approximately XX%.
2. Which companies are prominent players in the Great Animal Imaging?
Key companies in the market include IDEXX, Esaote, Agfa Healthcare, Carestream Health, BCF Technology, Mindray, Hallmarq, Heska, Sedecal, Kaixin Electric, Chison, MinXray, Diagnostic Imaging Systems, Bruker Corporation.
3. What are the main segments of the Great Animal Imaging?
The market segments include Application, Types.
4. Can you provide details about the market size?
The market size is estimated to be USD XXX million as of 2022.
5. What are some drivers contributing to market growth?
N/A
6. What are the notable trends driving market growth?
N/A
7. Are there any restraints impacting market growth?
N/A
8. Can you provide examples of recent developments in the market?
N/A
9. What pricing options are available for accessing the report?
Pricing options include single-user, multi-user, and enterprise licenses priced at USD 3950.00, USD 5925.00, and USD 7900.00 respectively.
10. Is the market size provided in terms of value or volume?
The market size is provided in terms of value, measured in million and volume, measured in K.
11. Are there any specific market keywords associated with the report?
Yes, the market keyword associated with the report is "Great Animal Imaging," which aids in identifying and referencing the specific market segment covered.
12. How do I determine which pricing option suits my needs best?
The pricing options vary based on user requirements and access needs. Individual users may opt for single-user licenses, while businesses requiring broader access may choose multi-user or enterprise licenses for cost-effective access to the report.
13. Are there any additional resources or data provided in the Great Animal Imaging report?
While the report offers comprehensive insights, it's advisable to review the specific contents or supplementary materials provided to ascertain if additional resources or data are available.
14. How can I stay updated on further developments or reports in the Great Animal Imaging?
To stay informed about further developments, trends, and reports in the Great Animal Imaging, consider subscribing to industry newsletters, following relevant companies and organizations, or regularly checking reputable industry news sources and publications.
Methodology
Step 1 - Identification of Relevant Samples Size from Population Database


Step 2 - Approaches for Defining Global Market Size (Value, Volume* & Price*)

Note*: In applicable scenarios
Step 3 - Data Sources
Primary Research
- Web Analytics
- Survey Reports
- Research Institute
- Latest Research Reports
- Opinion Leaders
Secondary Research
- Annual Reports
- White Paper
- Latest Press Release
- Industry Association
- Paid Database
- Investor Presentations

Step 4 - Data Triangulation
Involves using different sources of information in order to increase the validity of a study
These sources are likely to be stakeholders in a program - participants, other researchers, program staff, other community members, and so on.
Then we put all data in single framework & apply various statistical tools to find out the dynamic on the market.
During the analysis stage, feedback from the stakeholder groups would be compared to determine areas of agreement as well as areas of divergence
