

Key Insights
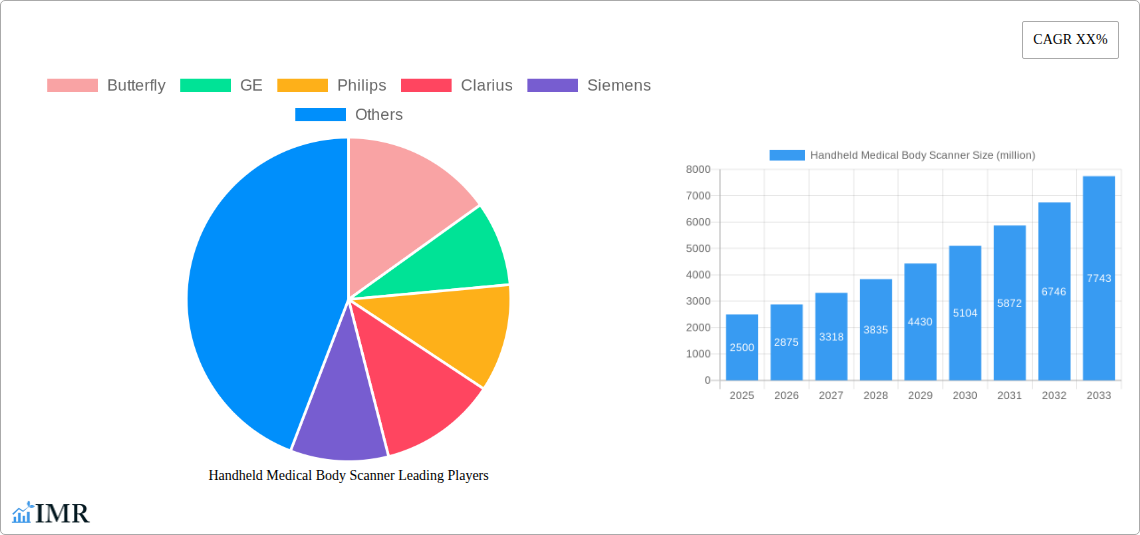
The handheld medical body scanner market is experiencing robust growth, driven by increasing demand for point-of-care diagnostics, rising prevalence of chronic diseases necessitating frequent monitoring, and advancements in imaging technology leading to smaller, more portable devices. The market's expansion is fueled by the need for rapid, accessible healthcare solutions, particularly in remote areas and underserved populations. This trend is further supported by the integration of AI and machine learning algorithms which improve image quality and analysis, leading to more accurate and efficient diagnoses. Major players like Butterfly, GE, Philips, and others are investing heavily in research and development, leading to innovation in sensor technology, image processing, and user-interface design, enhancing the overall user experience and widening the applications of these devices. We estimate the market size in 2025 to be approximately $2.5 billion, with a compound annual growth rate (CAGR) of 15% projected through 2033. This growth is anticipated across various segments, including ultrasound scanners, thermal imaging devices, and other emerging technologies.
However, several factors restrain market growth. High initial costs associated with acquiring these advanced devices can be a barrier for smaller clinics and healthcare providers. Regulatory hurdles related to device approval and reimbursement policies in different countries also pose challenges. Furthermore, ensuring data security and patient privacy in the context of increasingly connected medical devices is a critical concern that needs careful management. Despite these challenges, the long-term outlook for the handheld medical body scanner market remains positive, driven by continuous technological advancements, increasing investments, and a growing focus on preventative healthcare. The market segmentation will likely see further diversification, with specialized devices emerging for specific clinical applications.
Handheld Medical Body Scanner Market Report: 2019-2033
This comprehensive report provides an in-depth analysis of the handheld medical body scanner market, encompassing market dynamics, growth trends, regional analysis, product landscape, and key players. The study period covers 2019-2033, with 2025 as the base year and forecast period extending to 2033. The report leverages extensive primary and secondary research to deliver actionable insights for industry professionals, investors, and stakeholders. The parent market is the medical imaging equipment market (valued at $XX billion in 2025), and the child market is portable medical imaging devices.
Handheld Medical Body Scanner Market Dynamics & Structure
The handheld medical body scanner market is characterized by a moderately fragmented landscape, with key players like Butterfly, GE Healthcare, Philips, and Siemens competing alongside smaller, specialized companies. Market concentration is expected to increase slightly by 2033 as larger companies acquire smaller innovative firms. Technological innovation, particularly in ultrasound and AI-driven image analysis, is a primary growth driver. Stringent regulatory approvals (e.g., FDA clearance) present a significant barrier to entry, influencing market dynamics. The market faces competition from traditional diagnostic imaging modalities. End-users predominantly include hospitals, clinics, and point-of-care settings. The increasing adoption of telehealth and remote diagnostics is expected to boost market growth. M&A activity in the sector has been moderate in recent years, with approximately xx deals completed between 2019 and 2024.
- Market Concentration: Moderately fragmented, trending towards consolidation.
- Technological Innovation: AI-powered image analysis, improved portability, enhanced resolution are key drivers.
- Regulatory Frameworks: FDA approvals and CE markings pose significant hurdles.
- Competitive Substitutes: Traditional ultrasound machines, X-ray systems.
- End-User Demographics: Hospitals, clinics, emergency medical services, telehealth providers.
- M&A Trends: Moderate activity, primarily focused on smaller technology acquisitions. Estimated xx deals per year since 2019.
Handheld Medical Body Scanner Growth Trends & Insights
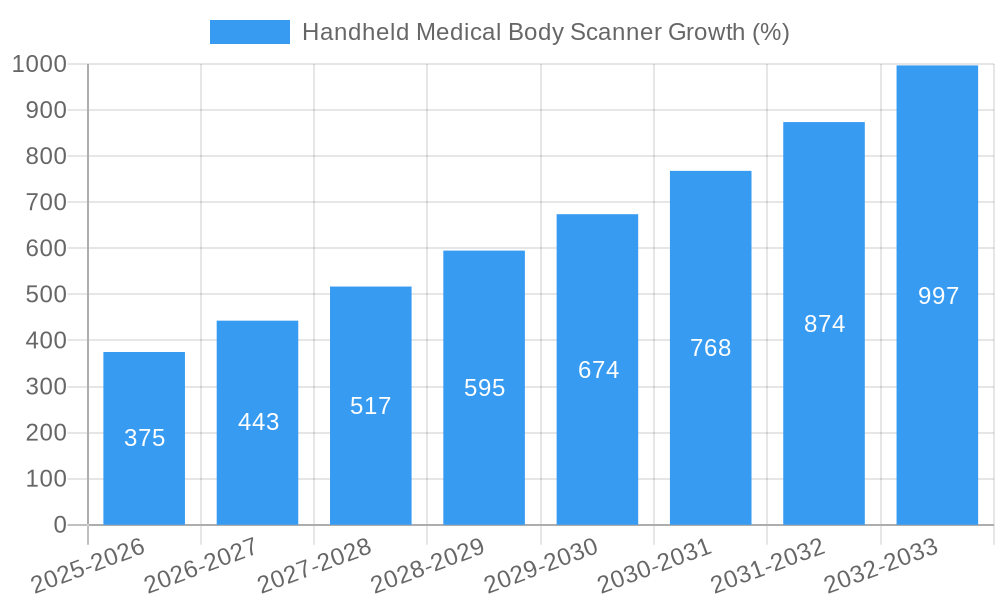
The handheld medical body scanner market witnessed significant growth during the historical period (2019-2024), driven by technological advancements and increasing demand for portable diagnostic tools. The market size in 2024 is estimated to be $XX million. The CAGR during this period was approximately xx%. The forecast period (2025-2033) projects continued growth, with a CAGR of xx%, driven by factors such as rising healthcare expenditure, aging populations, and increasing adoption in developing economies. Technological disruptions, including miniaturization and wireless connectivity, further accelerate adoption rates. Consumer behavior shifts towards convenient and accessible healthcare are fueling demand. Market penetration is anticipated to reach xx% by 2033. By 2033 the estimated market size is projected to be $XX million.
Dominant Regions, Countries, or Segments in Handheld Medical Body Scanner
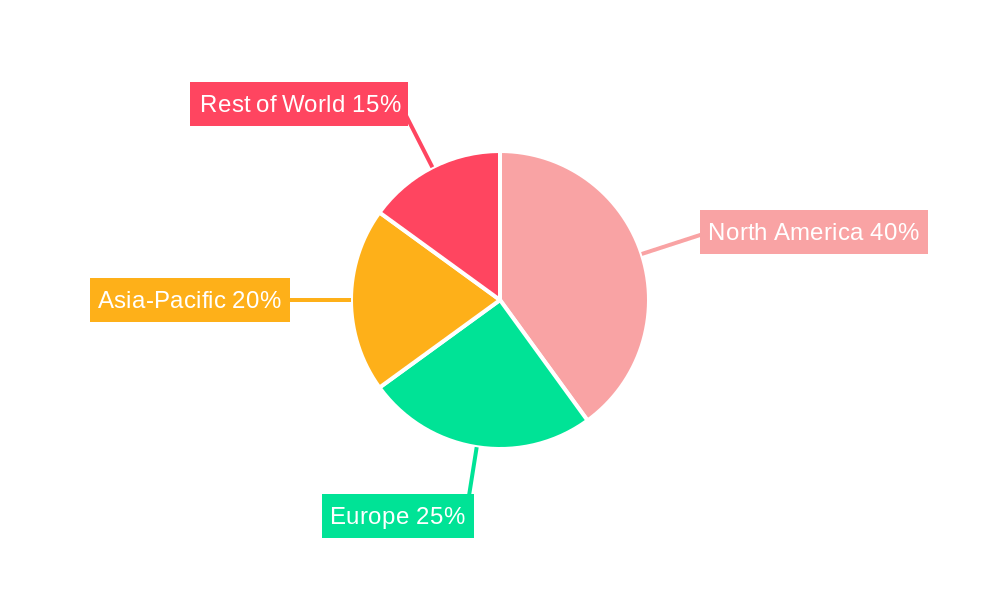
North America currently holds the largest market share, followed by Europe and Asia Pacific. This dominance is driven by robust healthcare infrastructure, high technological adoption rates, and increased funding for medical research and development. The US, in particular, leads due to the strong presence of major players and favorable regulatory environment. However, rapidly growing economies in Asia-Pacific and increasing healthcare investments in developing countries are expected to drive substantial growth in these regions during the forecast period.
- Key Drivers (North America): High healthcare expenditure, advanced infrastructure, established regulatory framework.
- Key Drivers (Asia-Pacific): Rapid economic growth, rising healthcare expenditure, increasing healthcare infrastructure development, large patient pool.
- Market Share: North America holds xx% market share in 2025. Asia Pacific is projected to witness the highest growth rate during the forecast period.
Handheld Medical Body Scanner Product Landscape
The product landscape is diverse, encompassing ultrasound scanners, ECG devices, and other diagnostic tools. Innovations include improved image quality, AI-assisted diagnostic capabilities, and wireless connectivity. Products are differentiated by their portability, image resolution, functionality, and user-friendliness. Unique selling propositions often emphasize convenience, affordability, and improved accessibility. Recent technological advancements include miniaturized sensors and improved signal processing techniques, leading to smaller, more powerful devices.
Key Drivers, Barriers & Challenges in Handheld Medical Body Scanner
Key Drivers: Increasing demand for point-of-care diagnostics, technological advancements leading to improved portability and image quality, rising healthcare expenditure, and the growing adoption of telehealth. The integration of AI and machine learning is also boosting the market.
Key Challenges: High initial investment costs, stringent regulatory requirements, concerns about data security and privacy, and the need for skilled professionals to operate and interpret the scans. The complexity of integrating these devices into existing healthcare workflows also presents a challenge. Supply chain disruptions have also impacted device availability. The market penetration rate of handheld medical scanners is less than xx% in developing countries.
Emerging Opportunities in Handheld Medical Body Scanner
Untapped markets in developing countries offer significant growth potential. The integration of these devices into home healthcare settings and the development of new applications, particularly in telemedicine and remote patient monitoring, present significant opportunities. Growing demand for minimally invasive procedures and personalized medicine also drives demand for handheld medical scanners.
Growth Accelerators in the Handheld Medical Body Scanner Industry
Technological breakthroughs in miniaturization, improved image processing, and AI-driven diagnostics are key growth catalysts. Strategic partnerships between technology companies and healthcare providers are expanding market reach and driving adoption. Expanding market penetration into underserved areas through initiatives like healthcare access programs will further accelerate market growth.
Key Players Shaping the Handheld Medical Body Scanner Market
- Butterfly Network
- GE Healthcare
- Philips
- Clarius
- Siemens Healthineers
- Fujifilm
- Canon Medical Systems Corporation
- Samsung
- Hitachi
- Mindray Medical
- Boston Scientific
- BenQ Medical
- Chison
- Ecare
- Esaote
- EchoNous
- Sonoscanner
- Mobisante
- Teratech
- Healcerion
Notable Milestones in Handheld Medical Body Scanner Sector
- 2020: FDA approval of Butterfly iQ+ ultrasound system.
- 2021: Launch of Clarius L7 handheld ultrasound scanner with enhanced image quality.
- 2022: Partnership between GE Healthcare and a leading AI company to develop advanced image analysis tools for handheld ultrasound.
- 2023: Acquisition of a smaller handheld scanner company by a major medical device manufacturer. (Specific details not available - xx).
- 2024: Introduction of new handheld ECG devices with improved accuracy and connectivity.
In-Depth Handheld Medical Body Scanner Market Outlook
The handheld medical body scanner market is poised for substantial growth over the next decade, driven by continued technological innovation, increasing affordability, and expanding applications across various healthcare settings. Strategic partnerships and collaborations between key players will further fuel market expansion. The focus on improved user interfaces, wireless connectivity, and AI-powered diagnostic capabilities will enhance the market appeal, particularly for emerging markets. The development of handheld devices for diverse applications, including dermatology, cardiology, and neurology, presents significant opportunities for market growth.
Handheld Medical Body Scanner Segmentation
-
1. Application
- 1.1. Hospital
- 1.2. Clinic
- 1.3. Other
-
2. Types
- 2.1. Wire
- 2.2. Wireless
Handheld Medical Body Scanner Segmentation By Geography
-
1. North America
- 1.1. United States
- 1.2. Canada
- 1.3. Mexico
-
2. South America
- 2.1. Brazil
- 2.2. Argentina
- 2.3. Rest of South America
-
3. Europe
- 3.1. United Kingdom
- 3.2. Germany
- 3.3. France
- 3.4. Italy
- 3.5. Spain
- 3.6. Russia
- 3.7. Benelux
- 3.8. Nordics
- 3.9. Rest of Europe
-
4. Middle East & Africa
- 4.1. Turkey
- 4.2. Israel
- 4.3. GCC
- 4.4. North Africa
- 4.5. South Africa
- 4.6. Rest of Middle East & Africa
-
5. Asia Pacific
- 5.1. China
- 5.2. India
- 5.3. Japan
- 5.4. South Korea
- 5.5. ASEAN
- 5.6. Oceania
- 5.7. Rest of Asia Pacific
Handheld Medical Body Scanner REPORT HIGHLIGHTS
| Aspects | Details |
|---|---|
| Study Period | 2019-2033 |
| Base Year | 2024 |
| Estimated Year | 2025 |
| Forecast Period | 2025-2033 |
| Historical Period | 2019-2024 |
| Growth Rate | CAGR of XX% from 2019-2033 |
| Segmentation |
|
Table of Contents
- 1. Introduction
- 1.1. Research Scope
- 1.2. Market Segmentation
- 1.3. Research Methodology
- 1.4. Definitions and Assumptions
- 2. Executive Summary
- 2.1. Introduction
- 3. Market Dynamics
- 3.1. Introduction
- 3.2. Market Drivers
- 3.3. Market Restrains
- 3.4. Market Trends
- 4. Market Factor Analysis
- 4.1. Porters Five Forces
- 4.2. Supply/Value Chain
- 4.3. PESTEL analysis
- 4.4. Market Entropy
- 4.5. Patent/Trademark Analysis
- 5. Global Handheld Medical Body Scanner Analysis, Insights and Forecast, 2019-2031
- 5.1. Market Analysis, Insights and Forecast - by Application
- 5.1.1. Hospital
- 5.1.2. Clinic
- 5.1.3. Other
- 5.2. Market Analysis, Insights and Forecast - by Types
- 5.2.1. Wire
- 5.2.2. Wireless
- 5.3. Market Analysis, Insights and Forecast - by Region
- 5.3.1. North America
- 5.3.2. South America
- 5.3.3. Europe
- 5.3.4. Middle East & Africa
- 5.3.5. Asia Pacific
- 5.1. Market Analysis, Insights and Forecast - by Application
- 6. North America Handheld Medical Body Scanner Analysis, Insights and Forecast, 2019-2031
- 6.1. Market Analysis, Insights and Forecast - by Application
- 6.1.1. Hospital
- 6.1.2. Clinic
- 6.1.3. Other
- 6.2. Market Analysis, Insights and Forecast - by Types
- 6.2.1. Wire
- 6.2.2. Wireless
- 6.1. Market Analysis, Insights and Forecast - by Application
- 7. South America Handheld Medical Body Scanner Analysis, Insights and Forecast, 2019-2031
- 7.1. Market Analysis, Insights and Forecast - by Application
- 7.1.1. Hospital
- 7.1.2. Clinic
- 7.1.3. Other
- 7.2. Market Analysis, Insights and Forecast - by Types
- 7.2.1. Wire
- 7.2.2. Wireless
- 7.1. Market Analysis, Insights and Forecast - by Application
- 8. Europe Handheld Medical Body Scanner Analysis, Insights and Forecast, 2019-2031
- 8.1. Market Analysis, Insights and Forecast - by Application
- 8.1.1. Hospital
- 8.1.2. Clinic
- 8.1.3. Other
- 8.2. Market Analysis, Insights and Forecast - by Types
- 8.2.1. Wire
- 8.2.2. Wireless
- 8.1. Market Analysis, Insights and Forecast - by Application
- 9. Middle East & Africa Handheld Medical Body Scanner Analysis, Insights and Forecast, 2019-2031
- 9.1. Market Analysis, Insights and Forecast - by Application
- 9.1.1. Hospital
- 9.1.2. Clinic
- 9.1.3. Other
- 9.2. Market Analysis, Insights and Forecast - by Types
- 9.2.1. Wire
- 9.2.2. Wireless
- 9.1. Market Analysis, Insights and Forecast - by Application
- 10. Asia Pacific Handheld Medical Body Scanner Analysis, Insights and Forecast, 2019-2031
- 10.1. Market Analysis, Insights and Forecast - by Application
- 10.1.1. Hospital
- 10.1.2. Clinic
- 10.1.3. Other
- 10.2. Market Analysis, Insights and Forecast - by Types
- 10.2.1. Wire
- 10.2.2. Wireless
- 10.1. Market Analysis, Insights and Forecast - by Application
- 11. Competitive Analysis
- 11.1. Global Market Share Analysis 2024
- 11.2. Company Profiles
- 11.2.1 Butterfly
- 11.2.1.1. Overview
- 11.2.1.2. Products
- 11.2.1.3. SWOT Analysis
- 11.2.1.4. Recent Developments
- 11.2.1.5. Financials (Based on Availability)
- 11.2.2 GE
- 11.2.2.1. Overview
- 11.2.2.2. Products
- 11.2.2.3. SWOT Analysis
- 11.2.2.4. Recent Developments
- 11.2.2.5. Financials (Based on Availability)
- 11.2.3 Philips
- 11.2.3.1. Overview
- 11.2.3.2. Products
- 11.2.3.3. SWOT Analysis
- 11.2.3.4. Recent Developments
- 11.2.3.5. Financials (Based on Availability)
- 11.2.4 Clarius
- 11.2.4.1. Overview
- 11.2.4.2. Products
- 11.2.4.3. SWOT Analysis
- 11.2.4.4. Recent Developments
- 11.2.4.5. Financials (Based on Availability)
- 11.2.5 Siemens
- 11.2.5.1. Overview
- 11.2.5.2. Products
- 11.2.5.3. SWOT Analysis
- 11.2.5.4. Recent Developments
- 11.2.5.5. Financials (Based on Availability)
- 11.2.6 Fujifilm
- 11.2.6.1. Overview
- 11.2.6.2. Products
- 11.2.6.3. SWOT Analysis
- 11.2.6.4. Recent Developments
- 11.2.6.5. Financials (Based on Availability)
- 11.2.7 Canon Medical Systems Corporation
- 11.2.7.1. Overview
- 11.2.7.2. Products
- 11.2.7.3. SWOT Analysis
- 11.2.7.4. Recent Developments
- 11.2.7.5. Financials (Based on Availability)
- 11.2.8 Samsung
- 11.2.8.1. Overview
- 11.2.8.2. Products
- 11.2.8.3. SWOT Analysis
- 11.2.8.4. Recent Developments
- 11.2.8.5. Financials (Based on Availability)
- 11.2.9 Hitachi
- 11.2.9.1. Overview
- 11.2.9.2. Products
- 11.2.9.3. SWOT Analysis
- 11.2.9.4. Recent Developments
- 11.2.9.5. Financials (Based on Availability)
- 11.2.10 Mindray Medical
- 11.2.10.1. Overview
- 11.2.10.2. Products
- 11.2.10.3. SWOT Analysis
- 11.2.10.4. Recent Developments
- 11.2.10.5. Financials (Based on Availability)
- 11.2.11 Boston Scientific
- 11.2.11.1. Overview
- 11.2.11.2. Products
- 11.2.11.3. SWOT Analysis
- 11.2.11.4. Recent Developments
- 11.2.11.5. Financials (Based on Availability)
- 11.2.12 BenQ Medical
- 11.2.12.1. Overview
- 11.2.12.2. Products
- 11.2.12.3. SWOT Analysis
- 11.2.12.4. Recent Developments
- 11.2.12.5. Financials (Based on Availability)
- 11.2.13 Chison
- 11.2.13.1. Overview
- 11.2.13.2. Products
- 11.2.13.3. SWOT Analysis
- 11.2.13.4. Recent Developments
- 11.2.13.5. Financials (Based on Availability)
- 11.2.14 Ecare
- 11.2.14.1. Overview
- 11.2.14.2. Products
- 11.2.14.3. SWOT Analysis
- 11.2.14.4. Recent Developments
- 11.2.14.5. Financials (Based on Availability)
- 11.2.15 Esaote
- 11.2.15.1. Overview
- 11.2.15.2. Products
- 11.2.15.3. SWOT Analysis
- 11.2.15.4. Recent Developments
- 11.2.15.5. Financials (Based on Availability)
- 11.2.16 EchoNous
- 11.2.16.1. Overview
- 11.2.16.2. Products
- 11.2.16.3. SWOT Analysis
- 11.2.16.4. Recent Developments
- 11.2.16.5. Financials (Based on Availability)
- 11.2.17 Sonoscanner
- 11.2.17.1. Overview
- 11.2.17.2. Products
- 11.2.17.3. SWOT Analysis
- 11.2.17.4. Recent Developments
- 11.2.17.5. Financials (Based on Availability)
- 11.2.18 Mobisante
- 11.2.18.1. Overview
- 11.2.18.2. Products
- 11.2.18.3. SWOT Analysis
- 11.2.18.4. Recent Developments
- 11.2.18.5. Financials (Based on Availability)
- 11.2.19 Teratech
- 11.2.19.1. Overview
- 11.2.19.2. Products
- 11.2.19.3. SWOT Analysis
- 11.2.19.4. Recent Developments
- 11.2.19.5. Financials (Based on Availability)
- 11.2.20 Healcerion
- 11.2.20.1. Overview
- 11.2.20.2. Products
- 11.2.20.3. SWOT Analysis
- 11.2.20.4. Recent Developments
- 11.2.20.5. Financials (Based on Availability)
- 11.2.1 Butterfly
List of Figures
- Figure 1: Global Handheld Medical Body Scanner Revenue Breakdown (million, %) by Region 2024 & 2032
- Figure 2: Global Handheld Medical Body Scanner Volume Breakdown (K, %) by Region 2024 & 2032
- Figure 3: North America Handheld Medical Body Scanner Revenue (million), by Application 2024 & 2032
- Figure 4: North America Handheld Medical Body Scanner Volume (K), by Application 2024 & 2032
- Figure 5: North America Handheld Medical Body Scanner Revenue Share (%), by Application 2024 & 2032
- Figure 6: North America Handheld Medical Body Scanner Volume Share (%), by Application 2024 & 2032
- Figure 7: North America Handheld Medical Body Scanner Revenue (million), by Types 2024 & 2032
- Figure 8: North America Handheld Medical Body Scanner Volume (K), by Types 2024 & 2032
- Figure 9: North America Handheld Medical Body Scanner Revenue Share (%), by Types 2024 & 2032
- Figure 10: North America Handheld Medical Body Scanner Volume Share (%), by Types 2024 & 2032
- Figure 11: North America Handheld Medical Body Scanner Revenue (million), by Country 2024 & 2032
- Figure 12: North America Handheld Medical Body Scanner Volume (K), by Country 2024 & 2032
- Figure 13: North America Handheld Medical Body Scanner Revenue Share (%), by Country 2024 & 2032
- Figure 14: North America Handheld Medical Body Scanner Volume Share (%), by Country 2024 & 2032
- Figure 15: South America Handheld Medical Body Scanner Revenue (million), by Application 2024 & 2032
- Figure 16: South America Handheld Medical Body Scanner Volume (K), by Application 2024 & 2032
- Figure 17: South America Handheld Medical Body Scanner Revenue Share (%), by Application 2024 & 2032
- Figure 18: South America Handheld Medical Body Scanner Volume Share (%), by Application 2024 & 2032
- Figure 19: South America Handheld Medical Body Scanner Revenue (million), by Types 2024 & 2032
- Figure 20: South America Handheld Medical Body Scanner Volume (K), by Types 2024 & 2032
- Figure 21: South America Handheld Medical Body Scanner Revenue Share (%), by Types 2024 & 2032
- Figure 22: South America Handheld Medical Body Scanner Volume Share (%), by Types 2024 & 2032
- Figure 23: South America Handheld Medical Body Scanner Revenue (million), by Country 2024 & 2032
- Figure 24: South America Handheld Medical Body Scanner Volume (K), by Country 2024 & 2032
- Figure 25: South America Handheld Medical Body Scanner Revenue Share (%), by Country 2024 & 2032
- Figure 26: South America Handheld Medical Body Scanner Volume Share (%), by Country 2024 & 2032
- Figure 27: Europe Handheld Medical Body Scanner Revenue (million), by Application 2024 & 2032
- Figure 28: Europe Handheld Medical Body Scanner Volume (K), by Application 2024 & 2032
- Figure 29: Europe Handheld Medical Body Scanner Revenue Share (%), by Application 2024 & 2032
- Figure 30: Europe Handheld Medical Body Scanner Volume Share (%), by Application 2024 & 2032
- Figure 31: Europe Handheld Medical Body Scanner Revenue (million), by Types 2024 & 2032
- Figure 32: Europe Handheld Medical Body Scanner Volume (K), by Types 2024 & 2032
- Figure 33: Europe Handheld Medical Body Scanner Revenue Share (%), by Types 2024 & 2032
- Figure 34: Europe Handheld Medical Body Scanner Volume Share (%), by Types 2024 & 2032
- Figure 35: Europe Handheld Medical Body Scanner Revenue (million), by Country 2024 & 2032
- Figure 36: Europe Handheld Medical Body Scanner Volume (K), by Country 2024 & 2032
- Figure 37: Europe Handheld Medical Body Scanner Revenue Share (%), by Country 2024 & 2032
- Figure 38: Europe Handheld Medical Body Scanner Volume Share (%), by Country 2024 & 2032
- Figure 39: Middle East & Africa Handheld Medical Body Scanner Revenue (million), by Application 2024 & 2032
- Figure 40: Middle East & Africa Handheld Medical Body Scanner Volume (K), by Application 2024 & 2032
- Figure 41: Middle East & Africa Handheld Medical Body Scanner Revenue Share (%), by Application 2024 & 2032
- Figure 42: Middle East & Africa Handheld Medical Body Scanner Volume Share (%), by Application 2024 & 2032
- Figure 43: Middle East & Africa Handheld Medical Body Scanner Revenue (million), by Types 2024 & 2032
- Figure 44: Middle East & Africa Handheld Medical Body Scanner Volume (K), by Types 2024 & 2032
- Figure 45: Middle East & Africa Handheld Medical Body Scanner Revenue Share (%), by Types 2024 & 2032
- Figure 46: Middle East & Africa Handheld Medical Body Scanner Volume Share (%), by Types 2024 & 2032
- Figure 47: Middle East & Africa Handheld Medical Body Scanner Revenue (million), by Country 2024 & 2032
- Figure 48: Middle East & Africa Handheld Medical Body Scanner Volume (K), by Country 2024 & 2032
- Figure 49: Middle East & Africa Handheld Medical Body Scanner Revenue Share (%), by Country 2024 & 2032
- Figure 50: Middle East & Africa Handheld Medical Body Scanner Volume Share (%), by Country 2024 & 2032
- Figure 51: Asia Pacific Handheld Medical Body Scanner Revenue (million), by Application 2024 & 2032
- Figure 52: Asia Pacific Handheld Medical Body Scanner Volume (K), by Application 2024 & 2032
- Figure 53: Asia Pacific Handheld Medical Body Scanner Revenue Share (%), by Application 2024 & 2032
- Figure 54: Asia Pacific Handheld Medical Body Scanner Volume Share (%), by Application 2024 & 2032
- Figure 55: Asia Pacific Handheld Medical Body Scanner Revenue (million), by Types 2024 & 2032
- Figure 56: Asia Pacific Handheld Medical Body Scanner Volume (K), by Types 2024 & 2032
- Figure 57: Asia Pacific Handheld Medical Body Scanner Revenue Share (%), by Types 2024 & 2032
- Figure 58: Asia Pacific Handheld Medical Body Scanner Volume Share (%), by Types 2024 & 2032
- Figure 59: Asia Pacific Handheld Medical Body Scanner Revenue (million), by Country 2024 & 2032
- Figure 60: Asia Pacific Handheld Medical Body Scanner Volume (K), by Country 2024 & 2032
- Figure 61: Asia Pacific Handheld Medical Body Scanner Revenue Share (%), by Country 2024 & 2032
- Figure 62: Asia Pacific Handheld Medical Body Scanner Volume Share (%), by Country 2024 & 2032
List of Tables
- Table 1: Global Handheld Medical Body Scanner Revenue million Forecast, by Region 2019 & 2032
- Table 2: Global Handheld Medical Body Scanner Volume K Forecast, by Region 2019 & 2032
- Table 3: Global Handheld Medical Body Scanner Revenue million Forecast, by Application 2019 & 2032
- Table 4: Global Handheld Medical Body Scanner Volume K Forecast, by Application 2019 & 2032
- Table 5: Global Handheld Medical Body Scanner Revenue million Forecast, by Types 2019 & 2032
- Table 6: Global Handheld Medical Body Scanner Volume K Forecast, by Types 2019 & 2032
- Table 7: Global Handheld Medical Body Scanner Revenue million Forecast, by Region 2019 & 2032
- Table 8: Global Handheld Medical Body Scanner Volume K Forecast, by Region 2019 & 2032
- Table 9: Global Handheld Medical Body Scanner Revenue million Forecast, by Application 2019 & 2032
- Table 10: Global Handheld Medical Body Scanner Volume K Forecast, by Application 2019 & 2032
- Table 11: Global Handheld Medical Body Scanner Revenue million Forecast, by Types 2019 & 2032
- Table 12: Global Handheld Medical Body Scanner Volume K Forecast, by Types 2019 & 2032
- Table 13: Global Handheld Medical Body Scanner Revenue million Forecast, by Country 2019 & 2032
- Table 14: Global Handheld Medical Body Scanner Volume K Forecast, by Country 2019 & 2032
- Table 15: United States Handheld Medical Body Scanner Revenue (million) Forecast, by Application 2019 & 2032
- Table 16: United States Handheld Medical Body Scanner Volume (K) Forecast, by Application 2019 & 2032
- Table 17: Canada Handheld Medical Body Scanner Revenue (million) Forecast, by Application 2019 & 2032
- Table 18: Canada Handheld Medical Body Scanner Volume (K) Forecast, by Application 2019 & 2032
- Table 19: Mexico Handheld Medical Body Scanner Revenue (million) Forecast, by Application 2019 & 2032
- Table 20: Mexico Handheld Medical Body Scanner Volume (K) Forecast, by Application 2019 & 2032
- Table 21: Global Handheld Medical Body Scanner Revenue million Forecast, by Application 2019 & 2032
- Table 22: Global Handheld Medical Body Scanner Volume K Forecast, by Application 2019 & 2032
- Table 23: Global Handheld Medical Body Scanner Revenue million Forecast, by Types 2019 & 2032
- Table 24: Global Handheld Medical Body Scanner Volume K Forecast, by Types 2019 & 2032
- Table 25: Global Handheld Medical Body Scanner Revenue million Forecast, by Country 2019 & 2032
- Table 26: Global Handheld Medical Body Scanner Volume K Forecast, by Country 2019 & 2032
- Table 27: Brazil Handheld Medical Body Scanner Revenue (million) Forecast, by Application 2019 & 2032
- Table 28: Brazil Handheld Medical Body Scanner Volume (K) Forecast, by Application 2019 & 2032
- Table 29: Argentina Handheld Medical Body Scanner Revenue (million) Forecast, by Application 2019 & 2032
- Table 30: Argentina Handheld Medical Body Scanner Volume (K) Forecast, by Application 2019 & 2032
- Table 31: Rest of South America Handheld Medical Body Scanner Revenue (million) Forecast, by Application 2019 & 2032
- Table 32: Rest of South America Handheld Medical Body Scanner Volume (K) Forecast, by Application 2019 & 2032
- Table 33: Global Handheld Medical Body Scanner Revenue million Forecast, by Application 2019 & 2032
- Table 34: Global Handheld Medical Body Scanner Volume K Forecast, by Application 2019 & 2032
- Table 35: Global Handheld Medical Body Scanner Revenue million Forecast, by Types 2019 & 2032
- Table 36: Global Handheld Medical Body Scanner Volume K Forecast, by Types 2019 & 2032
- Table 37: Global Handheld Medical Body Scanner Revenue million Forecast, by Country 2019 & 2032
- Table 38: Global Handheld Medical Body Scanner Volume K Forecast, by Country 2019 & 2032
- Table 39: United Kingdom Handheld Medical Body Scanner Revenue (million) Forecast, by Application 2019 & 2032
- Table 40: United Kingdom Handheld Medical Body Scanner Volume (K) Forecast, by Application 2019 & 2032
- Table 41: Germany Handheld Medical Body Scanner Revenue (million) Forecast, by Application 2019 & 2032
- Table 42: Germany Handheld Medical Body Scanner Volume (K) Forecast, by Application 2019 & 2032
- Table 43: France Handheld Medical Body Scanner Revenue (million) Forecast, by Application 2019 & 2032
- Table 44: France Handheld Medical Body Scanner Volume (K) Forecast, by Application 2019 & 2032
- Table 45: Italy Handheld Medical Body Scanner Revenue (million) Forecast, by Application 2019 & 2032
- Table 46: Italy Handheld Medical Body Scanner Volume (K) Forecast, by Application 2019 & 2032
- Table 47: Spain Handheld Medical Body Scanner Revenue (million) Forecast, by Application 2019 & 2032
- Table 48: Spain Handheld Medical Body Scanner Volume (K) Forecast, by Application 2019 & 2032
- Table 49: Russia Handheld Medical Body Scanner Revenue (million) Forecast, by Application 2019 & 2032
- Table 50: Russia Handheld Medical Body Scanner Volume (K) Forecast, by Application 2019 & 2032
- Table 51: Benelux Handheld Medical Body Scanner Revenue (million) Forecast, by Application 2019 & 2032
- Table 52: Benelux Handheld Medical Body Scanner Volume (K) Forecast, by Application 2019 & 2032
- Table 53: Nordics Handheld Medical Body Scanner Revenue (million) Forecast, by Application 2019 & 2032
- Table 54: Nordics Handheld Medical Body Scanner Volume (K) Forecast, by Application 2019 & 2032
- Table 55: Rest of Europe Handheld Medical Body Scanner Revenue (million) Forecast, by Application 2019 & 2032
- Table 56: Rest of Europe Handheld Medical Body Scanner Volume (K) Forecast, by Application 2019 & 2032
- Table 57: Global Handheld Medical Body Scanner Revenue million Forecast, by Application 2019 & 2032
- Table 58: Global Handheld Medical Body Scanner Volume K Forecast, by Application 2019 & 2032
- Table 59: Global Handheld Medical Body Scanner Revenue million Forecast, by Types 2019 & 2032
- Table 60: Global Handheld Medical Body Scanner Volume K Forecast, by Types 2019 & 2032
- Table 61: Global Handheld Medical Body Scanner Revenue million Forecast, by Country 2019 & 2032
- Table 62: Global Handheld Medical Body Scanner Volume K Forecast, by Country 2019 & 2032
- Table 63: Turkey Handheld Medical Body Scanner Revenue (million) Forecast, by Application 2019 & 2032
- Table 64: Turkey Handheld Medical Body Scanner Volume (K) Forecast, by Application 2019 & 2032
- Table 65: Israel Handheld Medical Body Scanner Revenue (million) Forecast, by Application 2019 & 2032
- Table 66: Israel Handheld Medical Body Scanner Volume (K) Forecast, by Application 2019 & 2032
- Table 67: GCC Handheld Medical Body Scanner Revenue (million) Forecast, by Application 2019 & 2032
- Table 68: GCC Handheld Medical Body Scanner Volume (K) Forecast, by Application 2019 & 2032
- Table 69: North Africa Handheld Medical Body Scanner Revenue (million) Forecast, by Application 2019 & 2032
- Table 70: North Africa Handheld Medical Body Scanner Volume (K) Forecast, by Application 2019 & 2032
- Table 71: South Africa Handheld Medical Body Scanner Revenue (million) Forecast, by Application 2019 & 2032
- Table 72: South Africa Handheld Medical Body Scanner Volume (K) Forecast, by Application 2019 & 2032
- Table 73: Rest of Middle East & Africa Handheld Medical Body Scanner Revenue (million) Forecast, by Application 2019 & 2032
- Table 74: Rest of Middle East & Africa Handheld Medical Body Scanner Volume (K) Forecast, by Application 2019 & 2032
- Table 75: Global Handheld Medical Body Scanner Revenue million Forecast, by Application 2019 & 2032
- Table 76: Global Handheld Medical Body Scanner Volume K Forecast, by Application 2019 & 2032
- Table 77: Global Handheld Medical Body Scanner Revenue million Forecast, by Types 2019 & 2032
- Table 78: Global Handheld Medical Body Scanner Volume K Forecast, by Types 2019 & 2032
- Table 79: Global Handheld Medical Body Scanner Revenue million Forecast, by Country 2019 & 2032
- Table 80: Global Handheld Medical Body Scanner Volume K Forecast, by Country 2019 & 2032
- Table 81: China Handheld Medical Body Scanner Revenue (million) Forecast, by Application 2019 & 2032
- Table 82: China Handheld Medical Body Scanner Volume (K) Forecast, by Application 2019 & 2032
- Table 83: India Handheld Medical Body Scanner Revenue (million) Forecast, by Application 2019 & 2032
- Table 84: India Handheld Medical Body Scanner Volume (K) Forecast, by Application 2019 & 2032
- Table 85: Japan Handheld Medical Body Scanner Revenue (million) Forecast, by Application 2019 & 2032
- Table 86: Japan Handheld Medical Body Scanner Volume (K) Forecast, by Application 2019 & 2032
- Table 87: South Korea Handheld Medical Body Scanner Revenue (million) Forecast, by Application 2019 & 2032
- Table 88: South Korea Handheld Medical Body Scanner Volume (K) Forecast, by Application 2019 & 2032
- Table 89: ASEAN Handheld Medical Body Scanner Revenue (million) Forecast, by Application 2019 & 2032
- Table 90: ASEAN Handheld Medical Body Scanner Volume (K) Forecast, by Application 2019 & 2032
- Table 91: Oceania Handheld Medical Body Scanner Revenue (million) Forecast, by Application 2019 & 2032
- Table 92: Oceania Handheld Medical Body Scanner Volume (K) Forecast, by Application 2019 & 2032
- Table 93: Rest of Asia Pacific Handheld Medical Body Scanner Revenue (million) Forecast, by Application 2019 & 2032
- Table 94: Rest of Asia Pacific Handheld Medical Body Scanner Volume (K) Forecast, by Application 2019 & 2032
Frequently Asked Questions
1. What is the projected Compound Annual Growth Rate (CAGR) of the Handheld Medical Body Scanner?
The projected CAGR is approximately XX%.
2. Which companies are prominent players in the Handheld Medical Body Scanner?
Key companies in the market include Butterfly, GE, Philips, Clarius, Siemens, Fujifilm, Canon Medical Systems Corporation, Samsung, Hitachi, Mindray Medical, Boston Scientific, BenQ Medical, Chison, Ecare, Esaote, EchoNous, Sonoscanner, Mobisante, Teratech, Healcerion.
3. What are the main segments of the Handheld Medical Body Scanner?
The market segments include Application, Types.
4. Can you provide details about the market size?
The market size is estimated to be USD XXX million as of 2022.
5. What are some drivers contributing to market growth?
N/A
6. What are the notable trends driving market growth?
N/A
7. Are there any restraints impacting market growth?
N/A
8. Can you provide examples of recent developments in the market?
N/A
9. What pricing options are available for accessing the report?
Pricing options include single-user, multi-user, and enterprise licenses priced at USD 4350.00, USD 6525.00, and USD 8700.00 respectively.
10. Is the market size provided in terms of value or volume?
The market size is provided in terms of value, measured in million and volume, measured in K.
11. Are there any specific market keywords associated with the report?
Yes, the market keyword associated with the report is "Handheld Medical Body Scanner," which aids in identifying and referencing the specific market segment covered.
12. How do I determine which pricing option suits my needs best?
The pricing options vary based on user requirements and access needs. Individual users may opt for single-user licenses, while businesses requiring broader access may choose multi-user or enterprise licenses for cost-effective access to the report.
13. Are there any additional resources or data provided in the Handheld Medical Body Scanner report?
While the report offers comprehensive insights, it's advisable to review the specific contents or supplementary materials provided to ascertain if additional resources or data are available.
14. How can I stay updated on further developments or reports in the Handheld Medical Body Scanner?
To stay informed about further developments, trends, and reports in the Handheld Medical Body Scanner, consider subscribing to industry newsletters, following relevant companies and organizations, or regularly checking reputable industry news sources and publications.
Methodology
Step 1 - Identification of Relevant Samples Size from Population Database


Step 2 - Approaches for Defining Global Market Size (Value, Volume* & Price*)

Note*: In applicable scenarios
Step 3 - Data Sources
Primary Research
- Web Analytics
- Survey Reports
- Research Institute
- Latest Research Reports
- Opinion Leaders
Secondary Research
- Annual Reports
- White Paper
- Latest Press Release
- Industry Association
- Paid Database
- Investor Presentations

Step 4 - Data Triangulation
Involves using different sources of information in order to increase the validity of a study
These sources are likely to be stakeholders in a program - participants, other researchers, program staff, other community members, and so on.
Then we put all data in single framework & apply various statistical tools to find out the dynamic on the market.
During the analysis stage, feedback from the stakeholder groups would be compared to determine areas of agreement as well as areas of divergence
