

Key Insights
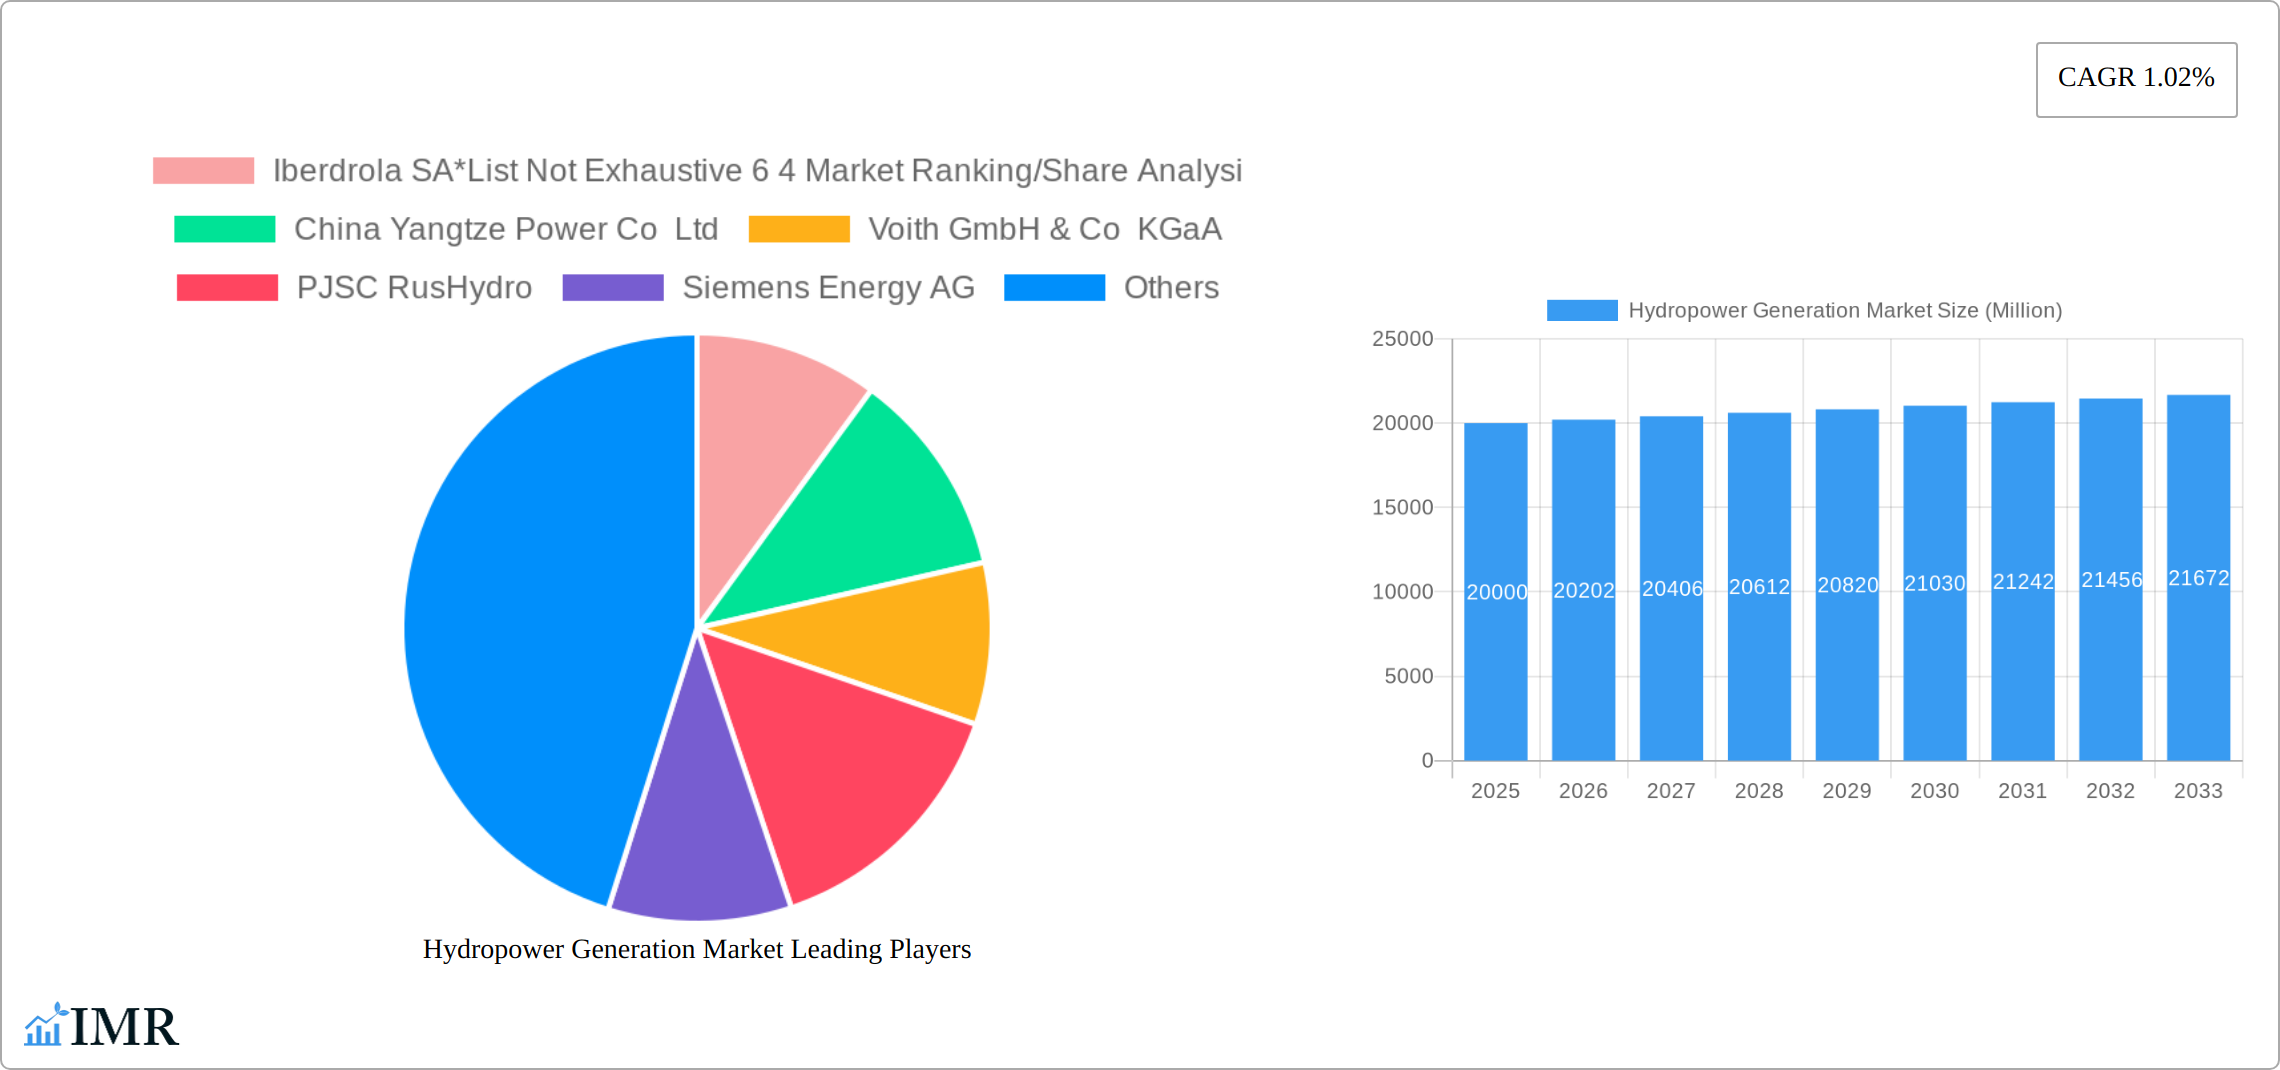
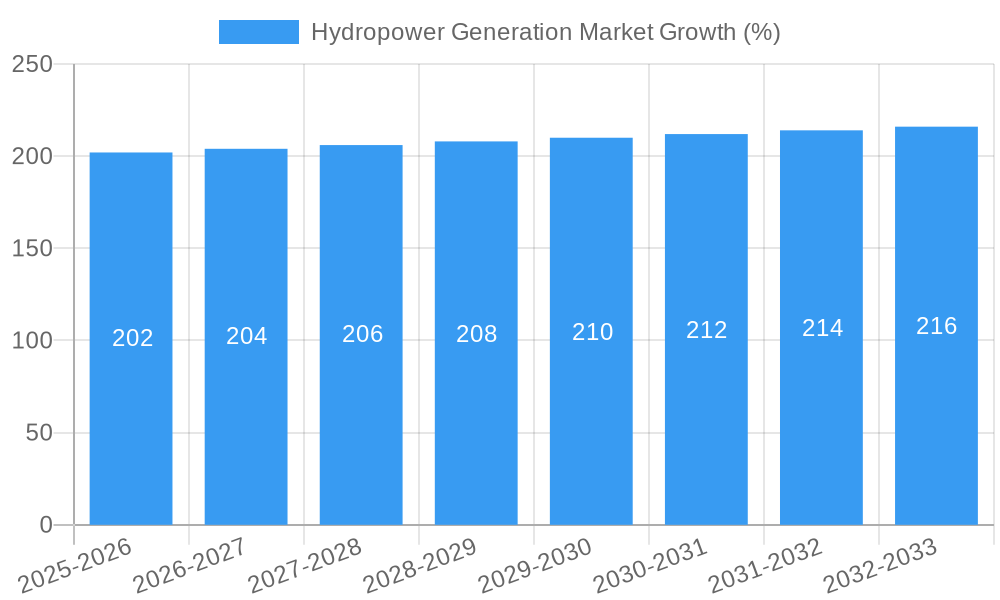
The global hydropower generation market, valued at approximately $XX million in 2025, is projected to experience steady growth with a CAGR of 1.02% from 2025 to 2033. This growth is driven by increasing demand for renewable energy sources, stringent government regulations promoting clean energy adoption, and the inherent reliability and sustainability of hydropower. Several key trends are shaping the market, including technological advancements in turbine design leading to improved efficiency and reduced environmental impact, the integration of smart grids and digital technologies for optimized energy management, and a growing focus on smaller-scale hydropower projects to address energy needs in remote or underserved areas. However, the market faces certain restraints such as the high initial capital investment required for hydropower projects, concerns about environmental consequences like dam construction's impact on ecosystems and fish migration, and the dependence on geographical factors such as water availability and suitable terrain. Segmentation reveals a significant contribution from large hydropower plants (greater than 100 MW), followed by smaller-scale projects (10-100 MW) and small hydropower plants (less than 10 MW). The market is highly competitive, with major players like Iberdrola SA, China Yangtze Power Co Ltd, Voith GmbH & Co KGaA, PJSC RusHydro, Siemens Energy AG, GE Renewable Energy, Andritz AG, and Électricité de France SA (EDF) vying for market share through technological innovation and strategic partnerships. Geographical distribution shows a strong presence across North America, Europe, and Asia Pacific, with variations in market share reflective of regional energy demands and resource availability.
Further analysis indicates that the consistent, albeit moderate, growth rate reflects the inherent stability of hydropower as a mature technology. While rapid expansion is less likely compared to emerging renewables like solar and wind, hydropower's established infrastructure and predictable energy output provide a crucial baseload power source. The market's success will hinge on effective mitigation of environmental concerns, leveraging technological advancements to enhance efficiency and sustainability, and strategic investments in smaller-scale projects to address energy access challenges in various regions. The ongoing geopolitical landscape also influences investment decisions, with countries prioritizing energy independence likely to drive greater investment in domestic hydropower resources. The competitive landscape will continue to be shaped by mergers and acquisitions, strategic alliances, and the constant pursuit of technological enhancements in turbine designs, grid integration strategies and operational efficiency.
Hydropower Generation Market: A Comprehensive Report (2019-2033)
This comprehensive report provides an in-depth analysis of the global Hydropower Generation Market, encompassing its dynamics, growth trends, regional segmentation, product landscape, key players, and future outlook. With a focus on both the parent market (Renewable Energy Generation) and child markets (Large, Small, and Other Hydropower plant sizes), this report offers invaluable insights for industry professionals, investors, and strategic decision-makers. The study period covers 2019-2033, with 2025 as the base and estimated year.
Hydropower Generation Market Dynamics & Structure
The Hydropower Generation Market is characterized by moderate concentration, with key players such as Iberdrola SA, China Yangtze Power Co Ltd, Voith GmbH & Co KGaA, PJSC RusHydro, Siemens Energy AG, GE Renewable Energy, Andritz AG, and Électricité de France SA (EDF) holding significant market share. Market analysis indicates a xx% market share for the top 6 players in 2025. Technological innovation, driven by advancements in turbine design, grid integration technologies, and digitalization, is a significant growth driver. However, regulatory hurdles, environmental concerns, and the availability of suitable geographical locations present challenges. Mergers and acquisitions (M&A) activity in the sector has been moderate, with xx deals recorded between 2019 and 2024, representing a total value of xx Million.
- Market Concentration: Moderately concentrated, with top 6 players holding xx% market share in 2025.
- Technological Innovation: Focus on improved turbine efficiency, smart grid integration, and digital monitoring.
- Regulatory Framework: Varied across regions, impacting project approvals and environmental compliance.
- Competitive Substitutes: Solar, wind, and other renewable energy sources pose competitive pressure.
- End-User Demographics: Primarily utility companies, independent power producers, and government entities.
- M&A Trends: Moderate activity, with xx deals valued at xx Million between 2019 and 2024.
Hydropower Generation Market Growth Trends & Insights
The global Hydropower Generation Market witnessed significant growth during the historical period (2019-2024), expanding at a CAGR of xx%. This growth is attributed to increasing demand for renewable energy sources, supportive government policies, and investments in hydropower infrastructure, particularly in developing economies. The market size reached xx Million in 2024 and is projected to reach xx Million by 2033, exhibiting a CAGR of xx% during the forecast period (2025-2033). Technological advancements, such as the development of high-efficiency turbines and improved grid integration solutions, further contribute to market expansion. However, fluctuating water levels, environmental concerns, and long project lead times pose challenges to sustained growth. Market penetration in developing regions is expected to increase significantly, while mature markets will see more focused improvements in efficiency and capacity.
Dominant Regions, Countries, or Segments in Hydropower Generation Market
China, followed by Brazil and India, have consistently been the leading regions in Hydropower Generation, fueled by robust government support for renewable energy and significant investments in large-scale hydropower projects. The Large Hydropower segment (greater than 100 MW) dominates the market in terms of capacity and revenue generation, largely due to its economies of scale. However, the Small Hydropower segment (smaller than 10 MW) is gaining traction due to its suitability for decentralized energy generation and reduced environmental impact in specific geographic contexts.
- Key Drivers:
- Government Policies: Subsidies, tax incentives, and renewable energy targets.
- Infrastructure Development: Investments in transmission and distribution networks.
- Economic Growth: Increased energy demand from industrial and residential sectors.
- Dominance Factors: Large hydropower projects in China, Brazil and India contribute significantly to market dominance. Economic stability and favorable regulatory environments play a pivotal role.
Hydropower Generation Market Product Landscape
The Hydropower Generation Market features a diverse range of products, including various turbine designs (e.g., Francis, Kaplan, Pelton), generators, control systems, and related equipment. Recent innovations focus on enhancing efficiency, reducing environmental impact, and improving grid integration capabilities. Unique selling propositions (USPs) include higher energy conversion rates, reduced maintenance requirements, and advanced monitoring systems. The market is witnessing a trend towards larger capacity turbines and the integration of digital technologies for improved performance and operational efficiency.
Key Drivers, Barriers & Challenges in Hydropower Generation Market
Key Drivers:
- Growing demand for clean energy
- Favorable government policies and incentives
- Technological advancements in turbine efficiency and grid integration
Key Challenges:
- High initial capital costs
- Environmental concerns (e.g., dam impacts on ecosystems)
- Long project lead times and permitting processes
- Potential for water scarcity and climate change impacts
Emerging Opportunities in Hydropower Generation Market
- Mini-Hydro and Micro-Hydro: Expanding applications in remote areas and off-grid solutions are driving significant growth, particularly in underserved communities and regions with limited grid infrastructure. These smaller-scale projects offer faster deployment times and lower upfront capital costs compared to large-scale hydropower plants.
- Pumped Hydro Storage (PHS): PHS is increasingly crucial for addressing grid stability issues arising from the intermittent nature of renewable energy sources like solar and wind. Its ability to provide flexible and reliable energy storage makes it a vital component of a modern, decarbonized power grid.
- Floating Hydropower: This innovative technology leverages existing water bodies, such as reservoirs and lakes, to generate power without the need for large, environmentally disruptive dams. It offers a compelling solution for maximizing existing water resources and minimizing environmental impact.
- Technological Advancements: Ongoing advancements in turbine technology, digitalization, and predictive maintenance are leading to improved efficiency, reduced operational costs, and enhanced sustainability. AI-powered monitoring systems and remote diagnostics are optimizing plant performance and minimizing downtime.
- Green Hydrogen Production: Hydropower plants are increasingly being utilized to produce green hydrogen, a clean fuel source with growing applications in various sectors. This diversification expands the market potential and contributes to broader decarbonization efforts.
Growth Accelerators in the Hydropower Generation Market Industry
Technological breakthroughs in turbine design and materials, strategic partnerships between technology providers and energy companies, and expansion into untapped markets (e.g., Africa, Southeast Asia) are crucial growth accelerators. Furthermore, innovative financing models and policy reforms facilitating project development are driving market growth.
Key Players Shaping the Hydropower Generation Market Market
- Iberdrola SA
- China Yangtze Power Co Ltd
- Voith GmbH & Co KGaA
- PJSC RusHydro
- Siemens Energy AG
- GE Renewable Energy
- Andritz AG
- Électricité de France SA (EDF)
Notable Milestones in Hydropower Generation Market Sector
- May 2023: Satluj Jal Vidyut Nigam (SJVN) of India secured approval for a second hydropower project in Nepal (669 MW Lower Arun project), adding to its existing 900-MW Arun-III project (scheduled for completion in 2024). This significant investment underscores the growing interest in expanding hydropower capacity in the region, driven by increasing energy demands and a focus on renewable energy sources.
- December 2022: The completion of China's Baihetan hydropower plant, its second-largest, significantly boosted its hydropower generation capacity and solidified its global leadership in this sector. This demonstrates the scale of investment and technological capabilities required for large-scale hydropower projects.
- [Add another recent milestone here with a date and brief description] Example: [Month Year]: [Company/Country] announces a major investment in [type of hydropower project] highlighting [key aspect, e.g., innovative technology, sustainable practices].
In-Depth Hydropower Generation Market Market Outlook
The Hydropower Generation Market is poised for continued growth, driven by the global push towards decarbonization and the inherent advantages of hydropower as a reliable and sustainable energy source. Strategic partnerships, technological advancements, and expansion into emerging markets will shape the future of the industry. Companies that can effectively navigate environmental regulations, manage project risks, and leverage technological innovation will be best positioned to capture market share and drive long-term growth. The market is expected to reach xx Million by 2033, representing significant opportunities for investors and industry players.
Hydropower Generation Market Segmentation
-
1. Size
- 1.1. Large Hydropower (Greater Than 100 MW)
- 1.2. Small Hydropower (Smaller Than 10 MW)
- 1.3. Other Sizes (10-100 MW)
Hydropower Generation Market Segmentation By Geography
-
1. North America
- 1.1. United States
- 1.2. Canada
- 1.3. Rest of North America
-
2. Europe
- 2.1. Germany
- 2.2. France
- 2.3. United Kingdom
- 2.4. Rest of Europe
-
3. Asia Pacific
- 3.1. China
- 3.2. India
- 3.3. Japan
- 3.4. South Korea
- 3.5. Rest of Asia Pacific
-
4. South America
- 4.1. Brazil
- 4.2. Argentina
- 4.3. Rest of South America
-
5. Middle East and Africa
- 5.1. Saudi Arabia
- 5.2. United Arab Emirates
- 5.3. South Africa
- 5.4. Rest of Middle East and Africa

Hydropower Generation Market REPORT HIGHLIGHTS
| Aspects | Details |
|---|---|
| Study Period | 2019-2033 |
| Base Year | 2024 |
| Estimated Year | 2025 |
| Forecast Period | 2025-2033 |
| Historical Period | 2019-2024 |
| Growth Rate | CAGR of 1.02% from 2019-2033 |
| Segmentation |
|
Table of Contents
- 1. Introduction
- 1.1. Research Scope
- 1.2. Market Segmentation
- 1.3. Research Methodology
- 1.4. Definitions and Assumptions
- 2. Executive Summary
- 2.1. Introduction
- 3. Market Dynamics
- 3.1. Introduction
- 3.2. Market Drivers
- 3.2.1. 4.; Rising Demand for Reliable Electricity4.; Increasing Government Support for Hydropower Gneeration
- 3.3. Market Restrains
- 3.3.1. 4.; Negative Environmental Consequences of Hydropower Projects
- 3.4. Market Trends
- 3.4.1. The Large Hydropower (Greater Than 100 MW) Segment to Dominate the Market
- 4. Market Factor Analysis
- 4.1. Porters Five Forces
- 4.2. Supply/Value Chain
- 4.3. PESTEL analysis
- 4.4. Market Entropy
- 4.5. Patent/Trademark Analysis
- 5. Global Hydropower Generation Market Analysis, Insights and Forecast, 2019-2031
- 5.1. Market Analysis, Insights and Forecast - by Size
- 5.1.1. Large Hydropower (Greater Than 100 MW)
- 5.1.2. Small Hydropower (Smaller Than 10 MW)
- 5.1.3. Other Sizes (10-100 MW)
- 5.2. Market Analysis, Insights and Forecast - by Region
- 5.2.1. North America
- 5.2.2. Europe
- 5.2.3. Asia Pacific
- 5.2.4. South America
- 5.2.5. Middle East and Africa
- 5.1. Market Analysis, Insights and Forecast - by Size
- 6. North America Hydropower Generation Market Analysis, Insights and Forecast, 2019-2031
- 6.1. Market Analysis, Insights and Forecast - by Size
- 6.1.1. Large Hydropower (Greater Than 100 MW)
- 6.1.2. Small Hydropower (Smaller Than 10 MW)
- 6.1.3. Other Sizes (10-100 MW)
- 6.1. Market Analysis, Insights and Forecast - by Size
- 7. Europe Hydropower Generation Market Analysis, Insights and Forecast, 2019-2031
- 7.1. Market Analysis, Insights and Forecast - by Size
- 7.1.1. Large Hydropower (Greater Than 100 MW)
- 7.1.2. Small Hydropower (Smaller Than 10 MW)
- 7.1.3. Other Sizes (10-100 MW)
- 7.1. Market Analysis, Insights and Forecast - by Size
- 8. Asia Pacific Hydropower Generation Market Analysis, Insights and Forecast, 2019-2031
- 8.1. Market Analysis, Insights and Forecast - by Size
- 8.1.1. Large Hydropower (Greater Than 100 MW)
- 8.1.2. Small Hydropower (Smaller Than 10 MW)
- 8.1.3. Other Sizes (10-100 MW)
- 8.1. Market Analysis, Insights and Forecast - by Size
- 9. South America Hydropower Generation Market Analysis, Insights and Forecast, 2019-2031
- 9.1. Market Analysis, Insights and Forecast - by Size
- 9.1.1. Large Hydropower (Greater Than 100 MW)
- 9.1.2. Small Hydropower (Smaller Than 10 MW)
- 9.1.3. Other Sizes (10-100 MW)
- 9.1. Market Analysis, Insights and Forecast - by Size
- 10. Middle East and Africa Hydropower Generation Market Analysis, Insights and Forecast, 2019-2031
- 10.1. Market Analysis, Insights and Forecast - by Size
- 10.1.1. Large Hydropower (Greater Than 100 MW)
- 10.1.2. Small Hydropower (Smaller Than 10 MW)
- 10.1.3. Other Sizes (10-100 MW)
- 10.1. Market Analysis, Insights and Forecast - by Size
- 11. North America Hydropower Generation Market Analysis, Insights and Forecast, 2019-2031
- 11.1. Market Analysis, Insights and Forecast - By Country/Sub-region
- 11.1.1 United States
- 11.1.2 Canada
- 11.1.3 Rest of North America
- 12. Europe Hydropower Generation Market Analysis, Insights and Forecast, 2019-2031
- 12.1. Market Analysis, Insights and Forecast - By Country/Sub-region
- 12.1.1 Germany
- 12.1.2 France
- 12.1.3 United Kingdom
- 12.1.4 Rest of Europe
- 13. Asia Pacific Hydropower Generation Market Analysis, Insights and Forecast, 2019-2031
- 13.1. Market Analysis, Insights and Forecast - By Country/Sub-region
- 13.1.1 China
- 13.1.2 India
- 13.1.3 Japan
- 13.1.4 South Korea
- 13.1.5 Rest of Asia Pacific
- 14. South America Hydropower Generation Market Analysis, Insights and Forecast, 2019-2031
- 14.1. Market Analysis, Insights and Forecast - By Country/Sub-region
- 14.1.1 Brazil
- 14.1.2 Argentina
- 14.1.3 Rest of South America
- 15. Middle East and Africa Hydropower Generation Market Analysis, Insights and Forecast, 2019-2031
- 15.1. Market Analysis, Insights and Forecast - By Country/Sub-region
- 15.1.1 Saudi Arabia
- 15.1.2 United Arab Emirates
- 15.1.3 South Africa
- 15.1.4 Rest of Middle East and Africa
- 16. Competitive Analysis
- 16.1. Global Market Share Analysis 2024
- 16.2. Company Profiles
- 16.2.1 Iberdrola SA*List Not Exhaustive 6 4 Market Ranking/Share Analysi
- 16.2.1.1. Overview
- 16.2.1.2. Products
- 16.2.1.3. SWOT Analysis
- 16.2.1.4. Recent Developments
- 16.2.1.5. Financials (Based on Availability)
- 16.2.2 China Yangtze Power Co Ltd
- 16.2.2.1. Overview
- 16.2.2.2. Products
- 16.2.2.3. SWOT Analysis
- 16.2.2.4. Recent Developments
- 16.2.2.5. Financials (Based on Availability)
- 16.2.3 Voith GmbH & Co KGaA
- 16.2.3.1. Overview
- 16.2.3.2. Products
- 16.2.3.3. SWOT Analysis
- 16.2.3.4. Recent Developments
- 16.2.3.5. Financials (Based on Availability)
- 16.2.4 PJSC RusHydro
- 16.2.4.1. Overview
- 16.2.4.2. Products
- 16.2.4.3. SWOT Analysis
- 16.2.4.4. Recent Developments
- 16.2.4.5. Financials (Based on Availability)
- 16.2.5 Siemens Energy AG
- 16.2.5.1. Overview
- 16.2.5.2. Products
- 16.2.5.3. SWOT Analysis
- 16.2.5.4. Recent Developments
- 16.2.5.5. Financials (Based on Availability)
- 16.2.6 GE Renewable Energy
- 16.2.6.1. Overview
- 16.2.6.2. Products
- 16.2.6.3. SWOT Analysis
- 16.2.6.4. Recent Developments
- 16.2.6.5. Financials (Based on Availability)
- 16.2.7 Andritz AG
- 16.2.7.1. Overview
- 16.2.7.2. Products
- 16.2.7.3. SWOT Analysis
- 16.2.7.4. Recent Developments
- 16.2.7.5. Financials (Based on Availability)
- 16.2.8 Électricité de France SA (EDF)
- 16.2.8.1. Overview
- 16.2.8.2. Products
- 16.2.8.3. SWOT Analysis
- 16.2.8.4. Recent Developments
- 16.2.8.5. Financials (Based on Availability)
- 16.2.1 Iberdrola SA*List Not Exhaustive 6 4 Market Ranking/Share Analysi
List of Figures
- Figure 1: Global Hydropower Generation Market Revenue Breakdown (Million, %) by Region 2024 & 2032
- Figure 2: Global Hydropower Generation Market Volume Breakdown (terawatt, %) by Region 2024 & 2032
- Figure 3: North America Hydropower Generation Market Revenue (Million), by Country 2024 & 2032
- Figure 4: North America Hydropower Generation Market Volume (terawatt), by Country 2024 & 2032
- Figure 5: North America Hydropower Generation Market Revenue Share (%), by Country 2024 & 2032
- Figure 6: North America Hydropower Generation Market Volume Share (%), by Country 2024 & 2032
- Figure 7: Europe Hydropower Generation Market Revenue (Million), by Country 2024 & 2032
- Figure 8: Europe Hydropower Generation Market Volume (terawatt), by Country 2024 & 2032
- Figure 9: Europe Hydropower Generation Market Revenue Share (%), by Country 2024 & 2032
- Figure 10: Europe Hydropower Generation Market Volume Share (%), by Country 2024 & 2032
- Figure 11: Asia Pacific Hydropower Generation Market Revenue (Million), by Country 2024 & 2032
- Figure 12: Asia Pacific Hydropower Generation Market Volume (terawatt), by Country 2024 & 2032
- Figure 13: Asia Pacific Hydropower Generation Market Revenue Share (%), by Country 2024 & 2032
- Figure 14: Asia Pacific Hydropower Generation Market Volume Share (%), by Country 2024 & 2032
- Figure 15: South America Hydropower Generation Market Revenue (Million), by Country 2024 & 2032
- Figure 16: South America Hydropower Generation Market Volume (terawatt), by Country 2024 & 2032
- Figure 17: South America Hydropower Generation Market Revenue Share (%), by Country 2024 & 2032
- Figure 18: South America Hydropower Generation Market Volume Share (%), by Country 2024 & 2032
- Figure 19: Middle East and Africa Hydropower Generation Market Revenue (Million), by Country 2024 & 2032
- Figure 20: Middle East and Africa Hydropower Generation Market Volume (terawatt), by Country 2024 & 2032
- Figure 21: Middle East and Africa Hydropower Generation Market Revenue Share (%), by Country 2024 & 2032
- Figure 22: Middle East and Africa Hydropower Generation Market Volume Share (%), by Country 2024 & 2032
- Figure 23: North America Hydropower Generation Market Revenue (Million), by Size 2024 & 2032
- Figure 24: North America Hydropower Generation Market Volume (terawatt), by Size 2024 & 2032
- Figure 25: North America Hydropower Generation Market Revenue Share (%), by Size 2024 & 2032
- Figure 26: North America Hydropower Generation Market Volume Share (%), by Size 2024 & 2032
- Figure 27: North America Hydropower Generation Market Revenue (Million), by Country 2024 & 2032
- Figure 28: North America Hydropower Generation Market Volume (terawatt), by Country 2024 & 2032
- Figure 29: North America Hydropower Generation Market Revenue Share (%), by Country 2024 & 2032
- Figure 30: North America Hydropower Generation Market Volume Share (%), by Country 2024 & 2032
- Figure 31: Europe Hydropower Generation Market Revenue (Million), by Size 2024 & 2032
- Figure 32: Europe Hydropower Generation Market Volume (terawatt), by Size 2024 & 2032
- Figure 33: Europe Hydropower Generation Market Revenue Share (%), by Size 2024 & 2032
- Figure 34: Europe Hydropower Generation Market Volume Share (%), by Size 2024 & 2032
- Figure 35: Europe Hydropower Generation Market Revenue (Million), by Country 2024 & 2032
- Figure 36: Europe Hydropower Generation Market Volume (terawatt), by Country 2024 & 2032
- Figure 37: Europe Hydropower Generation Market Revenue Share (%), by Country 2024 & 2032
- Figure 38: Europe Hydropower Generation Market Volume Share (%), by Country 2024 & 2032
- Figure 39: Asia Pacific Hydropower Generation Market Revenue (Million), by Size 2024 & 2032
- Figure 40: Asia Pacific Hydropower Generation Market Volume (terawatt), by Size 2024 & 2032
- Figure 41: Asia Pacific Hydropower Generation Market Revenue Share (%), by Size 2024 & 2032
- Figure 42: Asia Pacific Hydropower Generation Market Volume Share (%), by Size 2024 & 2032
- Figure 43: Asia Pacific Hydropower Generation Market Revenue (Million), by Country 2024 & 2032
- Figure 44: Asia Pacific Hydropower Generation Market Volume (terawatt), by Country 2024 & 2032
- Figure 45: Asia Pacific Hydropower Generation Market Revenue Share (%), by Country 2024 & 2032
- Figure 46: Asia Pacific Hydropower Generation Market Volume Share (%), by Country 2024 & 2032
- Figure 47: South America Hydropower Generation Market Revenue (Million), by Size 2024 & 2032
- Figure 48: South America Hydropower Generation Market Volume (terawatt), by Size 2024 & 2032
- Figure 49: South America Hydropower Generation Market Revenue Share (%), by Size 2024 & 2032
- Figure 50: South America Hydropower Generation Market Volume Share (%), by Size 2024 & 2032
- Figure 51: South America Hydropower Generation Market Revenue (Million), by Country 2024 & 2032
- Figure 52: South America Hydropower Generation Market Volume (terawatt), by Country 2024 & 2032
- Figure 53: South America Hydropower Generation Market Revenue Share (%), by Country 2024 & 2032
- Figure 54: South America Hydropower Generation Market Volume Share (%), by Country 2024 & 2032
- Figure 55: Middle East and Africa Hydropower Generation Market Revenue (Million), by Size 2024 & 2032
- Figure 56: Middle East and Africa Hydropower Generation Market Volume (terawatt), by Size 2024 & 2032
- Figure 57: Middle East and Africa Hydropower Generation Market Revenue Share (%), by Size 2024 & 2032
- Figure 58: Middle East and Africa Hydropower Generation Market Volume Share (%), by Size 2024 & 2032
- Figure 59: Middle East and Africa Hydropower Generation Market Revenue (Million), by Country 2024 & 2032
- Figure 60: Middle East and Africa Hydropower Generation Market Volume (terawatt), by Country 2024 & 2032
- Figure 61: Middle East and Africa Hydropower Generation Market Revenue Share (%), by Country 2024 & 2032
- Figure 62: Middle East and Africa Hydropower Generation Market Volume Share (%), by Country 2024 & 2032
List of Tables
- Table 1: Global Hydropower Generation Market Revenue Million Forecast, by Region 2019 & 2032
- Table 2: Global Hydropower Generation Market Volume terawatt Forecast, by Region 2019 & 2032
- Table 3: Global Hydropower Generation Market Revenue Million Forecast, by Size 2019 & 2032
- Table 4: Global Hydropower Generation Market Volume terawatt Forecast, by Size 2019 & 2032
- Table 5: Global Hydropower Generation Market Revenue Million Forecast, by Region 2019 & 2032
- Table 6: Global Hydropower Generation Market Volume terawatt Forecast, by Region 2019 & 2032
- Table 7: Global Hydropower Generation Market Revenue Million Forecast, by Country 2019 & 2032
- Table 8: Global Hydropower Generation Market Volume terawatt Forecast, by Country 2019 & 2032
- Table 9: United States Hydropower Generation Market Revenue (Million) Forecast, by Application 2019 & 2032
- Table 10: United States Hydropower Generation Market Volume (terawatt) Forecast, by Application 2019 & 2032
- Table 11: Canada Hydropower Generation Market Revenue (Million) Forecast, by Application 2019 & 2032
- Table 12: Canada Hydropower Generation Market Volume (terawatt) Forecast, by Application 2019 & 2032
- Table 13: Rest of North America Hydropower Generation Market Revenue (Million) Forecast, by Application 2019 & 2032
- Table 14: Rest of North America Hydropower Generation Market Volume (terawatt) Forecast, by Application 2019 & 2032
- Table 15: Global Hydropower Generation Market Revenue Million Forecast, by Country 2019 & 2032
- Table 16: Global Hydropower Generation Market Volume terawatt Forecast, by Country 2019 & 2032
- Table 17: Germany Hydropower Generation Market Revenue (Million) Forecast, by Application 2019 & 2032
- Table 18: Germany Hydropower Generation Market Volume (terawatt) Forecast, by Application 2019 & 2032
- Table 19: France Hydropower Generation Market Revenue (Million) Forecast, by Application 2019 & 2032
- Table 20: France Hydropower Generation Market Volume (terawatt) Forecast, by Application 2019 & 2032
- Table 21: United Kingdom Hydropower Generation Market Revenue (Million) Forecast, by Application 2019 & 2032
- Table 22: United Kingdom Hydropower Generation Market Volume (terawatt) Forecast, by Application 2019 & 2032
- Table 23: Rest of Europe Hydropower Generation Market Revenue (Million) Forecast, by Application 2019 & 2032
- Table 24: Rest of Europe Hydropower Generation Market Volume (terawatt) Forecast, by Application 2019 & 2032
- Table 25: Global Hydropower Generation Market Revenue Million Forecast, by Country 2019 & 2032
- Table 26: Global Hydropower Generation Market Volume terawatt Forecast, by Country 2019 & 2032
- Table 27: China Hydropower Generation Market Revenue (Million) Forecast, by Application 2019 & 2032
- Table 28: China Hydropower Generation Market Volume (terawatt) Forecast, by Application 2019 & 2032
- Table 29: India Hydropower Generation Market Revenue (Million) Forecast, by Application 2019 & 2032
- Table 30: India Hydropower Generation Market Volume (terawatt) Forecast, by Application 2019 & 2032
- Table 31: Japan Hydropower Generation Market Revenue (Million) Forecast, by Application 2019 & 2032
- Table 32: Japan Hydropower Generation Market Volume (terawatt) Forecast, by Application 2019 & 2032
- Table 33: South Korea Hydropower Generation Market Revenue (Million) Forecast, by Application 2019 & 2032
- Table 34: South Korea Hydropower Generation Market Volume (terawatt) Forecast, by Application 2019 & 2032
- Table 35: Rest of Asia Pacific Hydropower Generation Market Revenue (Million) Forecast, by Application 2019 & 2032
- Table 36: Rest of Asia Pacific Hydropower Generation Market Volume (terawatt) Forecast, by Application 2019 & 2032
- Table 37: Global Hydropower Generation Market Revenue Million Forecast, by Country 2019 & 2032
- Table 38: Global Hydropower Generation Market Volume terawatt Forecast, by Country 2019 & 2032
- Table 39: Brazil Hydropower Generation Market Revenue (Million) Forecast, by Application 2019 & 2032
- Table 40: Brazil Hydropower Generation Market Volume (terawatt) Forecast, by Application 2019 & 2032
- Table 41: Argentina Hydropower Generation Market Revenue (Million) Forecast, by Application 2019 & 2032
- Table 42: Argentina Hydropower Generation Market Volume (terawatt) Forecast, by Application 2019 & 2032
- Table 43: Rest of South America Hydropower Generation Market Revenue (Million) Forecast, by Application 2019 & 2032
- Table 44: Rest of South America Hydropower Generation Market Volume (terawatt) Forecast, by Application 2019 & 2032
- Table 45: Global Hydropower Generation Market Revenue Million Forecast, by Country 2019 & 2032
- Table 46: Global Hydropower Generation Market Volume terawatt Forecast, by Country 2019 & 2032
- Table 47: Saudi Arabia Hydropower Generation Market Revenue (Million) Forecast, by Application 2019 & 2032
- Table 48: Saudi Arabia Hydropower Generation Market Volume (terawatt) Forecast, by Application 2019 & 2032
- Table 49: United Arab Emirates Hydropower Generation Market Revenue (Million) Forecast, by Application 2019 & 2032
- Table 50: United Arab Emirates Hydropower Generation Market Volume (terawatt) Forecast, by Application 2019 & 2032
- Table 51: South Africa Hydropower Generation Market Revenue (Million) Forecast, by Application 2019 & 2032
- Table 52: South Africa Hydropower Generation Market Volume (terawatt) Forecast, by Application 2019 & 2032
- Table 53: Rest of Middle East and Africa Hydropower Generation Market Revenue (Million) Forecast, by Application 2019 & 2032
- Table 54: Rest of Middle East and Africa Hydropower Generation Market Volume (terawatt) Forecast, by Application 2019 & 2032
- Table 55: Global Hydropower Generation Market Revenue Million Forecast, by Size 2019 & 2032
- Table 56: Global Hydropower Generation Market Volume terawatt Forecast, by Size 2019 & 2032
- Table 57: Global Hydropower Generation Market Revenue Million Forecast, by Country 2019 & 2032
- Table 58: Global Hydropower Generation Market Volume terawatt Forecast, by Country 2019 & 2032
- Table 59: United States Hydropower Generation Market Revenue (Million) Forecast, by Application 2019 & 2032
- Table 60: United States Hydropower Generation Market Volume (terawatt) Forecast, by Application 2019 & 2032
- Table 61: Canada Hydropower Generation Market Revenue (Million) Forecast, by Application 2019 & 2032
- Table 62: Canada Hydropower Generation Market Volume (terawatt) Forecast, by Application 2019 & 2032
- Table 63: Rest of North America Hydropower Generation Market Revenue (Million) Forecast, by Application 2019 & 2032
- Table 64: Rest of North America Hydropower Generation Market Volume (terawatt) Forecast, by Application 2019 & 2032
- Table 65: Global Hydropower Generation Market Revenue Million Forecast, by Size 2019 & 2032
- Table 66: Global Hydropower Generation Market Volume terawatt Forecast, by Size 2019 & 2032
- Table 67: Global Hydropower Generation Market Revenue Million Forecast, by Country 2019 & 2032
- Table 68: Global Hydropower Generation Market Volume terawatt Forecast, by Country 2019 & 2032
- Table 69: Germany Hydropower Generation Market Revenue (Million) Forecast, by Application 2019 & 2032
- Table 70: Germany Hydropower Generation Market Volume (terawatt) Forecast, by Application 2019 & 2032
- Table 71: France Hydropower Generation Market Revenue (Million) Forecast, by Application 2019 & 2032
- Table 72: France Hydropower Generation Market Volume (terawatt) Forecast, by Application 2019 & 2032
- Table 73: United Kingdom Hydropower Generation Market Revenue (Million) Forecast, by Application 2019 & 2032
- Table 74: United Kingdom Hydropower Generation Market Volume (terawatt) Forecast, by Application 2019 & 2032
- Table 75: Rest of Europe Hydropower Generation Market Revenue (Million) Forecast, by Application 2019 & 2032
- Table 76: Rest of Europe Hydropower Generation Market Volume (terawatt) Forecast, by Application 2019 & 2032
- Table 77: Global Hydropower Generation Market Revenue Million Forecast, by Size 2019 & 2032
- Table 78: Global Hydropower Generation Market Volume terawatt Forecast, by Size 2019 & 2032
- Table 79: Global Hydropower Generation Market Revenue Million Forecast, by Country 2019 & 2032
- Table 80: Global Hydropower Generation Market Volume terawatt Forecast, by Country 2019 & 2032
- Table 81: China Hydropower Generation Market Revenue (Million) Forecast, by Application 2019 & 2032
- Table 82: China Hydropower Generation Market Volume (terawatt) Forecast, by Application 2019 & 2032
- Table 83: India Hydropower Generation Market Revenue (Million) Forecast, by Application 2019 & 2032
- Table 84: India Hydropower Generation Market Volume (terawatt) Forecast, by Application 2019 & 2032
- Table 85: Japan Hydropower Generation Market Revenue (Million) Forecast, by Application 2019 & 2032
- Table 86: Japan Hydropower Generation Market Volume (terawatt) Forecast, by Application 2019 & 2032
- Table 87: South Korea Hydropower Generation Market Revenue (Million) Forecast, by Application 2019 & 2032
- Table 88: South Korea Hydropower Generation Market Volume (terawatt) Forecast, by Application 2019 & 2032
- Table 89: Rest of Asia Pacific Hydropower Generation Market Revenue (Million) Forecast, by Application 2019 & 2032
- Table 90: Rest of Asia Pacific Hydropower Generation Market Volume (terawatt) Forecast, by Application 2019 & 2032
- Table 91: Global Hydropower Generation Market Revenue Million Forecast, by Size 2019 & 2032
- Table 92: Global Hydropower Generation Market Volume terawatt Forecast, by Size 2019 & 2032
- Table 93: Global Hydropower Generation Market Revenue Million Forecast, by Country 2019 & 2032
- Table 94: Global Hydropower Generation Market Volume terawatt Forecast, by Country 2019 & 2032
- Table 95: Brazil Hydropower Generation Market Revenue (Million) Forecast, by Application 2019 & 2032
- Table 96: Brazil Hydropower Generation Market Volume (terawatt) Forecast, by Application 2019 & 2032
- Table 97: Argentina Hydropower Generation Market Revenue (Million) Forecast, by Application 2019 & 2032
- Table 98: Argentina Hydropower Generation Market Volume (terawatt) Forecast, by Application 2019 & 2032
- Table 99: Rest of South America Hydropower Generation Market Revenue (Million) Forecast, by Application 2019 & 2032
- Table 100: Rest of South America Hydropower Generation Market Volume (terawatt) Forecast, by Application 2019 & 2032
- Table 101: Global Hydropower Generation Market Revenue Million Forecast, by Size 2019 & 2032
- Table 102: Global Hydropower Generation Market Volume terawatt Forecast, by Size 2019 & 2032
- Table 103: Global Hydropower Generation Market Revenue Million Forecast, by Country 2019 & 2032
- Table 104: Global Hydropower Generation Market Volume terawatt Forecast, by Country 2019 & 2032
- Table 105: Saudi Arabia Hydropower Generation Market Revenue (Million) Forecast, by Application 2019 & 2032
- Table 106: Saudi Arabia Hydropower Generation Market Volume (terawatt) Forecast, by Application 2019 & 2032
- Table 107: United Arab Emirates Hydropower Generation Market Revenue (Million) Forecast, by Application 2019 & 2032
- Table 108: United Arab Emirates Hydropower Generation Market Volume (terawatt) Forecast, by Application 2019 & 2032
- Table 109: South Africa Hydropower Generation Market Revenue (Million) Forecast, by Application 2019 & 2032
- Table 110: South Africa Hydropower Generation Market Volume (terawatt) Forecast, by Application 2019 & 2032
- Table 111: Rest of Middle East and Africa Hydropower Generation Market Revenue (Million) Forecast, by Application 2019 & 2032
- Table 112: Rest of Middle East and Africa Hydropower Generation Market Volume (terawatt) Forecast, by Application 2019 & 2032
Frequently Asked Questions
1. What is the projected Compound Annual Growth Rate (CAGR) of the Hydropower Generation Market?
The projected CAGR is approximately 1.02%.
2. Which companies are prominent players in the Hydropower Generation Market?
Key companies in the market include Iberdrola SA*List Not Exhaustive 6 4 Market Ranking/Share Analysi, China Yangtze Power Co Ltd, Voith GmbH & Co KGaA, PJSC RusHydro, Siemens Energy AG, GE Renewable Energy, Andritz AG, Électricité de France SA (EDF).
3. What are the main segments of the Hydropower Generation Market?
The market segments include Size.
4. Can you provide details about the market size?
The market size is estimated to be USD XX Million as of 2022.
5. What are some drivers contributing to market growth?
4.; Rising Demand for Reliable Electricity4.; Increasing Government Support for Hydropower Gneeration.
6. What are the notable trends driving market growth?
The Large Hydropower (Greater Than 100 MW) Segment to Dominate the Market.
7. Are there any restraints impacting market growth?
4.; Negative Environmental Consequences of Hydropower Projects.
8. Can you provide examples of recent developments in the market?
May 2023: Satluj Jal Vidyut Nigam (SJVN) of India has been granted permission by Nepal to develop a second hydropower project in the country. Currently, the firm is developing a 900-MW Arun-III hydroelectric project located on the Arun River in Eastern Nepal. This project is scheduled to be completed in 2024. Investment Board Nepal (IBN) has approved to build of the 669 MW Lower Arun hydropower project in eastern Nepal.
9. What pricing options are available for accessing the report?
Pricing options include single-user, multi-user, and enterprise licenses priced at USD 4750, USD 5250, and USD 8750 respectively.
10. Is the market size provided in terms of value or volume?
The market size is provided in terms of value, measured in Million and volume, measured in terawatt.
11. Are there any specific market keywords associated with the report?
Yes, the market keyword associated with the report is "Hydropower Generation Market," which aids in identifying and referencing the specific market segment covered.
12. How do I determine which pricing option suits my needs best?
The pricing options vary based on user requirements and access needs. Individual users may opt for single-user licenses, while businesses requiring broader access may choose multi-user or enterprise licenses for cost-effective access to the report.
13. Are there any additional resources or data provided in the Hydropower Generation Market report?
While the report offers comprehensive insights, it's advisable to review the specific contents or supplementary materials provided to ascertain if additional resources or data are available.
14. How can I stay updated on further developments or reports in the Hydropower Generation Market?
To stay informed about further developments, trends, and reports in the Hydropower Generation Market, consider subscribing to industry newsletters, following relevant companies and organizations, or regularly checking reputable industry news sources and publications.
Methodology
Step 1 - Identification of Relevant Samples Size from Population Database


Step 2 - Approaches for Defining Global Market Size (Value, Volume* & Price*)

Note*: In applicable scenarios
Step 3 - Data Sources
Primary Research
- Web Analytics
- Survey Reports
- Research Institute
- Latest Research Reports
- Opinion Leaders
Secondary Research
- Annual Reports
- White Paper
- Latest Press Release
- Industry Association
- Paid Database
- Investor Presentations

Step 4 - Data Triangulation
Involves using different sources of information in order to increase the validity of a study
These sources are likely to be stakeholders in a program - participants, other researchers, program staff, other community members, and so on.
Then we put all data in single framework & apply various statistical tools to find out the dynamic on the market.
During the analysis stage, feedback from the stakeholder groups would be compared to determine areas of agreement as well as areas of divergence
