

Key Insights
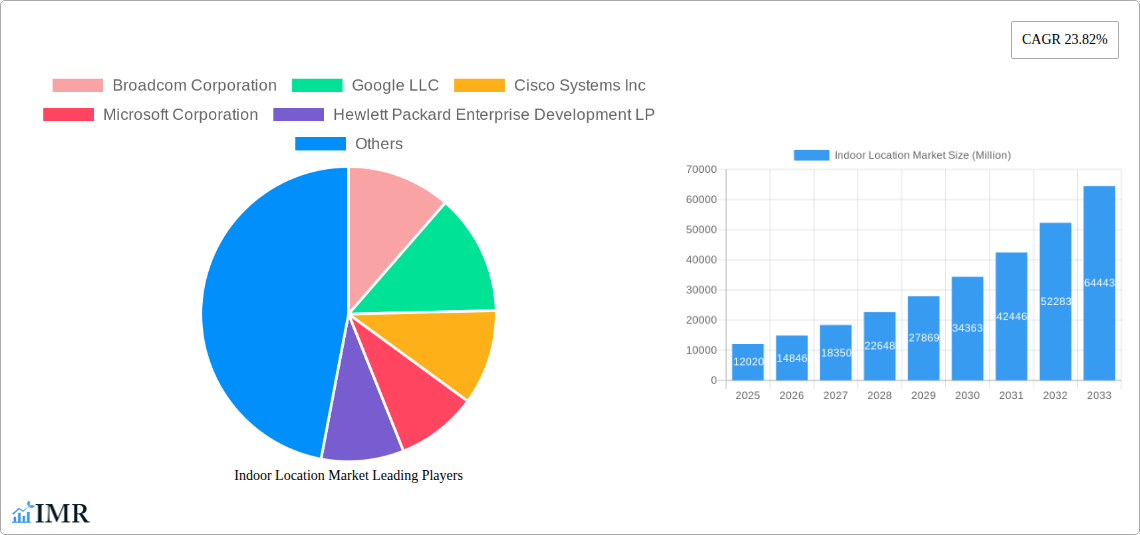
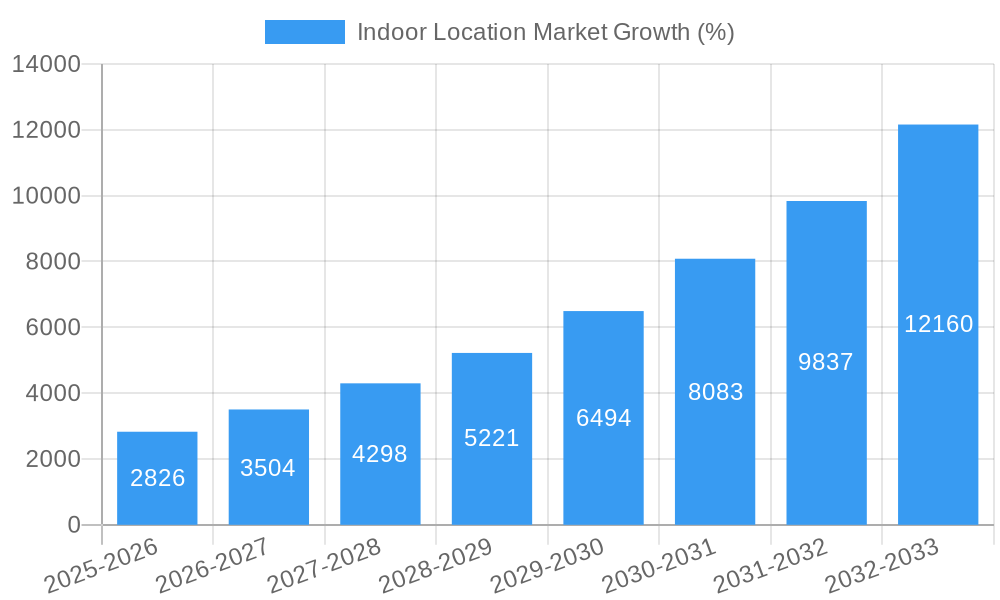
The indoor location market, valued at $12.02 billion in 2025, is experiencing robust growth, projected to expand at a compound annual growth rate (CAGR) of 23.82% from 2025 to 2033. This significant expansion is driven by several key factors. The increasing adoption of smart devices and the Internet of Things (IoT) fuels the demand for accurate and reliable indoor positioning systems across various sectors. Furthermore, the rising need for enhanced security and safety measures, particularly in retail environments and healthcare facilities, is significantly boosting market growth. The integration of indoor location technology with analytics provides valuable insights into customer behavior, operational efficiency, and asset tracking, leading to improved decision-making and resource optimization. Growth is further fueled by advancements in technologies like Bluetooth Low Energy (BLE) beacons, Ultra-Wideband (UWB), and Wi-Fi positioning, offering enhanced accuracy and cost-effectiveness. The expanding applications in diverse sectors like retail (analyzing customer flow), healthcare (asset tracking and patient monitoring), logistics (optimizing warehouse operations), and manufacturing (improving supply chain efficiency) are further accelerating market expansion. Competitive advancements and technological innovations contribute significantly to the overall market growth.
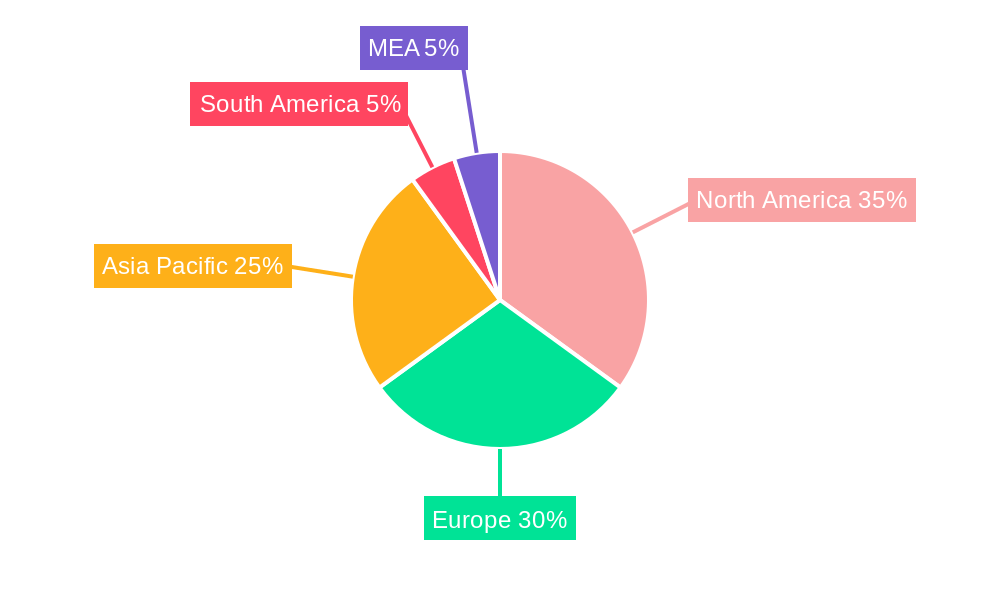
Market segmentation reveals a dynamic landscape. The solutions segment (hardware, software) likely holds a larger market share compared to services (integration, maintenance), reflecting the initial investment required for implementing indoor location systems. Among applications, indoor navigation and maps dominate, followed by tracking and tracing applications. Retail, transportation and logistics, and healthcare are major end-user industries driving demand, reflecting their need for optimized operations and enhanced customer/patient experiences. Geographically, North America and Europe currently hold substantial market shares, driven by early adoption and technological advancements. However, the Asia-Pacific region is poised for significant growth due to rapid urbanization and technological advancements. The market's growth trajectory is expected to remain strong throughout the forecast period, spurred by continuous technological innovations and expanding application across diverse industries. Challenges such as the high cost of implementation in some sectors and data privacy concerns need addressing for the market to realize its full potential.
Indoor Location Market Report: 2019-2033
This comprehensive report provides an in-depth analysis of the Indoor Location Market, encompassing market dynamics, growth trends, regional dominance, product landscape, key players, and future outlook. The study period covers 2019-2033, with 2025 as the base and estimated year. This report is crucial for businesses seeking to understand and capitalize on the burgeoning opportunities within this dynamic sector. The parent market is the broader Location Services Market, while the child market includes specific applications such as indoor navigation and asset tracking.
Indoor Location Market Dynamics & Structure
The Indoor Location Market is experiencing robust growth driven by technological advancements, increasing demand across diverse end-user industries, and supportive regulatory frameworks. Market concentration is moderate, with several key players vying for dominance. Technological innovations like AI-powered solutions and improved sensor technologies are key drivers. However, challenges such as interoperability issues and data privacy concerns persist. M&A activity is also contributing to market consolidation, with xx deals recorded in the historical period (2019-2024). The market size in 2025 is estimated at xx Million units.
- Market Concentration: Moderately concentrated, with top 5 players holding approximately xx% market share in 2025.
- Technological Innovation: Significant advancements in Wi-Fi, Bluetooth, Ultra-Wideband (UWB), and Computer Vision technologies are driving market expansion.
- Regulatory Landscape: Regulations related to data privacy and security are shaping market dynamics, influencing the adoption of secure indoor location solutions.
- Competitive Substitutes: GPS-based outdoor location services present some level of substitution, but indoor solutions offer unique functionalities for specific applications.
- End-User Demographics: Growth is driven by a diverse range of end-users, including retail, healthcare, transportation, and manufacturing sectors.
- M&A Trends: Consolidation is occurring through strategic acquisitions and partnerships aimed at expanding product portfolios and market reach.
Indoor Location Market Growth Trends & Insights
The Indoor Location Market exhibits a strong growth trajectory, with a Compound Annual Growth Rate (CAGR) of xx% projected from 2025 to 2033. Market size is expected to reach xx Million units by 2033. This growth is fueled by increasing adoption across various applications, particularly in retail (for enhanced customer experience) and healthcare (for improved patient monitoring and asset tracking). Technological disruptions, such as the integration of AI and IoT, are further accelerating market expansion. Consumer behavior is shifting towards expecting location-based services both indoors and outdoors, driving demand. Market penetration is currently at xx% and is projected to reach xx% by 2033. Specific applications such as indoor navigation and tracking & tracing are witnessing rapid adoption rates.
Dominant Regions, Countries, or Segments in Indoor Location Market
North America currently holds the largest market share, driven by early adoption of advanced technologies and a robust technological infrastructure. However, Asia-Pacific is expected to exhibit the highest growth rate during the forecast period due to increasing investments in smart cities and rising demand from various industries. Within market segments, "Solutions" accounts for the largest share of the By Component segment and "Indoor Navigation & Maps" dominates the By Application segment, primarily due to its wide applicability across diverse sectors. The Retail sector is the leading end-user industry, driven by the increasing need to enhance customer experience and improve operational efficiency.
- Key Drivers: Strong technological infrastructure, high adoption rates in specific sectors (e.g., retail in North America), supportive government policies promoting smart city development (e.g., Asia-Pacific).
- Dominance Factors: Early adoption of technologies in developed regions, rapid urbanization and economic growth in developing regions, high demand across specific industries (retail, healthcare).
Indoor Location Market Product Landscape
The Indoor Location Market offers a diverse range of products, including solutions based on Wi-Fi, Bluetooth, UWB, and Computer Vision technologies. These solutions offer varying levels of accuracy, range, and power consumption. Recent innovations focus on enhancing accuracy, improving integration with existing systems, and developing more energy-efficient solutions. Unique selling propositions (USPs) include high precision location tracking, seamless indoor-outdoor integration, and robust security features. The market is witnessing a steady improvement in product performance metrics, including accuracy, latency, and power efficiency.
Key Drivers, Barriers & Challenges in Indoor Location Market
Key Drivers:
- Technological advancements in sensing technologies and AI/ML algorithms.
- Growing demand for improved operational efficiency and enhanced customer experience across multiple industries.
- Increasing investments in smart cities and infrastructure development.
Challenges and Restraints:
- Interoperability issues between different indoor location systems.
- Concerns about data privacy and security.
- High implementation costs, particularly for complex deployments.
- The potential for interference from other wireless signals, impacting the accuracy of location data.
Emerging Opportunities in Indoor Location Market
- Expansion into untapped markets, particularly in developing economies.
- Development of innovative applications, such as augmented reality (AR) and virtual reality (VR) experiences.
- Integration of indoor location technologies with other IoT devices and services to create comprehensive location-aware solutions.
- Growing demand for hyper-accurate indoor positioning systems, particularly for specific applications such as warehouse management and healthcare.
Growth Accelerators in the Indoor Location Market Industry
Technological breakthroughs, such as the development of more accurate and energy-efficient sensors, are driving long-term growth. Strategic partnerships between technology providers and industry players are also accelerating market expansion by fostering innovation and increasing market reach. The expansion into new market segments and applications, such as the integration with wearable technology and the development of location-based gaming and entertainment applications, promises significant growth potential.
Key Players Shaping the Indoor Location Market Market
- Broadcom Corporation
- Google LLC
- Cisco Systems Inc
- Microsoft Corporation
- Hewlett Packard Enterprise Development LP
- Inpixon
- HID Global Corporation
- Sonitor Technologies AS
- Acuity Brands Inc
- AiRISTA
- Mist Systems Inc
- Zebra Technologies Corporation
- Ubisense Limited
- CenTrak
- HERE Global BV
- Tack On
Notable Milestones in Indoor Location Market Sector
- October 2023: Sensative and Combain announced a strategic collaboration to create AI-powered seamless indoor/outdoor location solutions.
- March 2024: GeoComm and ELi Technology partnered to enhance school safety with the ATLS Location Service, leveraging Wi-Fi for accurate indoor mapping.
In-Depth Indoor Location Market Market Outlook
The Indoor Location Market is poised for significant growth driven by the continued adoption of advanced technologies and increasing demand from diverse industries. Strategic partnerships, technological breakthroughs, and expansion into new markets present substantial opportunities for market players. The focus on improving accuracy, reliability, and security of indoor location systems will remain a key driver of future market growth, creating exciting potential for innovation and market expansion.
Indoor Location Market Segmentation
-
1. Component
- 1.1. Solutions
- 1.2. Services
-
2. Application
- 2.1. Indoor Navigation & Maps
- 2.2. Tracking and Tracing Application
- 2.3. Remote Monitoring and Emergency Management
- 2.4. Other Applications
-
3. End-user Industry
- 3.1. Retail
- 3.2. Transportation and Logistics
- 3.3. Healthcare
- 3.4. Telecom
- 3.5. Oil and Gas and Mining
- 3.6. Government and Public Sector
- 3.7. Manufacturing
- 3.8. Other End-user Industries
Indoor Location Market Segmentation By Geography
- 1. North America
- 2. Europe
- 3. Asia
- 4. Australia and New Zealand
- 5. Latin America
- 6. Middle East and Africa
Indoor Location Market REPORT HIGHLIGHTS
| Aspects | Details |
|---|---|
| Study Period | 2019-2033 |
| Base Year | 2024 |
| Estimated Year | 2025 |
| Forecast Period | 2025-2033 |
| Historical Period | 2019-2024 |
| Growth Rate | CAGR of 23.82% from 2019-2033 |
| Segmentation |
|
Table of Contents
- 1. Introduction
- 1.1. Research Scope
- 1.2. Market Segmentation
- 1.3. Research Methodology
- 1.4. Definitions and Assumptions
- 2. Executive Summary
- 2.1. Introduction
- 3. Market Dynamics
- 3.1. Introduction
- 3.2. Market Drivers
- 3.2.1 Growing Number of Applications Powered by Beacons and BLE Tags; Inefficiency of the GPS Technology in Indoor Premises; Growth of Connected Devices
- 3.2.2 Smartphones
- 3.2.3 and Location-based Applications
- 3.3. Market Restrains
- 3.3.1. Data and security related Issues; Deployment and Maintenance Challenges; Strict Rules and Regulations by Government
- 3.4. Market Trends
- 3.4.1. Transportation and Logistics Vertical to Hold a Dominant Market Share
- 4. Market Factor Analysis
- 4.1. Porters Five Forces
- 4.2. Supply/Value Chain
- 4.3. PESTEL analysis
- 4.4. Market Entropy
- 4.5. Patent/Trademark Analysis
- 5. Global Indoor Location Market Analysis, Insights and Forecast, 2019-2031
- 5.1. Market Analysis, Insights and Forecast - by Component
- 5.1.1. Solutions
- 5.1.2. Services
- 5.2. Market Analysis, Insights and Forecast - by Application
- 5.2.1. Indoor Navigation & Maps
- 5.2.2. Tracking and Tracing Application
- 5.2.3. Remote Monitoring and Emergency Management
- 5.2.4. Other Applications
- 5.3. Market Analysis, Insights and Forecast - by End-user Industry
- 5.3.1. Retail
- 5.3.2. Transportation and Logistics
- 5.3.3. Healthcare
- 5.3.4. Telecom
- 5.3.5. Oil and Gas and Mining
- 5.3.6. Government and Public Sector
- 5.3.7. Manufacturing
- 5.3.8. Other End-user Industries
- 5.4. Market Analysis, Insights and Forecast - by Region
- 5.4.1. North America
- 5.4.2. Europe
- 5.4.3. Asia
- 5.4.4. Australia and New Zealand
- 5.4.5. Latin America
- 5.4.6. Middle East and Africa
- 5.1. Market Analysis, Insights and Forecast - by Component
- 6. North America Indoor Location Market Analysis, Insights and Forecast, 2019-2031
- 6.1. Market Analysis, Insights and Forecast - by Component
- 6.1.1. Solutions
- 6.1.2. Services
- 6.2. Market Analysis, Insights and Forecast - by Application
- 6.2.1. Indoor Navigation & Maps
- 6.2.2. Tracking and Tracing Application
- 6.2.3. Remote Monitoring and Emergency Management
- 6.2.4. Other Applications
- 6.3. Market Analysis, Insights and Forecast - by End-user Industry
- 6.3.1. Retail
- 6.3.2. Transportation and Logistics
- 6.3.3. Healthcare
- 6.3.4. Telecom
- 6.3.5. Oil and Gas and Mining
- 6.3.6. Government and Public Sector
- 6.3.7. Manufacturing
- 6.3.8. Other End-user Industries
- 6.1. Market Analysis, Insights and Forecast - by Component
- 7. Europe Indoor Location Market Analysis, Insights and Forecast, 2019-2031
- 7.1. Market Analysis, Insights and Forecast - by Component
- 7.1.1. Solutions
- 7.1.2. Services
- 7.2. Market Analysis, Insights and Forecast - by Application
- 7.2.1. Indoor Navigation & Maps
- 7.2.2. Tracking and Tracing Application
- 7.2.3. Remote Monitoring and Emergency Management
- 7.2.4. Other Applications
- 7.3. Market Analysis, Insights and Forecast - by End-user Industry
- 7.3.1. Retail
- 7.3.2. Transportation and Logistics
- 7.3.3. Healthcare
- 7.3.4. Telecom
- 7.3.5. Oil and Gas and Mining
- 7.3.6. Government and Public Sector
- 7.3.7. Manufacturing
- 7.3.8. Other End-user Industries
- 7.1. Market Analysis, Insights and Forecast - by Component
- 8. Asia Indoor Location Market Analysis, Insights and Forecast, 2019-2031
- 8.1. Market Analysis, Insights and Forecast - by Component
- 8.1.1. Solutions
- 8.1.2. Services
- 8.2. Market Analysis, Insights and Forecast - by Application
- 8.2.1. Indoor Navigation & Maps
- 8.2.2. Tracking and Tracing Application
- 8.2.3. Remote Monitoring and Emergency Management
- 8.2.4. Other Applications
- 8.3. Market Analysis, Insights and Forecast - by End-user Industry
- 8.3.1. Retail
- 8.3.2. Transportation and Logistics
- 8.3.3. Healthcare
- 8.3.4. Telecom
- 8.3.5. Oil and Gas and Mining
- 8.3.6. Government and Public Sector
- 8.3.7. Manufacturing
- 8.3.8. Other End-user Industries
- 8.1. Market Analysis, Insights and Forecast - by Component
- 9. Australia and New Zealand Indoor Location Market Analysis, Insights and Forecast, 2019-2031
- 9.1. Market Analysis, Insights and Forecast - by Component
- 9.1.1. Solutions
- 9.1.2. Services
- 9.2. Market Analysis, Insights and Forecast - by Application
- 9.2.1. Indoor Navigation & Maps
- 9.2.2. Tracking and Tracing Application
- 9.2.3. Remote Monitoring and Emergency Management
- 9.2.4. Other Applications
- 9.3. Market Analysis, Insights and Forecast - by End-user Industry
- 9.3.1. Retail
- 9.3.2. Transportation and Logistics
- 9.3.3. Healthcare
- 9.3.4. Telecom
- 9.3.5. Oil and Gas and Mining
- 9.3.6. Government and Public Sector
- 9.3.7. Manufacturing
- 9.3.8. Other End-user Industries
- 9.1. Market Analysis, Insights and Forecast - by Component
- 10. Latin America Indoor Location Market Analysis, Insights and Forecast, 2019-2031
- 10.1. Market Analysis, Insights and Forecast - by Component
- 10.1.1. Solutions
- 10.1.2. Services
- 10.2. Market Analysis, Insights and Forecast - by Application
- 10.2.1. Indoor Navigation & Maps
- 10.2.2. Tracking and Tracing Application
- 10.2.3. Remote Monitoring and Emergency Management
- 10.2.4. Other Applications
- 10.3. Market Analysis, Insights and Forecast - by End-user Industry
- 10.3.1. Retail
- 10.3.2. Transportation and Logistics
- 10.3.3. Healthcare
- 10.3.4. Telecom
- 10.3.5. Oil and Gas and Mining
- 10.3.6. Government and Public Sector
- 10.3.7. Manufacturing
- 10.3.8. Other End-user Industries
- 10.1. Market Analysis, Insights and Forecast - by Component
- 11. Middle East and Africa Indoor Location Market Analysis, Insights and Forecast, 2019-2031
- 11.1. Market Analysis, Insights and Forecast - by Component
- 11.1.1. Solutions
- 11.1.2. Services
- 11.2. Market Analysis, Insights and Forecast - by Application
- 11.2.1. Indoor Navigation & Maps
- 11.2.2. Tracking and Tracing Application
- 11.2.3. Remote Monitoring and Emergency Management
- 11.2.4. Other Applications
- 11.3. Market Analysis, Insights and Forecast - by End-user Industry
- 11.3.1. Retail
- 11.3.2. Transportation and Logistics
- 11.3.3. Healthcare
- 11.3.4. Telecom
- 11.3.5. Oil and Gas and Mining
- 11.3.6. Government and Public Sector
- 11.3.7. Manufacturing
- 11.3.8. Other End-user Industries
- 11.1. Market Analysis, Insights and Forecast - by Component
- 12. North America Indoor Location Market Analysis, Insights and Forecast, 2019-2031
- 12.1. Market Analysis, Insights and Forecast - By Country/Sub-region
- 12.1.1 United States
- 12.1.2 Canada
- 12.1.3 Mexico
- 13. Europe Indoor Location Market Analysis, Insights and Forecast, 2019-2031
- 13.1. Market Analysis, Insights and Forecast - By Country/Sub-region
- 13.1.1 Germany
- 13.1.2 United Kingdom
- 13.1.3 France
- 13.1.4 Spain
- 13.1.5 Italy
- 13.1.6 Spain
- 13.1.7 Belgium
- 13.1.8 Netherland
- 13.1.9 Nordics
- 13.1.10 Rest of Europe
- 14. Asia Pacific Indoor Location Market Analysis, Insights and Forecast, 2019-2031
- 14.1. Market Analysis, Insights and Forecast - By Country/Sub-region
- 14.1.1 China
- 14.1.2 Japan
- 14.1.3 India
- 14.1.4 South Korea
- 14.1.5 Southeast Asia
- 14.1.6 Australia
- 14.1.7 Indonesia
- 14.1.8 Phillipes
- 14.1.9 Singapore
- 14.1.10 Thailandc
- 14.1.11 Rest of Asia Pacific
- 15. South America Indoor Location Market Analysis, Insights and Forecast, 2019-2031
- 15.1. Market Analysis, Insights and Forecast - By Country/Sub-region
- 15.1.1 Brazil
- 15.1.2 Argentina
- 15.1.3 Peru
- 15.1.4 Chile
- 15.1.5 Colombia
- 15.1.6 Ecuador
- 15.1.7 Venezuela
- 15.1.8 Rest of South America
- 16. North America Indoor Location Market Analysis, Insights and Forecast, 2019-2031
- 16.1. Market Analysis, Insights and Forecast - By Country/Sub-region
- 16.1.1 United States
- 16.1.2 Canada
- 16.1.3 Mexico
- 17. MEA Indoor Location Market Analysis, Insights and Forecast, 2019-2031
- 17.1. Market Analysis, Insights and Forecast - By Country/Sub-region
- 17.1.1 United Arab Emirates
- 17.1.2 Saudi Arabia
- 17.1.3 South Africa
- 17.1.4 Rest of Middle East and Africa
- 18. Competitive Analysis
- 18.1. Global Market Share Analysis 2024
- 18.2. Company Profiles
- 18.2.1 Broadcom Corporation
- 18.2.1.1. Overview
- 18.2.1.2. Products
- 18.2.1.3. SWOT Analysis
- 18.2.1.4. Recent Developments
- 18.2.1.5. Financials (Based on Availability)
- 18.2.2 Google LLC
- 18.2.2.1. Overview
- 18.2.2.2. Products
- 18.2.2.3. SWOT Analysis
- 18.2.2.4. Recent Developments
- 18.2.2.5. Financials (Based on Availability)
- 18.2.3 Cisco Systems Inc
- 18.2.3.1. Overview
- 18.2.3.2. Products
- 18.2.3.3. SWOT Analysis
- 18.2.3.4. Recent Developments
- 18.2.3.5. Financials (Based on Availability)
- 18.2.4 Microsoft Corporation
- 18.2.4.1. Overview
- 18.2.4.2. Products
- 18.2.4.3. SWOT Analysis
- 18.2.4.4. Recent Developments
- 18.2.4.5. Financials (Based on Availability)
- 18.2.5 Hewlett Packard Enterprise Development LP
- 18.2.5.1. Overview
- 18.2.5.2. Products
- 18.2.5.3. SWOT Analysis
- 18.2.5.4. Recent Developments
- 18.2.5.5. Financials (Based on Availability)
- 18.2.6 Inpixon
- 18.2.6.1. Overview
- 18.2.6.2. Products
- 18.2.6.3. SWOT Analysis
- 18.2.6.4. Recent Developments
- 18.2.6.5. Financials (Based on Availability)
- 18.2.7 HID Global Corporation
- 18.2.7.1. Overview
- 18.2.7.2. Products
- 18.2.7.3. SWOT Analysis
- 18.2.7.4. Recent Developments
- 18.2.7.5. Financials (Based on Availability)
- 18.2.8 Sonitor Technologies AS
- 18.2.8.1. Overview
- 18.2.8.2. Products
- 18.2.8.3. SWOT Analysis
- 18.2.8.4. Recent Developments
- 18.2.8.5. Financials (Based on Availability)
- 18.2.9 Acuity Brands Inc
- 18.2.9.1. Overview
- 18.2.9.2. Products
- 18.2.9.3. SWOT Analysis
- 18.2.9.4. Recent Developments
- 18.2.9.5. Financials (Based on Availability)
- 18.2.10 AiRISTA
- 18.2.10.1. Overview
- 18.2.10.2. Products
- 18.2.10.3. SWOT Analysis
- 18.2.10.4. Recent Developments
- 18.2.10.5. Financials (Based on Availability)
- 18.2.11 Mist Systems Inc
- 18.2.11.1. Overview
- 18.2.11.2. Products
- 18.2.11.3. SWOT Analysis
- 18.2.11.4. Recent Developments
- 18.2.11.5. Financials (Based on Availability)
- 18.2.12 Zebra Technologies Corporation
- 18.2.12.1. Overview
- 18.2.12.2. Products
- 18.2.12.3. SWOT Analysis
- 18.2.12.4. Recent Developments
- 18.2.12.5. Financials (Based on Availability)
- 18.2.13 Ubisense Limited
- 18.2.13.1. Overview
- 18.2.13.2. Products
- 18.2.13.3. SWOT Analysis
- 18.2.13.4. Recent Developments
- 18.2.13.5. Financials (Based on Availability)
- 18.2.14 CenTrak
- 18.2.14.1. Overview
- 18.2.14.2. Products
- 18.2.14.3. SWOT Analysis
- 18.2.14.4. Recent Developments
- 18.2.14.5. Financials (Based on Availability)
- 18.2.15 HERE Global BV
- 18.2.15.1. Overview
- 18.2.15.2. Products
- 18.2.15.3. SWOT Analysis
- 18.2.15.4. Recent Developments
- 18.2.15.5. Financials (Based on Availability)
- 18.2.16 Tack On
- 18.2.16.1. Overview
- 18.2.16.2. Products
- 18.2.16.3. SWOT Analysis
- 18.2.16.4. Recent Developments
- 18.2.16.5. Financials (Based on Availability)
- 18.2.1 Broadcom Corporation
List of Figures
- Figure 1: Global Indoor Location Market Revenue Breakdown (Million, %) by Region 2024 & 2032
- Figure 2: North America Indoor Location Market Revenue (Million), by Country 2024 & 2032
- Figure 3: North America Indoor Location Market Revenue Share (%), by Country 2024 & 2032
- Figure 4: Europe Indoor Location Market Revenue (Million), by Country 2024 & 2032
- Figure 5: Europe Indoor Location Market Revenue Share (%), by Country 2024 & 2032
- Figure 6: Asia Pacific Indoor Location Market Revenue (Million), by Country 2024 & 2032
- Figure 7: Asia Pacific Indoor Location Market Revenue Share (%), by Country 2024 & 2032
- Figure 8: South America Indoor Location Market Revenue (Million), by Country 2024 & 2032
- Figure 9: South America Indoor Location Market Revenue Share (%), by Country 2024 & 2032
- Figure 10: North America Indoor Location Market Revenue (Million), by Country 2024 & 2032
- Figure 11: North America Indoor Location Market Revenue Share (%), by Country 2024 & 2032
- Figure 12: MEA Indoor Location Market Revenue (Million), by Country 2024 & 2032
- Figure 13: MEA Indoor Location Market Revenue Share (%), by Country 2024 & 2032
- Figure 14: North America Indoor Location Market Revenue (Million), by Component 2024 & 2032
- Figure 15: North America Indoor Location Market Revenue Share (%), by Component 2024 & 2032
- Figure 16: North America Indoor Location Market Revenue (Million), by Application 2024 & 2032
- Figure 17: North America Indoor Location Market Revenue Share (%), by Application 2024 & 2032
- Figure 18: North America Indoor Location Market Revenue (Million), by End-user Industry 2024 & 2032
- Figure 19: North America Indoor Location Market Revenue Share (%), by End-user Industry 2024 & 2032
- Figure 20: North America Indoor Location Market Revenue (Million), by Country 2024 & 2032
- Figure 21: North America Indoor Location Market Revenue Share (%), by Country 2024 & 2032
- Figure 22: Europe Indoor Location Market Revenue (Million), by Component 2024 & 2032
- Figure 23: Europe Indoor Location Market Revenue Share (%), by Component 2024 & 2032
- Figure 24: Europe Indoor Location Market Revenue (Million), by Application 2024 & 2032
- Figure 25: Europe Indoor Location Market Revenue Share (%), by Application 2024 & 2032
- Figure 26: Europe Indoor Location Market Revenue (Million), by End-user Industry 2024 & 2032
- Figure 27: Europe Indoor Location Market Revenue Share (%), by End-user Industry 2024 & 2032
- Figure 28: Europe Indoor Location Market Revenue (Million), by Country 2024 & 2032
- Figure 29: Europe Indoor Location Market Revenue Share (%), by Country 2024 & 2032
- Figure 30: Asia Indoor Location Market Revenue (Million), by Component 2024 & 2032
- Figure 31: Asia Indoor Location Market Revenue Share (%), by Component 2024 & 2032
- Figure 32: Asia Indoor Location Market Revenue (Million), by Application 2024 & 2032
- Figure 33: Asia Indoor Location Market Revenue Share (%), by Application 2024 & 2032
- Figure 34: Asia Indoor Location Market Revenue (Million), by End-user Industry 2024 & 2032
- Figure 35: Asia Indoor Location Market Revenue Share (%), by End-user Industry 2024 & 2032
- Figure 36: Asia Indoor Location Market Revenue (Million), by Country 2024 & 2032
- Figure 37: Asia Indoor Location Market Revenue Share (%), by Country 2024 & 2032
- Figure 38: Australia and New Zealand Indoor Location Market Revenue (Million), by Component 2024 & 2032
- Figure 39: Australia and New Zealand Indoor Location Market Revenue Share (%), by Component 2024 & 2032
- Figure 40: Australia and New Zealand Indoor Location Market Revenue (Million), by Application 2024 & 2032
- Figure 41: Australia and New Zealand Indoor Location Market Revenue Share (%), by Application 2024 & 2032
- Figure 42: Australia and New Zealand Indoor Location Market Revenue (Million), by End-user Industry 2024 & 2032
- Figure 43: Australia and New Zealand Indoor Location Market Revenue Share (%), by End-user Industry 2024 & 2032
- Figure 44: Australia and New Zealand Indoor Location Market Revenue (Million), by Country 2024 & 2032
- Figure 45: Australia and New Zealand Indoor Location Market Revenue Share (%), by Country 2024 & 2032
- Figure 46: Latin America Indoor Location Market Revenue (Million), by Component 2024 & 2032
- Figure 47: Latin America Indoor Location Market Revenue Share (%), by Component 2024 & 2032
- Figure 48: Latin America Indoor Location Market Revenue (Million), by Application 2024 & 2032
- Figure 49: Latin America Indoor Location Market Revenue Share (%), by Application 2024 & 2032
- Figure 50: Latin America Indoor Location Market Revenue (Million), by End-user Industry 2024 & 2032
- Figure 51: Latin America Indoor Location Market Revenue Share (%), by End-user Industry 2024 & 2032
- Figure 52: Latin America Indoor Location Market Revenue (Million), by Country 2024 & 2032
- Figure 53: Latin America Indoor Location Market Revenue Share (%), by Country 2024 & 2032
- Figure 54: Middle East and Africa Indoor Location Market Revenue (Million), by Component 2024 & 2032
- Figure 55: Middle East and Africa Indoor Location Market Revenue Share (%), by Component 2024 & 2032
- Figure 56: Middle East and Africa Indoor Location Market Revenue (Million), by Application 2024 & 2032
- Figure 57: Middle East and Africa Indoor Location Market Revenue Share (%), by Application 2024 & 2032
- Figure 58: Middle East and Africa Indoor Location Market Revenue (Million), by End-user Industry 2024 & 2032
- Figure 59: Middle East and Africa Indoor Location Market Revenue Share (%), by End-user Industry 2024 & 2032
- Figure 60: Middle East and Africa Indoor Location Market Revenue (Million), by Country 2024 & 2032
- Figure 61: Middle East and Africa Indoor Location Market Revenue Share (%), by Country 2024 & 2032
List of Tables
- Table 1: Global Indoor Location Market Revenue Million Forecast, by Region 2019 & 2032
- Table 2: Global Indoor Location Market Revenue Million Forecast, by Component 2019 & 2032
- Table 3: Global Indoor Location Market Revenue Million Forecast, by Application 2019 & 2032
- Table 4: Global Indoor Location Market Revenue Million Forecast, by End-user Industry 2019 & 2032
- Table 5: Global Indoor Location Market Revenue Million Forecast, by Region 2019 & 2032
- Table 6: Global Indoor Location Market Revenue Million Forecast, by Country 2019 & 2032
- Table 7: United States Indoor Location Market Revenue (Million) Forecast, by Application 2019 & 2032
- Table 8: Canada Indoor Location Market Revenue (Million) Forecast, by Application 2019 & 2032
- Table 9: Mexico Indoor Location Market Revenue (Million) Forecast, by Application 2019 & 2032
- Table 10: Global Indoor Location Market Revenue Million Forecast, by Country 2019 & 2032
- Table 11: Germany Indoor Location Market Revenue (Million) Forecast, by Application 2019 & 2032
- Table 12: United Kingdom Indoor Location Market Revenue (Million) Forecast, by Application 2019 & 2032
- Table 13: France Indoor Location Market Revenue (Million) Forecast, by Application 2019 & 2032
- Table 14: Spain Indoor Location Market Revenue (Million) Forecast, by Application 2019 & 2032
- Table 15: Italy Indoor Location Market Revenue (Million) Forecast, by Application 2019 & 2032
- Table 16: Spain Indoor Location Market Revenue (Million) Forecast, by Application 2019 & 2032
- Table 17: Belgium Indoor Location Market Revenue (Million) Forecast, by Application 2019 & 2032
- Table 18: Netherland Indoor Location Market Revenue (Million) Forecast, by Application 2019 & 2032
- Table 19: Nordics Indoor Location Market Revenue (Million) Forecast, by Application 2019 & 2032
- Table 20: Rest of Europe Indoor Location Market Revenue (Million) Forecast, by Application 2019 & 2032
- Table 21: Global Indoor Location Market Revenue Million Forecast, by Country 2019 & 2032
- Table 22: China Indoor Location Market Revenue (Million) Forecast, by Application 2019 & 2032
- Table 23: Japan Indoor Location Market Revenue (Million) Forecast, by Application 2019 & 2032
- Table 24: India Indoor Location Market Revenue (Million) Forecast, by Application 2019 & 2032
- Table 25: South Korea Indoor Location Market Revenue (Million) Forecast, by Application 2019 & 2032
- Table 26: Southeast Asia Indoor Location Market Revenue (Million) Forecast, by Application 2019 & 2032
- Table 27: Australia Indoor Location Market Revenue (Million) Forecast, by Application 2019 & 2032
- Table 28: Indonesia Indoor Location Market Revenue (Million) Forecast, by Application 2019 & 2032
- Table 29: Phillipes Indoor Location Market Revenue (Million) Forecast, by Application 2019 & 2032
- Table 30: Singapore Indoor Location Market Revenue (Million) Forecast, by Application 2019 & 2032
- Table 31: Thailandc Indoor Location Market Revenue (Million) Forecast, by Application 2019 & 2032
- Table 32: Rest of Asia Pacific Indoor Location Market Revenue (Million) Forecast, by Application 2019 & 2032
- Table 33: Global Indoor Location Market Revenue Million Forecast, by Country 2019 & 2032
- Table 34: Brazil Indoor Location Market Revenue (Million) Forecast, by Application 2019 & 2032
- Table 35: Argentina Indoor Location Market Revenue (Million) Forecast, by Application 2019 & 2032
- Table 36: Peru Indoor Location Market Revenue (Million) Forecast, by Application 2019 & 2032
- Table 37: Chile Indoor Location Market Revenue (Million) Forecast, by Application 2019 & 2032
- Table 38: Colombia Indoor Location Market Revenue (Million) Forecast, by Application 2019 & 2032
- Table 39: Ecuador Indoor Location Market Revenue (Million) Forecast, by Application 2019 & 2032
- Table 40: Venezuela Indoor Location Market Revenue (Million) Forecast, by Application 2019 & 2032
- Table 41: Rest of South America Indoor Location Market Revenue (Million) Forecast, by Application 2019 & 2032
- Table 42: Global Indoor Location Market Revenue Million Forecast, by Country 2019 & 2032
- Table 43: United States Indoor Location Market Revenue (Million) Forecast, by Application 2019 & 2032
- Table 44: Canada Indoor Location Market Revenue (Million) Forecast, by Application 2019 & 2032
- Table 45: Mexico Indoor Location Market Revenue (Million) Forecast, by Application 2019 & 2032
- Table 46: Global Indoor Location Market Revenue Million Forecast, by Country 2019 & 2032
- Table 47: United Arab Emirates Indoor Location Market Revenue (Million) Forecast, by Application 2019 & 2032
- Table 48: Saudi Arabia Indoor Location Market Revenue (Million) Forecast, by Application 2019 & 2032
- Table 49: South Africa Indoor Location Market Revenue (Million) Forecast, by Application 2019 & 2032
- Table 50: Rest of Middle East and Africa Indoor Location Market Revenue (Million) Forecast, by Application 2019 & 2032
- Table 51: Global Indoor Location Market Revenue Million Forecast, by Component 2019 & 2032
- Table 52: Global Indoor Location Market Revenue Million Forecast, by Application 2019 & 2032
- Table 53: Global Indoor Location Market Revenue Million Forecast, by End-user Industry 2019 & 2032
- Table 54: Global Indoor Location Market Revenue Million Forecast, by Country 2019 & 2032
- Table 55: Global Indoor Location Market Revenue Million Forecast, by Component 2019 & 2032
- Table 56: Global Indoor Location Market Revenue Million Forecast, by Application 2019 & 2032
- Table 57: Global Indoor Location Market Revenue Million Forecast, by End-user Industry 2019 & 2032
- Table 58: Global Indoor Location Market Revenue Million Forecast, by Country 2019 & 2032
- Table 59: Global Indoor Location Market Revenue Million Forecast, by Component 2019 & 2032
- Table 60: Global Indoor Location Market Revenue Million Forecast, by Application 2019 & 2032
- Table 61: Global Indoor Location Market Revenue Million Forecast, by End-user Industry 2019 & 2032
- Table 62: Global Indoor Location Market Revenue Million Forecast, by Country 2019 & 2032
- Table 63: Global Indoor Location Market Revenue Million Forecast, by Component 2019 & 2032
- Table 64: Global Indoor Location Market Revenue Million Forecast, by Application 2019 & 2032
- Table 65: Global Indoor Location Market Revenue Million Forecast, by End-user Industry 2019 & 2032
- Table 66: Global Indoor Location Market Revenue Million Forecast, by Country 2019 & 2032
- Table 67: Global Indoor Location Market Revenue Million Forecast, by Component 2019 & 2032
- Table 68: Global Indoor Location Market Revenue Million Forecast, by Application 2019 & 2032
- Table 69: Global Indoor Location Market Revenue Million Forecast, by End-user Industry 2019 & 2032
- Table 70: Global Indoor Location Market Revenue Million Forecast, by Country 2019 & 2032
- Table 71: Global Indoor Location Market Revenue Million Forecast, by Component 2019 & 2032
- Table 72: Global Indoor Location Market Revenue Million Forecast, by Application 2019 & 2032
- Table 73: Global Indoor Location Market Revenue Million Forecast, by End-user Industry 2019 & 2032
- Table 74: Global Indoor Location Market Revenue Million Forecast, by Country 2019 & 2032
Frequently Asked Questions
1. What is the projected Compound Annual Growth Rate (CAGR) of the Indoor Location Market?
The projected CAGR is approximately 23.82%.
2. Which companies are prominent players in the Indoor Location Market?
Key companies in the market include Broadcom Corporation, Google LLC, Cisco Systems Inc, Microsoft Corporation, Hewlett Packard Enterprise Development LP, Inpixon, HID Global Corporation, Sonitor Technologies AS, Acuity Brands Inc, AiRISTA, Mist Systems Inc, Zebra Technologies Corporation, Ubisense Limited, CenTrak, HERE Global BV, Tack On.
3. What are the main segments of the Indoor Location Market?
The market segments include Component, Application, End-user Industry.
4. Can you provide details about the market size?
The market size is estimated to be USD 12.02 Million as of 2022.
5. What are some drivers contributing to market growth?
Growing Number of Applications Powered by Beacons and BLE Tags; Inefficiency of the GPS Technology in Indoor Premises; Growth of Connected Devices. Smartphones. and Location-based Applications.
6. What are the notable trends driving market growth?
Transportation and Logistics Vertical to Hold a Dominant Market Share.
7. Are there any restraints impacting market growth?
Data and security related Issues; Deployment and Maintenance Challenges; Strict Rules and Regulations by Government.
8. Can you provide examples of recent developments in the market?
March 2024: GeoComm and ELi Technology announced their partnership, which aims at enhancing school safety with the ATLS Location Service, where ATLS is an innovative, easily integrated location and mapping service, combining ELi Technology's patented EML with GeoComm's technology, enabling accurate indoor location mapping via Wi-Fi access points.
9. What pricing options are available for accessing the report?
Pricing options include single-user, multi-user, and enterprise licenses priced at USD 4750, USD 5250, and USD 8750 respectively.
10. Is the market size provided in terms of value or volume?
The market size is provided in terms of value, measured in Million.
11. Are there any specific market keywords associated with the report?
Yes, the market keyword associated with the report is "Indoor Location Market," which aids in identifying and referencing the specific market segment covered.
12. How do I determine which pricing option suits my needs best?
The pricing options vary based on user requirements and access needs. Individual users may opt for single-user licenses, while businesses requiring broader access may choose multi-user or enterprise licenses for cost-effective access to the report.
13. Are there any additional resources or data provided in the Indoor Location Market report?
While the report offers comprehensive insights, it's advisable to review the specific contents or supplementary materials provided to ascertain if additional resources or data are available.
14. How can I stay updated on further developments or reports in the Indoor Location Market?
To stay informed about further developments, trends, and reports in the Indoor Location Market, consider subscribing to industry newsletters, following relevant companies and organizations, or regularly checking reputable industry news sources and publications.
Methodology
Step 1 - Identification of Relevant Samples Size from Population Database


Step 2 - Approaches for Defining Global Market Size (Value, Volume* & Price*)

Note*: In applicable scenarios
Step 3 - Data Sources
Primary Research
- Web Analytics
- Survey Reports
- Research Institute
- Latest Research Reports
- Opinion Leaders
Secondary Research
- Annual Reports
- White Paper
- Latest Press Release
- Industry Association
- Paid Database
- Investor Presentations

Step 4 - Data Triangulation
Involves using different sources of information in order to increase the validity of a study
These sources are likely to be stakeholders in a program - participants, other researchers, program staff, other community members, and so on.
Then we put all data in single framework & apply various statistical tools to find out the dynamic on the market.
During the analysis stage, feedback from the stakeholder groups would be compared to determine areas of agreement as well as areas of divergence
