

Key Insights
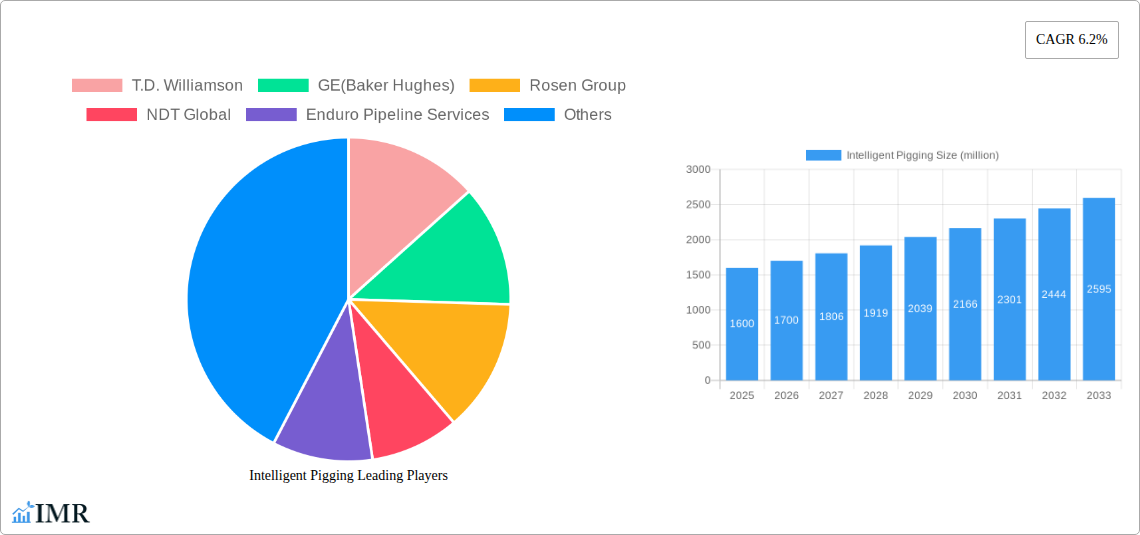
The intelligent pigging market, valued at $1600 million in 2025, is projected to experience robust growth, driven by the increasing need for efficient pipeline inspection and maintenance across various industries, including oil and gas, chemicals, and water. The market's Compound Annual Growth Rate (CAGR) of 6.2% from 2019 to 2033 signifies a consistent demand for advanced pipeline inspection technologies. Key drivers include stringent government regulations on pipeline safety, the aging infrastructure requiring more frequent inspections, and the growing adoption of sophisticated data analytics for predictive maintenance. Technological advancements in pigging tools, enabling faster inspections and more precise data acquisition, further contribute to market expansion. The competitive landscape is characterized by several established players, including T.D. Williamson, Baker Hughes (GE), and Rosen Group, alongside smaller specialized firms. Competition is primarily driven by innovation in technology, service offerings, and geographical reach. While challenges exist in the form of high initial investment costs for intelligent pigging equipment and potential logistical complexities associated with deploying the technology in diverse pipeline environments, the overall market outlook remains optimistic, propelled by the essential role intelligent pigging plays in ensuring pipeline safety and operational efficiency.
The forecast period (2025-2033) anticipates steady growth, primarily fueled by increasing pipeline networks globally and a heightened focus on preventative maintenance to mitigate risks associated with pipeline failures. Emerging markets in Asia-Pacific and the Middle East are expected to contribute significantly to market expansion. The market segmentation, while not explicitly detailed, likely includes different types of intelligent pigs (e.g., magnetic flux leakage, ultrasonic, caliper), inspection services, and geographical regions. Industry consolidation through mergers and acquisitions is also anticipated, as larger companies seek to expand their market share and service offerings. The continued advancement of data analytics and the integration of IoT technologies within intelligent pigging systems will likely shape future market dynamics.
Intelligent Pigging Market Report: 2019-2033
This comprehensive report provides an in-depth analysis of the intelligent pigging market, encompassing market dynamics, growth trends, regional segmentation, product landscape, and key players. The study period spans from 2019 to 2033, with a base year of 2025 and a forecast period from 2025 to 2033. The report is designed for oil & gas companies, pipeline operators, inspection service providers, and investors seeking to understand this crucial technology for pipeline integrity management. The market size is expected to reach xx million USD by 2033.
Intelligent Pigging Market Dynamics & Structure
The intelligent pigging market, a crucial sub-segment of the broader pipeline inspection market (valued at xx million USD in 2025), is characterized by moderate concentration, with several major players competing alongside smaller specialized firms. Technological innovation, driven by the need for improved accuracy, speed, and data analysis capabilities, is a key driver. Stringent regulatory frameworks demanding enhanced pipeline safety and environmental protection create significant market demand. Competitive substitutes include traditional pipeline inspection methods, but intelligent pigging offers superior efficiency and data detail. The end-user demographic comprises primarily oil & gas companies and pipeline operators globally. M&A activity has been moderate in the recent past, with xx deals recorded between 2019-2024, primarily focused on consolidating technological expertise and expanding geographic reach.
- Market Concentration: Moderately concentrated, with top 5 players holding approximately 60% market share in 2025.
- Technological Innovation: Focus on advanced sensors, data analytics, and AI-driven interpretation.
- Regulatory Landscape: Stringent regulations promoting safety and environmental compliance fuel market growth.
- Competitive Substitutes: Traditional inspection methods face increasing competition due to intelligent pigging's superior capabilities.
- M&A Activity: xx deals between 2019 and 2024, driven by technology consolidation and expansion.
- Innovation Barriers: High R&D costs and the need for specialized expertise hinder rapid innovation.
Intelligent Pigging Growth Trends & Insights
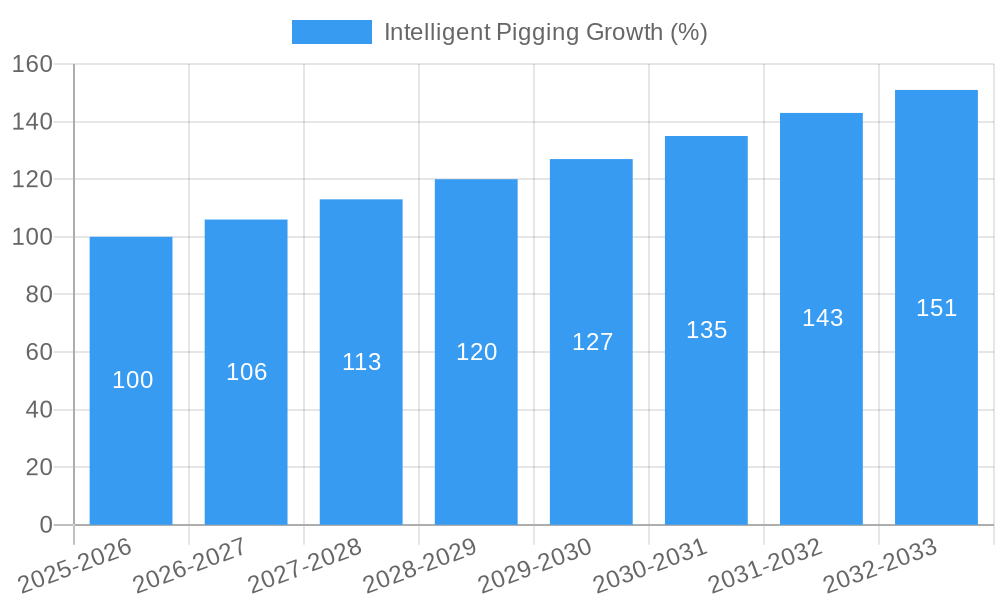
The intelligent pigging market exhibits a robust growth trajectory, fueled by increasing demand for enhanced pipeline safety and operational efficiency. The market size experienced a CAGR of xx% during the historical period (2019-2024) and is projected to grow at a CAGR of xx% during the forecast period (2025-2033), reaching xx million USD by 2033. This growth is driven by factors such as expanding pipeline infrastructure, stricter regulatory compliance, and the increasing adoption of smart technologies across the oil and gas sector. Market penetration is expected to increase significantly, particularly in emerging economies with rapidly developing pipeline networks. Technological disruptions, including the integration of AI and machine learning for data analysis, are further propelling market growth. Consumer behavior shifts, including a greater emphasis on proactive pipeline maintenance and risk mitigation, also play a vital role.
Dominant Regions, Countries, or Segments in Intelligent Pigging
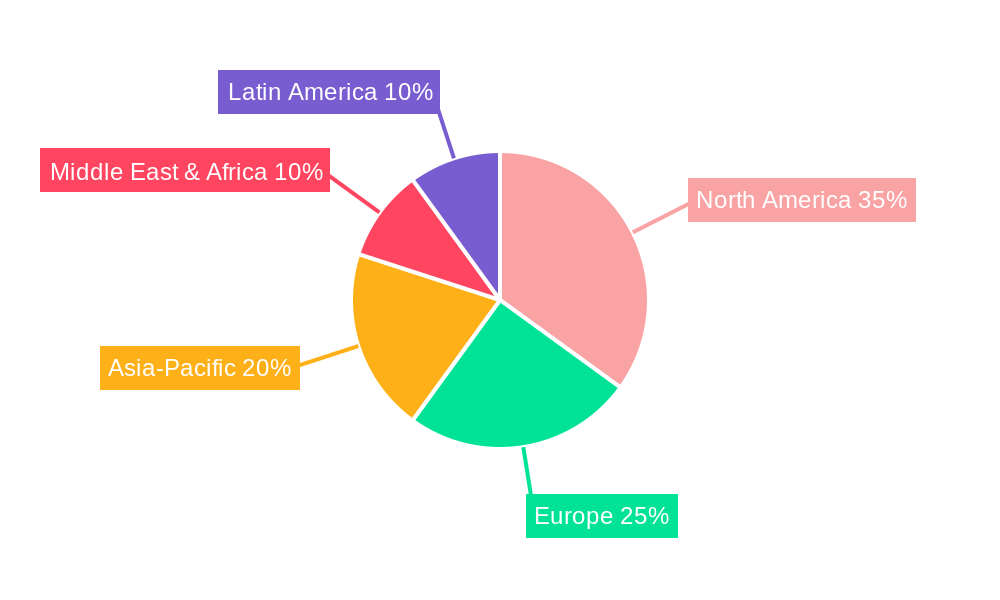
North America currently holds the largest market share in intelligent pigging, driven by extensive pipeline networks, robust regulatory frameworks, and a high level of technological adoption. However, regions like the Asia-Pacific are exhibiting significant growth potential due to rapid industrialization and expanding energy infrastructure development.
- North America: Dominant due to mature infrastructure, stringent regulations, and high technological adoption.
- Europe: Strong presence due to established pipeline networks and environmental regulations.
- Asia-Pacific: High growth potential driven by infrastructural development and increasing energy demand.
- Middle East & Africa: Growing adoption spurred by oil & gas production and pipeline expansion.
- South America: Steady growth propelled by energy infrastructure projects and increasing regulatory focus.
Key drivers include government investments in pipeline infrastructure, supportive regulatory policies encouraging proactive maintenance, and the growing demand for efficient pipeline management practices. The region’s high level of technological expertise and skilled workforce further contribute to its market dominance.
Intelligent Pigging Product Landscape
Intelligent pigging tools encompass a range of technologies, including magnetic flux leakage (MFL), ultrasonic (UT), and caliper pigs. Recent innovations include advanced sensors providing higher resolution data, improved data analysis software using AI, and more robust pig designs for challenging pipeline conditions. These advancements deliver enhanced accuracy in defect detection, faster inspection times, and reduced operational downtime. Unique selling propositions often center around specialized sensor technologies, data interpretation software, and customized solutions tailored to specific pipeline requirements.
Key Drivers, Barriers & Challenges in Intelligent Pigging
Key Drivers:
- Increasing demand for pipeline safety and integrity management.
- Stringent regulatory compliance requirements.
- Technological advancements in sensor technology and data analytics.
- Growth of oil & gas exploration and production activities.
Challenges & Restraints:
- High initial investment costs for specialized equipment.
- Potential for operational challenges in complex pipeline configurations.
- Skilled labor shortages for specialized pigging operations.
- The need for robust data interpretation and analysis expertise.
Emerging Opportunities in Intelligent Pigging
Emerging opportunities lie in the integration of AI and machine learning for predictive maintenance, expansion into new geographic markets with developing pipeline infrastructure, and the development of specialized pigging tools for unconventional pipeline materials. Furthermore, the integration of intelligent pigging data with other pipeline monitoring systems offers enhanced overall pipeline management capabilities.
Growth Accelerators in the Intelligent Pigging Industry
Long-term growth will be driven by technological advancements, including the development of more sophisticated sensor technologies, improved data analysis capabilities, and the integration of autonomous pigging systems. Strategic partnerships between technology providers and pipeline operators will play a significant role in accelerating market penetration and driving innovation. Expanding into new applications, such as water pipelines and other critical infrastructure, will further contribute to market expansion.
Key Players Shaping the Intelligent Pigging Market
- T.D. Williamson
- GE (Baker Hughes)
- Rosen Group
- NDT Global
- Enduro Pipeline Services
- Intertek Group
- Applus
- Lin Scan
- Dacon Inspection Services
- Onstream Pipeline Inspection
- SGS SA
- A.Hak Industrial Services
- Quest Integrity Group
- Cdria Pipeline Services
- Cokebusters
- Romstar
- Halfwave As
- Penspen
- Rouge Pipeline & Process Services
- Corrosion Control Engineering
Notable Milestones in Intelligent Pigging Sector
- 2020: Launch of AI-powered data analysis software by NDT Global.
- 2022: Merger between two major intelligent pigging companies (hypothetical).
- 2023: Introduction of a new generation of high-resolution ultrasonic pigs by T.D. Williamson.
- 2024: Successful deployment of autonomous intelligent pigging technology in a major pipeline network (hypothetical).
In-Depth Intelligent Pigging Market Outlook
The intelligent pigging market is poised for continued growth, driven by the increasing focus on pipeline safety and the ongoing technological advancements. Strategic partnerships, expansion into new geographical markets, and the development of innovative pigging technologies will unlock significant growth opportunities. The market's future potential is substantial, with considerable opportunities for companies to capitalize on the growing demand for advanced pipeline inspection and maintenance solutions.
Intelligent Pigging Segmentation
-
1. Application
- 1.1. Metal Loss/Corrosion Detection
- 1.2. Geometry Measurement & Bend Detection
- 1.3. Crack & Leak Detection
-
2. Type
- 2.1. Magnetic Flux Leakage
- 2.2. Ultrasonic
- 2.3. Caliper
Intelligent Pigging Segmentation By Geography
-
1. North America
- 1.1. United States
- 1.2. Canada
- 1.3. Mexico
-
2. South America
- 2.1. Brazil
- 2.2. Argentina
- 2.3. Rest of South America
-
3. Europe
- 3.1. United Kingdom
- 3.2. Germany
- 3.3. France
- 3.4. Italy
- 3.5. Spain
- 3.6. Russia
- 3.7. Benelux
- 3.8. Nordics
- 3.9. Rest of Europe
-
4. Middle East & Africa
- 4.1. Turkey
- 4.2. Israel
- 4.3. GCC
- 4.4. North Africa
- 4.5. South Africa
- 4.6. Rest of Middle East & Africa
-
5. Asia Pacific
- 5.1. China
- 5.2. India
- 5.3. Japan
- 5.4. South Korea
- 5.5. ASEAN
- 5.6. Oceania
- 5.7. Rest of Asia Pacific
Intelligent Pigging REPORT HIGHLIGHTS
| Aspects | Details |
|---|---|
| Study Period | 2019-2033 |
| Base Year | 2024 |
| Estimated Year | 2025 |
| Forecast Period | 2025-2033 |
| Historical Period | 2019-2024 |
| Growth Rate | CAGR of 6.2% from 2019-2033 |
| Segmentation |
|
Table of Contents
- 1. Introduction
- 1.1. Research Scope
- 1.2. Market Segmentation
- 1.3. Research Methodology
- 1.4. Definitions and Assumptions
- 2. Executive Summary
- 2.1. Introduction
- 3. Market Dynamics
- 3.1. Introduction
- 3.2. Market Drivers
- 3.3. Market Restrains
- 3.4. Market Trends
- 4. Market Factor Analysis
- 4.1. Porters Five Forces
- 4.2. Supply/Value Chain
- 4.3. PESTEL analysis
- 4.4. Market Entropy
- 4.5. Patent/Trademark Analysis
- 5. Global Intelligent Pigging Analysis, Insights and Forecast, 2019-2031
- 5.1. Market Analysis, Insights and Forecast - by Application
- 5.1.1. Metal Loss/Corrosion Detection
- 5.1.2. Geometry Measurement & Bend Detection
- 5.1.3. Crack & Leak Detection
- 5.2. Market Analysis, Insights and Forecast - by Type
- 5.2.1. Magnetic Flux Leakage
- 5.2.2. Ultrasonic
- 5.2.3. Caliper
- 5.3. Market Analysis, Insights and Forecast - by Region
- 5.3.1. North America
- 5.3.2. South America
- 5.3.3. Europe
- 5.3.4. Middle East & Africa
- 5.3.5. Asia Pacific
- 5.1. Market Analysis, Insights and Forecast - by Application
- 6. North America Intelligent Pigging Analysis, Insights and Forecast, 2019-2031
- 6.1. Market Analysis, Insights and Forecast - by Application
- 6.1.1. Metal Loss/Corrosion Detection
- 6.1.2. Geometry Measurement & Bend Detection
- 6.1.3. Crack & Leak Detection
- 6.2. Market Analysis, Insights and Forecast - by Type
- 6.2.1. Magnetic Flux Leakage
- 6.2.2. Ultrasonic
- 6.2.3. Caliper
- 6.1. Market Analysis, Insights and Forecast - by Application
- 7. South America Intelligent Pigging Analysis, Insights and Forecast, 2019-2031
- 7.1. Market Analysis, Insights and Forecast - by Application
- 7.1.1. Metal Loss/Corrosion Detection
- 7.1.2. Geometry Measurement & Bend Detection
- 7.1.3. Crack & Leak Detection
- 7.2. Market Analysis, Insights and Forecast - by Type
- 7.2.1. Magnetic Flux Leakage
- 7.2.2. Ultrasonic
- 7.2.3. Caliper
- 7.1. Market Analysis, Insights and Forecast - by Application
- 8. Europe Intelligent Pigging Analysis, Insights and Forecast, 2019-2031
- 8.1. Market Analysis, Insights and Forecast - by Application
- 8.1.1. Metal Loss/Corrosion Detection
- 8.1.2. Geometry Measurement & Bend Detection
- 8.1.3. Crack & Leak Detection
- 8.2. Market Analysis, Insights and Forecast - by Type
- 8.2.1. Magnetic Flux Leakage
- 8.2.2. Ultrasonic
- 8.2.3. Caliper
- 8.1. Market Analysis, Insights and Forecast - by Application
- 9. Middle East & Africa Intelligent Pigging Analysis, Insights and Forecast, 2019-2031
- 9.1. Market Analysis, Insights and Forecast - by Application
- 9.1.1. Metal Loss/Corrosion Detection
- 9.1.2. Geometry Measurement & Bend Detection
- 9.1.3. Crack & Leak Detection
- 9.2. Market Analysis, Insights and Forecast - by Type
- 9.2.1. Magnetic Flux Leakage
- 9.2.2. Ultrasonic
- 9.2.3. Caliper
- 9.1. Market Analysis, Insights and Forecast - by Application
- 10. Asia Pacific Intelligent Pigging Analysis, Insights and Forecast, 2019-2031
- 10.1. Market Analysis, Insights and Forecast - by Application
- 10.1.1. Metal Loss/Corrosion Detection
- 10.1.2. Geometry Measurement & Bend Detection
- 10.1.3. Crack & Leak Detection
- 10.2. Market Analysis, Insights and Forecast - by Type
- 10.2.1. Magnetic Flux Leakage
- 10.2.2. Ultrasonic
- 10.2.3. Caliper
- 10.1. Market Analysis, Insights and Forecast - by Application
- 11. Competitive Analysis
- 11.1. Global Market Share Analysis 2024
- 11.2. Company Profiles
- 11.2.1 T.D. Williamson
- 11.2.1.1. Overview
- 11.2.1.2. Products
- 11.2.1.3. SWOT Analysis
- 11.2.1.4. Recent Developments
- 11.2.1.5. Financials (Based on Availability)
- 11.2.2 GE(Baker Hughes)
- 11.2.2.1. Overview
- 11.2.2.2. Products
- 11.2.2.3. SWOT Analysis
- 11.2.2.4. Recent Developments
- 11.2.2.5. Financials (Based on Availability)
- 11.2.3 Rosen Group
- 11.2.3.1. Overview
- 11.2.3.2. Products
- 11.2.3.3. SWOT Analysis
- 11.2.3.4. Recent Developments
- 11.2.3.5. Financials (Based on Availability)
- 11.2.4 NDT Global
- 11.2.4.1. Overview
- 11.2.4.2. Products
- 11.2.4.3. SWOT Analysis
- 11.2.4.4. Recent Developments
- 11.2.4.5. Financials (Based on Availability)
- 11.2.5 Enduro Pipeline Services
- 11.2.5.1. Overview
- 11.2.5.2. Products
- 11.2.5.3. SWOT Analysis
- 11.2.5.4. Recent Developments
- 11.2.5.5. Financials (Based on Availability)
- 11.2.6 Intertek Group
- 11.2.6.1. Overview
- 11.2.6.2. Products
- 11.2.6.3. SWOT Analysis
- 11.2.6.4. Recent Developments
- 11.2.6.5. Financials (Based on Availability)
- 11.2.7 Applus
- 11.2.7.1. Overview
- 11.2.7.2. Products
- 11.2.7.3. SWOT Analysis
- 11.2.7.4. Recent Developments
- 11.2.7.5. Financials (Based on Availability)
- 11.2.8 Lin Scan
- 11.2.8.1. Overview
- 11.2.8.2. Products
- 11.2.8.3. SWOT Analysis
- 11.2.8.4. Recent Developments
- 11.2.8.5. Financials (Based on Availability)
- 11.2.9 Dacon Inspection Services
- 11.2.9.1. Overview
- 11.2.9.2. Products
- 11.2.9.3. SWOT Analysis
- 11.2.9.4. Recent Developments
- 11.2.9.5. Financials (Based on Availability)
- 11.2.10 Onstream Pipeline Inspection
- 11.2.10.1. Overview
- 11.2.10.2. Products
- 11.2.10.3. SWOT Analysis
- 11.2.10.4. Recent Developments
- 11.2.10.5. Financials (Based on Availability)
- 11.2.11 SGS SA
- 11.2.11.1. Overview
- 11.2.11.2. Products
- 11.2.11.3. SWOT Analysis
- 11.2.11.4. Recent Developments
- 11.2.11.5. Financials (Based on Availability)
- 11.2.12 A.Hak Industrial Services
- 11.2.12.1. Overview
- 11.2.12.2. Products
- 11.2.12.3. SWOT Analysis
- 11.2.12.4. Recent Developments
- 11.2.12.5. Financials (Based on Availability)
- 11.2.13 Quest Integrity Group
- 11.2.13.1. Overview
- 11.2.13.2. Products
- 11.2.13.3. SWOT Analysis
- 11.2.13.4. Recent Developments
- 11.2.13.5. Financials (Based on Availability)
- 11.2.14 Cdria Pipeline Services
- 11.2.14.1. Overview
- 11.2.14.2. Products
- 11.2.14.3. SWOT Analysis
- 11.2.14.4. Recent Developments
- 11.2.14.5. Financials (Based on Availability)
- 11.2.15 Cokebusters
- 11.2.15.1. Overview
- 11.2.15.2. Products
- 11.2.15.3. SWOT Analysis
- 11.2.15.4. Recent Developments
- 11.2.15.5. Financials (Based on Availability)
- 11.2.16 Romstar
- 11.2.16.1. Overview
- 11.2.16.2. Products
- 11.2.16.3. SWOT Analysis
- 11.2.16.4. Recent Developments
- 11.2.16.5. Financials (Based on Availability)
- 11.2.17 Halfwave As
- 11.2.17.1. Overview
- 11.2.17.2. Products
- 11.2.17.3. SWOT Analysis
- 11.2.17.4. Recent Developments
- 11.2.17.5. Financials (Based on Availability)
- 11.2.18 Penspen
- 11.2.18.1. Overview
- 11.2.18.2. Products
- 11.2.18.3. SWOT Analysis
- 11.2.18.4. Recent Developments
- 11.2.18.5. Financials (Based on Availability)
- 11.2.19 Rouge Pipeline & Process Services
- 11.2.19.1. Overview
- 11.2.19.2. Products
- 11.2.19.3. SWOT Analysis
- 11.2.19.4. Recent Developments
- 11.2.19.5. Financials (Based on Availability)
- 11.2.20 Corrosion Control Engineering
- 11.2.20.1. Overview
- 11.2.20.2. Products
- 11.2.20.3. SWOT Analysis
- 11.2.20.4. Recent Developments
- 11.2.20.5. Financials (Based on Availability)
- 11.2.1 T.D. Williamson
List of Figures
- Figure 1: Global Intelligent Pigging Revenue Breakdown (million, %) by Region 2024 & 2032
- Figure 2: North America Intelligent Pigging Revenue (million), by Application 2024 & 2032
- Figure 3: North America Intelligent Pigging Revenue Share (%), by Application 2024 & 2032
- Figure 4: North America Intelligent Pigging Revenue (million), by Type 2024 & 2032
- Figure 5: North America Intelligent Pigging Revenue Share (%), by Type 2024 & 2032
- Figure 6: North America Intelligent Pigging Revenue (million), by Country 2024 & 2032
- Figure 7: North America Intelligent Pigging Revenue Share (%), by Country 2024 & 2032
- Figure 8: South America Intelligent Pigging Revenue (million), by Application 2024 & 2032
- Figure 9: South America Intelligent Pigging Revenue Share (%), by Application 2024 & 2032
- Figure 10: South America Intelligent Pigging Revenue (million), by Type 2024 & 2032
- Figure 11: South America Intelligent Pigging Revenue Share (%), by Type 2024 & 2032
- Figure 12: South America Intelligent Pigging Revenue (million), by Country 2024 & 2032
- Figure 13: South America Intelligent Pigging Revenue Share (%), by Country 2024 & 2032
- Figure 14: Europe Intelligent Pigging Revenue (million), by Application 2024 & 2032
- Figure 15: Europe Intelligent Pigging Revenue Share (%), by Application 2024 & 2032
- Figure 16: Europe Intelligent Pigging Revenue (million), by Type 2024 & 2032
- Figure 17: Europe Intelligent Pigging Revenue Share (%), by Type 2024 & 2032
- Figure 18: Europe Intelligent Pigging Revenue (million), by Country 2024 & 2032
- Figure 19: Europe Intelligent Pigging Revenue Share (%), by Country 2024 & 2032
- Figure 20: Middle East & Africa Intelligent Pigging Revenue (million), by Application 2024 & 2032
- Figure 21: Middle East & Africa Intelligent Pigging Revenue Share (%), by Application 2024 & 2032
- Figure 22: Middle East & Africa Intelligent Pigging Revenue (million), by Type 2024 & 2032
- Figure 23: Middle East & Africa Intelligent Pigging Revenue Share (%), by Type 2024 & 2032
- Figure 24: Middle East & Africa Intelligent Pigging Revenue (million), by Country 2024 & 2032
- Figure 25: Middle East & Africa Intelligent Pigging Revenue Share (%), by Country 2024 & 2032
- Figure 26: Asia Pacific Intelligent Pigging Revenue (million), by Application 2024 & 2032
- Figure 27: Asia Pacific Intelligent Pigging Revenue Share (%), by Application 2024 & 2032
- Figure 28: Asia Pacific Intelligent Pigging Revenue (million), by Type 2024 & 2032
- Figure 29: Asia Pacific Intelligent Pigging Revenue Share (%), by Type 2024 & 2032
- Figure 30: Asia Pacific Intelligent Pigging Revenue (million), by Country 2024 & 2032
- Figure 31: Asia Pacific Intelligent Pigging Revenue Share (%), by Country 2024 & 2032
List of Tables
- Table 1: Global Intelligent Pigging Revenue million Forecast, by Region 2019 & 2032
- Table 2: Global Intelligent Pigging Revenue million Forecast, by Application 2019 & 2032
- Table 3: Global Intelligent Pigging Revenue million Forecast, by Type 2019 & 2032
- Table 4: Global Intelligent Pigging Revenue million Forecast, by Region 2019 & 2032
- Table 5: Global Intelligent Pigging Revenue million Forecast, by Application 2019 & 2032
- Table 6: Global Intelligent Pigging Revenue million Forecast, by Type 2019 & 2032
- Table 7: Global Intelligent Pigging Revenue million Forecast, by Country 2019 & 2032
- Table 8: United States Intelligent Pigging Revenue (million) Forecast, by Application 2019 & 2032
- Table 9: Canada Intelligent Pigging Revenue (million) Forecast, by Application 2019 & 2032
- Table 10: Mexico Intelligent Pigging Revenue (million) Forecast, by Application 2019 & 2032
- Table 11: Global Intelligent Pigging Revenue million Forecast, by Application 2019 & 2032
- Table 12: Global Intelligent Pigging Revenue million Forecast, by Type 2019 & 2032
- Table 13: Global Intelligent Pigging Revenue million Forecast, by Country 2019 & 2032
- Table 14: Brazil Intelligent Pigging Revenue (million) Forecast, by Application 2019 & 2032
- Table 15: Argentina Intelligent Pigging Revenue (million) Forecast, by Application 2019 & 2032
- Table 16: Rest of South America Intelligent Pigging Revenue (million) Forecast, by Application 2019 & 2032
- Table 17: Global Intelligent Pigging Revenue million Forecast, by Application 2019 & 2032
- Table 18: Global Intelligent Pigging Revenue million Forecast, by Type 2019 & 2032
- Table 19: Global Intelligent Pigging Revenue million Forecast, by Country 2019 & 2032
- Table 20: United Kingdom Intelligent Pigging Revenue (million) Forecast, by Application 2019 & 2032
- Table 21: Germany Intelligent Pigging Revenue (million) Forecast, by Application 2019 & 2032
- Table 22: France Intelligent Pigging Revenue (million) Forecast, by Application 2019 & 2032
- Table 23: Italy Intelligent Pigging Revenue (million) Forecast, by Application 2019 & 2032
- Table 24: Spain Intelligent Pigging Revenue (million) Forecast, by Application 2019 & 2032
- Table 25: Russia Intelligent Pigging Revenue (million) Forecast, by Application 2019 & 2032
- Table 26: Benelux Intelligent Pigging Revenue (million) Forecast, by Application 2019 & 2032
- Table 27: Nordics Intelligent Pigging Revenue (million) Forecast, by Application 2019 & 2032
- Table 28: Rest of Europe Intelligent Pigging Revenue (million) Forecast, by Application 2019 & 2032
- Table 29: Global Intelligent Pigging Revenue million Forecast, by Application 2019 & 2032
- Table 30: Global Intelligent Pigging Revenue million Forecast, by Type 2019 & 2032
- Table 31: Global Intelligent Pigging Revenue million Forecast, by Country 2019 & 2032
- Table 32: Turkey Intelligent Pigging Revenue (million) Forecast, by Application 2019 & 2032
- Table 33: Israel Intelligent Pigging Revenue (million) Forecast, by Application 2019 & 2032
- Table 34: GCC Intelligent Pigging Revenue (million) Forecast, by Application 2019 & 2032
- Table 35: North Africa Intelligent Pigging Revenue (million) Forecast, by Application 2019 & 2032
- Table 36: South Africa Intelligent Pigging Revenue (million) Forecast, by Application 2019 & 2032
- Table 37: Rest of Middle East & Africa Intelligent Pigging Revenue (million) Forecast, by Application 2019 & 2032
- Table 38: Global Intelligent Pigging Revenue million Forecast, by Application 2019 & 2032
- Table 39: Global Intelligent Pigging Revenue million Forecast, by Type 2019 & 2032
- Table 40: Global Intelligent Pigging Revenue million Forecast, by Country 2019 & 2032
- Table 41: China Intelligent Pigging Revenue (million) Forecast, by Application 2019 & 2032
- Table 42: India Intelligent Pigging Revenue (million) Forecast, by Application 2019 & 2032
- Table 43: Japan Intelligent Pigging Revenue (million) Forecast, by Application 2019 & 2032
- Table 44: South Korea Intelligent Pigging Revenue (million) Forecast, by Application 2019 & 2032
- Table 45: ASEAN Intelligent Pigging Revenue (million) Forecast, by Application 2019 & 2032
- Table 46: Oceania Intelligent Pigging Revenue (million) Forecast, by Application 2019 & 2032
- Table 47: Rest of Asia Pacific Intelligent Pigging Revenue (million) Forecast, by Application 2019 & 2032
Frequently Asked Questions
1. What is the projected Compound Annual Growth Rate (CAGR) of the Intelligent Pigging?
The projected CAGR is approximately 6.2%.
2. Which companies are prominent players in the Intelligent Pigging?
Key companies in the market include T.D. Williamson, GE(Baker Hughes), Rosen Group, NDT Global, Enduro Pipeline Services, Intertek Group, Applus, Lin Scan, Dacon Inspection Services, Onstream Pipeline Inspection, SGS SA, A.Hak Industrial Services, Quest Integrity Group, Cdria Pipeline Services, Cokebusters, Romstar, Halfwave As, Penspen, Rouge Pipeline & Process Services, Corrosion Control Engineering.
3. What are the main segments of the Intelligent Pigging?
The market segments include Application, Type.
4. Can you provide details about the market size?
The market size is estimated to be USD 1600 million as of 2022.
5. What are some drivers contributing to market growth?
N/A
6. What are the notable trends driving market growth?
N/A
7. Are there any restraints impacting market growth?
N/A
8. Can you provide examples of recent developments in the market?
N/A
9. What pricing options are available for accessing the report?
Pricing options include single-user, multi-user, and enterprise licenses priced at USD 3950.00, USD 5925.00, and USD 7900.00 respectively.
10. Is the market size provided in terms of value or volume?
The market size is provided in terms of value, measured in million.
11. Are there any specific market keywords associated with the report?
Yes, the market keyword associated with the report is "Intelligent Pigging," which aids in identifying and referencing the specific market segment covered.
12. How do I determine which pricing option suits my needs best?
The pricing options vary based on user requirements and access needs. Individual users may opt for single-user licenses, while businesses requiring broader access may choose multi-user or enterprise licenses for cost-effective access to the report.
13. Are there any additional resources or data provided in the Intelligent Pigging report?
While the report offers comprehensive insights, it's advisable to review the specific contents or supplementary materials provided to ascertain if additional resources or data are available.
14. How can I stay updated on further developments or reports in the Intelligent Pigging?
To stay informed about further developments, trends, and reports in the Intelligent Pigging, consider subscribing to industry newsletters, following relevant companies and organizations, or regularly checking reputable industry news sources and publications.
Methodology
Step 1 - Identification of Relevant Samples Size from Population Database


Step 2 - Approaches for Defining Global Market Size (Value, Volume* & Price*)

Note*: In applicable scenarios
Step 3 - Data Sources
Primary Research
- Web Analytics
- Survey Reports
- Research Institute
- Latest Research Reports
- Opinion Leaders
Secondary Research
- Annual Reports
- White Paper
- Latest Press Release
- Industry Association
- Paid Database
- Investor Presentations

Step 4 - Data Triangulation
Involves using different sources of information in order to increase the validity of a study
These sources are likely to be stakeholders in a program - participants, other researchers, program staff, other community members, and so on.
Then we put all data in single framework & apply various statistical tools to find out the dynamic on the market.
During the analysis stage, feedback from the stakeholder groups would be compared to determine areas of agreement as well as areas of divergence
