

Key Insights
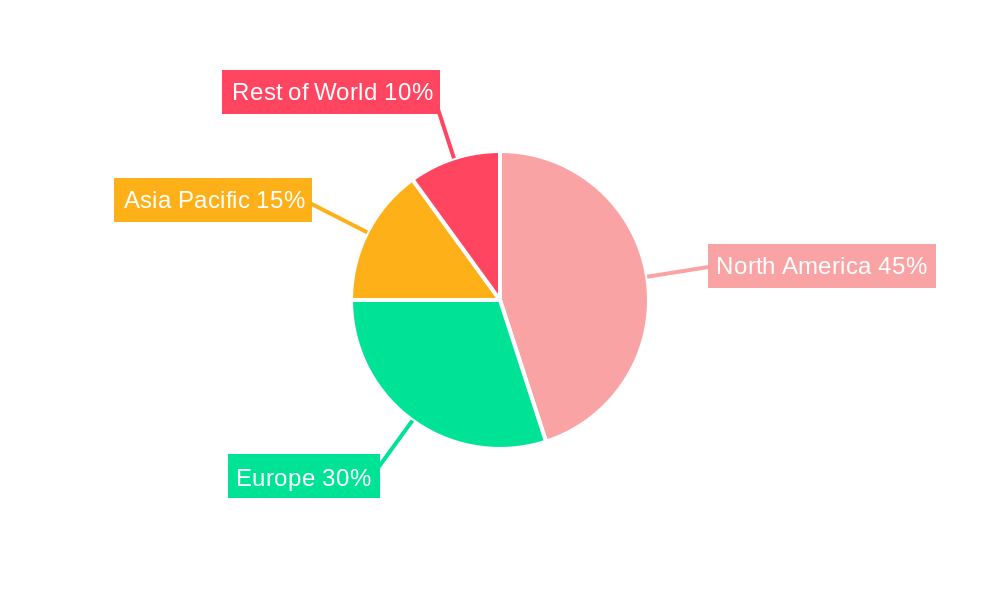
The In Vitro Diagnostics (IVD) Quality Control market is experiencing steady growth, driven by the increasing demand for accurate and reliable diagnostic testing. A 3.5% Compound Annual Growth Rate (CAGR) from 2019 to 2024 suggests a robust market, projected to continue its expansion through 2033. Several factors contribute to this growth. Firstly, the rising prevalence of chronic diseases globally necessitates more frequent and sophisticated diagnostic testing, thus increasing the need for quality control to maintain accuracy and reliability. Secondly, advancements in molecular diagnostics and immunochemistry are expanding the application of IVD quality control, demanding more specialized products and services. The market is segmented by product (quality control products, data management solutions, and quality assurance services), application (immunochemistry, hematology, molecular diagnostics, coagulation/hemostasis, and other applications), and end-user (hospitals, clinical laboratories, IVD manufacturers & CROs, and other end-users). The dominance of certain segments will likely shift over time, with molecular diagnostics and data management solutions potentially showing faster growth due to technological advancements. North America currently holds a significant market share, driven by advanced healthcare infrastructure and high adoption rates of advanced technologies. However, regions like Asia-Pacific are expected to witness significant growth in the coming years, fueled by expanding healthcare budgets and a rising middle class with increased access to healthcare services. The competitive landscape includes both large multinational corporations and specialized smaller companies, indicating opportunities for both established players and emerging innovators. Regulatory changes and increasing emphasis on standardization are expected to influence market dynamics, driving adoption of high-quality, compliant products and services.
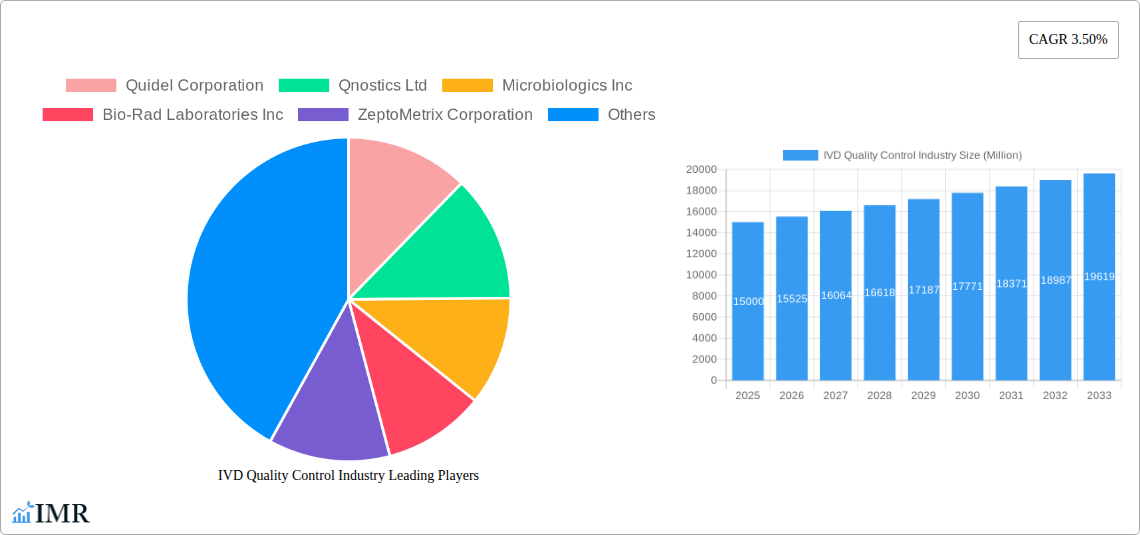
The competitive landscape is characterized by the presence of both large multinational companies such as Abbott Laboratories, Thermo Fisher Scientific, and Roche, and smaller specialized firms like Quidel Corporation and Qnostics Ltd. These companies are actively engaged in research and development, leading to the introduction of innovative products and services. The market is also seeing an increasing trend towards partnerships and collaborations between companies, aimed at expanding their product portfolio and geographical reach. The challenge lies in navigating regulatory hurdles and ensuring compliance with international standards, which adds complexity to market entry and expansion strategies. The market's future growth will depend on the pace of technological advancements, regulatory changes, and the increasing adoption of advanced diagnostics across different regions globally. Maintaining a high level of quality control is paramount given the impact diagnostic testing has on patient care and public health.
IVD Quality Control Industry Market Report: 2019-2033
This comprehensive report provides a detailed analysis of the In Vitro Diagnostics (IVD) Quality Control market, encompassing market size, growth trends, key players, and future opportunities. The study period covers 2019-2033, with 2025 as the base year and a forecast period of 2025-2033. The report segments the market by product and services (Quality Control Products, Data Management Solutions, Quality Assurance Services), application (Immunochemistry, Hematology, Molecular Diagnostics, Coagulation/Hemostasis, Other Applications), and end-users (Hospitals, Clinical Laboratories, IVD Manufacturers & CROs, Other End Users). The report values are presented in million units.
IVD Quality Control Industry Market Dynamics & Structure
The IVD Quality Control market is characterized by a moderately concentrated structure, with several large multinational corporations holding significant market share. Technological innovation, particularly in digitalization and automation, is a key driver of growth. Stringent regulatory frameworks, such as those enforced by the FDA and equivalent international bodies, influence product development and market access. Competitive product substitutes, including alternative quality control methods and diagnostic technologies, pose a challenge. The market is further shaped by demographic trends, such as an aging population and rising prevalence of chronic diseases, which increase demand for diagnostic testing and consequently, quality control measures. M&A activity in the sector remains robust, with a xx% increase in deal volume over the historical period (2019-2024), driven by the desire for companies to expand their product portfolios and market reach.
- Market Concentration: Moderately concentrated, with top 5 players holding approximately xx% market share in 2024.
- Technological Innovation: Rapid advancements in automation, AI, and digital platforms are driving efficiency and accuracy.
- Regulatory Landscape: Stringent regulations (FDA, EMA, etc.) necessitate significant investment in compliance.
- Competitive Substitutes: Emergence of alternative QC methods and diagnostic technologies presents competitive pressure.
- M&A Activity: xx M&A deals recorded in the historical period (2019-2024), indicating strong consolidation trends.
- Innovation Barriers: High regulatory hurdles, significant R&D investment required.
IVD Quality Control Industry Growth Trends & Insights
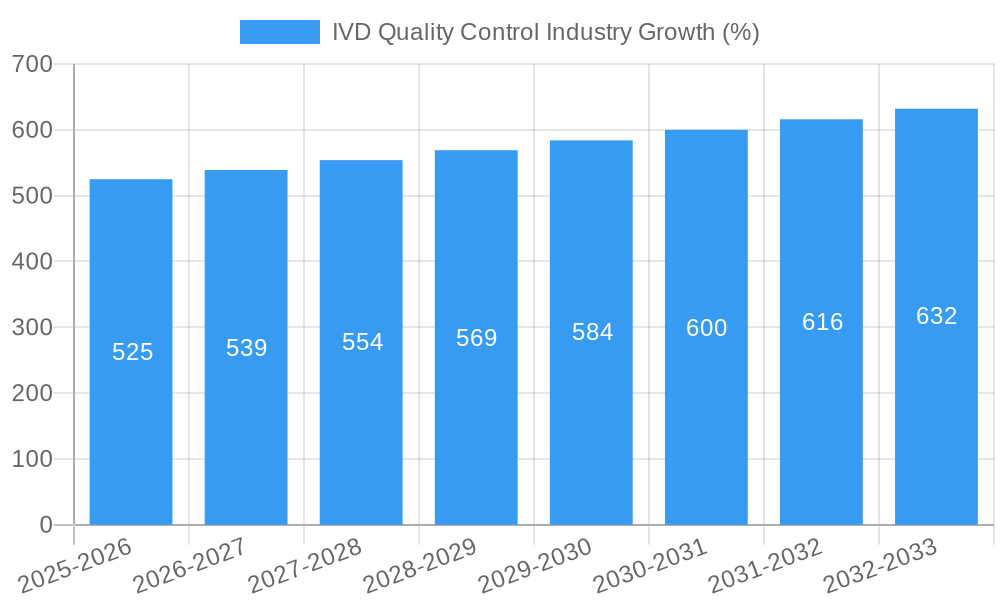
The IVD Quality Control market experienced robust growth during the historical period (2019-2024), with a CAGR of xx%. This growth is attributed to factors such as increasing demand for accurate and reliable diagnostic testing, technological advancements leading to improved product offerings, and expansion of the healthcare infrastructure globally. Market penetration in developing economies remains relatively low, presenting significant growth opportunities. The adoption of advanced data management solutions and quality assurance services is steadily increasing, driven by a growing need for data-driven decision-making in clinical laboratories. Shifting consumer behavior towards personalized medicine also fuels the demand for higher-quality diagnostic tests and, consequently, robust quality control processes. The forecast period (2025-2033) projects continued growth, with a projected CAGR of xx%, driven primarily by the aforementioned factors.
Dominant Regions, Countries, or Segments in IVD Quality Control Industry
North America currently holds the largest market share in the IVD Quality Control market, driven by factors such as strong healthcare infrastructure, high adoption rates of advanced technologies, and favorable regulatory environments. Europe follows closely as a significant market, while Asia-Pacific is expected to witness the fastest growth rate over the forecast period. Among the segments, Quality Control Products remain the dominant segment, accounting for xx% of the total market value in 2024. However, the Data Management Solutions and Quality Assurance Services segments are experiencing rapid growth, fueled by increasing demand for data analytics and comprehensive quality management systems.
- North America: Large market share due to established healthcare infrastructure, high technology adoption.
- Europe: Strong market presence with increasing focus on digitalization and automation.
- Asia-Pacific: Fastest-growing region, driven by rising healthcare expenditure and increasing diagnostic testing demand.
- Quality Control Products: Largest segment, providing the foundation for reliable diagnostics.
- Data Management Solutions: High growth segment driven by increasing demand for data-driven decision-making.
- Quality Assurance Services: Growing segment driven by increasing need for compliance and quality management.
- Molecular Diagnostics Application: High growth potential due to increasing demand for personalized medicine and advancements in genetic testing.
IVD Quality Control Industry Product Landscape
The IVD quality control product landscape is characterized by a wide range of products designed to ensure the accuracy and reliability of diagnostic tests. These include control materials, calibrators, and software solutions for data management and quality assurance. Recent innovations include automated systems that improve efficiency and reduce manual errors. Many products leverage advanced technologies, such as digital connectivity, to streamline workflows and improve data analysis. Unique selling propositions often center on enhanced accuracy, ease of use, and improved integration with existing laboratory information systems (LIS).
Key Drivers, Barriers & Challenges in IVD Quality Control Industry
Key Drivers: Increasing demand for accurate diagnostic tests, technological advancements leading to improved product offerings, stringent regulatory requirements driving adoption of quality control solutions, and growth in healthcare expenditure.
Key Challenges: High regulatory hurdles, increasing competition, fluctuating raw material prices impacting product costs, and supply chain disruptions potentially leading to product shortages. These challenges could cumulatively impact market growth by an estimated xx% during the forecast period if not adequately addressed.
Emerging Opportunities in IVD Quality Control Industry
Emerging opportunities lie in the development of point-of-care testing (POCT) quality control solutions, integration of artificial intelligence (AI) for improved data analysis, and expansion into underserved markets. There is also growing demand for personalized quality control solutions tailored to specific diagnostic tests and patient populations. Furthermore, the development of cloud-based data management platforms presents significant opportunities for enhanced data security and accessibility.
Growth Accelerators in the IVD Quality Control Industry
Strategic partnerships between IVD manufacturers and technology providers are accelerating market growth by fostering innovation and improving product integration. Technological breakthroughs in automation and digitalization are streamlining workflows and enhancing efficiency. Moreover, market expansion into emerging economies with growing healthcare infrastructure creates significant growth potential.
Key Players Shaping the IVD Quality Control Industry Market
- Quidel Corporation
- Qnostics Ltd
- Microbiologics Inc
- Bio-Rad Laboratories Inc
- ZeptoMetrix Corporation
- Abbott Laboratories
- bioMérieux Inc
- F. Hoffmann-La Roche AG
- SeraCare Life Sciences Inc
- Thermo Fisher Scientific
Notable Milestones in IVD Quality Control Industry Sector
- July 2022: BrightSight Inc. launched a digital Connected Diagnostics Platform, streamlining workflows for IVD manufacturers.
- June 2022: EKF Diagnostics launched its EKF Link digital connectivity solution for secure management of point-of-care analyzers.
In-Depth IVD Quality Control Industry Market Outlook
The IVD Quality Control market is poised for sustained growth over the forecast period, driven by technological advancements, increasing demand for accurate diagnostics, and expansion into emerging markets. Strategic partnerships and innovative product development will be crucial for companies seeking to capitalize on the market’s considerable potential. The focus on digitalization and data analytics will continue to shape the market landscape, offering opportunities for companies that can provide comprehensive and integrated solutions.
IVD Quality Control Industry Segmentation
-
1. Products and Services
- 1.1. Quality Control Products
- 1.2. Data Management Solutions
- 1.3. Quality Assurance Services
-
2. Application
- 2.1. Immunochemistry
- 2.2. Hematology
- 2.3. Molecular Diagnostics
- 2.4. Coagulation/Hemostasis
- 2.5. Other Applications
-
3. End Users
- 3.1. Hospitals
- 3.2. Clinical Laboratories
- 3.3. IVD Manufacturers & CROs
- 3.4. Other End Users
IVD Quality Control Industry Segmentation By Geography
-
1. North America
- 1.1. United States
- 1.2. Canada
- 1.3. Mexico
-
2. Europe
- 2.1. Germany
- 2.2. United Kingdom
- 2.3. France
- 2.4. Italy
- 2.5. Spain
- 2.6. Rest of Europe
-
3. Asia Pacific
- 3.1. China
- 3.2. Japan
- 3.3. India
- 3.4. Australia
- 3.5. South Korea
- 3.6. Rest of Asia Pacific
-
4. Middle East and Africa
- 4.1. GCC
- 4.2. South Africa
- 4.3. Rest of Middle East and Africa
-
5. South America
- 5.1. Brazil
- 5.2. Argentina
- 5.3. Rest of South America
IVD Quality Control Industry REPORT HIGHLIGHTS
| Aspects | Details |
|---|---|
| Study Period | 2019-2033 |
| Base Year | 2024 |
| Estimated Year | 2025 |
| Forecast Period | 2025-2033 |
| Historical Period | 2019-2024 |
| Growth Rate | CAGR of 3.50% from 2019-2033 |
| Segmentation |
|
Table of Contents
- 1. Introduction
- 1.1. Research Scope
- 1.2. Market Segmentation
- 1.3. Research Methodology
- 1.4. Definitions and Assumptions
- 2. Executive Summary
- 2.1. Introduction
- 3. Market Dynamics
- 3.1. Introduction
- 3.2. Market Drivers
- 3.2.1 Increased Demand for Advanced Diagnostics for Sensitive Reports and Accurate Diagnosis; Rise in Global Incidence of Infectious Diseases
- 3.2.2 Cancers and Genetic Disorders; Rise in the Volume of Accredited Clinical Laboratories and Adoption of Third-Party Quality Controls
- 3.3. Market Restrains
- 3.3.1. Unfavorable Reimbursement Policies for IVD Industry; Lack of Stringent Regulations for Clinical Laboratory Accreditation in Several Emerging Economies
- 3.4. Market Trends
- 3.4.1. Molecular Diagnostics Segment is Expected to Register a Significant CAGR in the In-Vitro Diagnostics Quality Control Market Over the Forecast Period
- 4. Market Factor Analysis
- 4.1. Porters Five Forces
- 4.2. Supply/Value Chain
- 4.3. PESTEL analysis
- 4.4. Market Entropy
- 4.5. Patent/Trademark Analysis
- 5. Global IVD Quality Control Industry Analysis, Insights and Forecast, 2019-2031
- 5.1. Market Analysis, Insights and Forecast - by Products and Services
- 5.1.1. Quality Control Products
- 5.1.2. Data Management Solutions
- 5.1.3. Quality Assurance Services
- 5.2. Market Analysis, Insights and Forecast - by Application
- 5.2.1. Immunochemistry
- 5.2.2. Hematology
- 5.2.3. Molecular Diagnostics
- 5.2.4. Coagulation/Hemostasis
- 5.2.5. Other Applications
- 5.3. Market Analysis, Insights and Forecast - by End Users
- 5.3.1. Hospitals
- 5.3.2. Clinical Laboratories
- 5.3.3. IVD Manufacturers & CROs
- 5.3.4. Other End Users
- 5.4. Market Analysis, Insights and Forecast - by Region
- 5.4.1. North America
- 5.4.2. Europe
- 5.4.3. Asia Pacific
- 5.4.4. Middle East and Africa
- 5.4.5. South America
- 5.1. Market Analysis, Insights and Forecast - by Products and Services
- 6. North America IVD Quality Control Industry Analysis, Insights and Forecast, 2019-2031
- 6.1. Market Analysis, Insights and Forecast - by Products and Services
- 6.1.1. Quality Control Products
- 6.1.2. Data Management Solutions
- 6.1.3. Quality Assurance Services
- 6.2. Market Analysis, Insights and Forecast - by Application
- 6.2.1. Immunochemistry
- 6.2.2. Hematology
- 6.2.3. Molecular Diagnostics
- 6.2.4. Coagulation/Hemostasis
- 6.2.5. Other Applications
- 6.3. Market Analysis, Insights and Forecast - by End Users
- 6.3.1. Hospitals
- 6.3.2. Clinical Laboratories
- 6.3.3. IVD Manufacturers & CROs
- 6.3.4. Other End Users
- 6.1. Market Analysis, Insights and Forecast - by Products and Services
- 7. Europe IVD Quality Control Industry Analysis, Insights and Forecast, 2019-2031
- 7.1. Market Analysis, Insights and Forecast - by Products and Services
- 7.1.1. Quality Control Products
- 7.1.2. Data Management Solutions
- 7.1.3. Quality Assurance Services
- 7.2. Market Analysis, Insights and Forecast - by Application
- 7.2.1. Immunochemistry
- 7.2.2. Hematology
- 7.2.3. Molecular Diagnostics
- 7.2.4. Coagulation/Hemostasis
- 7.2.5. Other Applications
- 7.3. Market Analysis, Insights and Forecast - by End Users
- 7.3.1. Hospitals
- 7.3.2. Clinical Laboratories
- 7.3.3. IVD Manufacturers & CROs
- 7.3.4. Other End Users
- 7.1. Market Analysis, Insights and Forecast - by Products and Services
- 8. Asia Pacific IVD Quality Control Industry Analysis, Insights and Forecast, 2019-2031
- 8.1. Market Analysis, Insights and Forecast - by Products and Services
- 8.1.1. Quality Control Products
- 8.1.2. Data Management Solutions
- 8.1.3. Quality Assurance Services
- 8.2. Market Analysis, Insights and Forecast - by Application
- 8.2.1. Immunochemistry
- 8.2.2. Hematology
- 8.2.3. Molecular Diagnostics
- 8.2.4. Coagulation/Hemostasis
- 8.2.5. Other Applications
- 8.3. Market Analysis, Insights and Forecast - by End Users
- 8.3.1. Hospitals
- 8.3.2. Clinical Laboratories
- 8.3.3. IVD Manufacturers & CROs
- 8.3.4. Other End Users
- 8.1. Market Analysis, Insights and Forecast - by Products and Services
- 9. Middle East and Africa IVD Quality Control Industry Analysis, Insights and Forecast, 2019-2031
- 9.1. Market Analysis, Insights and Forecast - by Products and Services
- 9.1.1. Quality Control Products
- 9.1.2. Data Management Solutions
- 9.1.3. Quality Assurance Services
- 9.2. Market Analysis, Insights and Forecast - by Application
- 9.2.1. Immunochemistry
- 9.2.2. Hematology
- 9.2.3. Molecular Diagnostics
- 9.2.4. Coagulation/Hemostasis
- 9.2.5. Other Applications
- 9.3. Market Analysis, Insights and Forecast - by End Users
- 9.3.1. Hospitals
- 9.3.2. Clinical Laboratories
- 9.3.3. IVD Manufacturers & CROs
- 9.3.4. Other End Users
- 9.1. Market Analysis, Insights and Forecast - by Products and Services
- 10. South America IVD Quality Control Industry Analysis, Insights and Forecast, 2019-2031
- 10.1. Market Analysis, Insights and Forecast - by Products and Services
- 10.1.1. Quality Control Products
- 10.1.2. Data Management Solutions
- 10.1.3. Quality Assurance Services
- 10.2. Market Analysis, Insights and Forecast - by Application
- 10.2.1. Immunochemistry
- 10.2.2. Hematology
- 10.2.3. Molecular Diagnostics
- 10.2.4. Coagulation/Hemostasis
- 10.2.5. Other Applications
- 10.3. Market Analysis, Insights and Forecast - by End Users
- 10.3.1. Hospitals
- 10.3.2. Clinical Laboratories
- 10.3.3. IVD Manufacturers & CROs
- 10.3.4. Other End Users
- 10.1. Market Analysis, Insights and Forecast - by Products and Services
- 11. North Americ IVD Quality Control Industry Analysis, Insights and Forecast, 2019-2031
- 11.1. Market Analysis, Insights and Forecast - By Country/Sub-region
- 11.1.1 United States
- 11.1.2 Canada
- 11.1.3 Mexico
- 12. South America IVD Quality Control Industry Analysis, Insights and Forecast, 2019-2031
- 12.1. Market Analysis, Insights and Forecast - By Country/Sub-region
- 12.1.1 Brazil
- 12.1.2 Mexico
- 12.1.3 Rest of South America
- 13. Europe IVD Quality Control Industry Analysis, Insights and Forecast, 2019-2031
- 13.1. Market Analysis, Insights and Forecast - By Country/Sub-region
- 13.1.1 Germany
- 13.1.2 United Kingdom
- 13.1.3 France
- 13.1.4 Italy
- 13.1.5 Spain
- 13.1.6 Rest of Europe
- 14. Asia Pacific IVD Quality Control Industry Analysis, Insights and Forecast, 2019-2031
- 14.1. Market Analysis, Insights and Forecast - By Country/Sub-region
- 14.1.1 China
- 14.1.2 Japan
- 14.1.3 India
- 14.1.4 South Korea
- 14.1.5 Taiwan
- 14.1.6 Australia
- 14.1.7 Rest of Asia-Pacific
- 15. MEA IVD Quality Control Industry Analysis, Insights and Forecast, 2019-2031
- 15.1. Market Analysis, Insights and Forecast - By Country/Sub-region
- 15.1.1 Middle East
- 15.1.2 Africa
- 16. Competitive Analysis
- 16.1. Global Market Share Analysis 2024
- 16.2. Company Profiles
- 16.2.1 Quidel Corporation
- 16.2.1.1. Overview
- 16.2.1.2. Products
- 16.2.1.3. SWOT Analysis
- 16.2.1.4. Recent Developments
- 16.2.1.5. Financials (Based on Availability)
- 16.2.2 Qnostics Ltd
- 16.2.2.1. Overview
- 16.2.2.2. Products
- 16.2.2.3. SWOT Analysis
- 16.2.2.4. Recent Developments
- 16.2.2.5. Financials (Based on Availability)
- 16.2.3 Microbiologics Inc
- 16.2.3.1. Overview
- 16.2.3.2. Products
- 16.2.3.3. SWOT Analysis
- 16.2.3.4. Recent Developments
- 16.2.3.5. Financials (Based on Availability)
- 16.2.4 Bio-Rad Laboratories Inc
- 16.2.4.1. Overview
- 16.2.4.2. Products
- 16.2.4.3. SWOT Analysis
- 16.2.4.4. Recent Developments
- 16.2.4.5. Financials (Based on Availability)
- 16.2.5 ZeptoMetrix Corporation
- 16.2.5.1. Overview
- 16.2.5.2. Products
- 16.2.5.3. SWOT Analysis
- 16.2.5.4. Recent Developments
- 16.2.5.5. Financials (Based on Availability)
- 16.2.6 Abbott Laboratories
- 16.2.6.1. Overview
- 16.2.6.2. Products
- 16.2.6.3. SWOT Analysis
- 16.2.6.4. Recent Developments
- 16.2.6.5. Financials (Based on Availability)
- 16.2.7 bioMerieux Inc
- 16.2.7.1. Overview
- 16.2.7.2. Products
- 16.2.7.3. SWOT Analysis
- 16.2.7.4. Recent Developments
- 16.2.7.5. Financials (Based on Availability)
- 16.2.8 F Hoffmann-La Roche AG
- 16.2.8.1. Overview
- 16.2.8.2. Products
- 16.2.8.3. SWOT Analysis
- 16.2.8.4. Recent Developments
- 16.2.8.5. Financials (Based on Availability)
- 16.2.9 SeraCare Life Sciences Inc
- 16.2.9.1. Overview
- 16.2.9.2. Products
- 16.2.9.3. SWOT Analysis
- 16.2.9.4. Recent Developments
- 16.2.9.5. Financials (Based on Availability)
- 16.2.10 Thermo Fisher Scientific
- 16.2.10.1. Overview
- 16.2.10.2. Products
- 16.2.10.3. SWOT Analysis
- 16.2.10.4. Recent Developments
- 16.2.10.5. Financials (Based on Availability)
- 16.2.1 Quidel Corporation
List of Figures
- Figure 1: Global IVD Quality Control Industry Revenue Breakdown (Million, %) by Region 2024 & 2032
- Figure 2: Global IVD Quality Control Industry Volume Breakdown (K Unit, %) by Region 2024 & 2032
- Figure 3: North Americ IVD Quality Control Industry Revenue (Million), by Country 2024 & 2032
- Figure 4: North Americ IVD Quality Control Industry Volume (K Unit), by Country 2024 & 2032
- Figure 5: North Americ IVD Quality Control Industry Revenue Share (%), by Country 2024 & 2032
- Figure 6: North Americ IVD Quality Control Industry Volume Share (%), by Country 2024 & 2032
- Figure 7: South America IVD Quality Control Industry Revenue (Million), by Country 2024 & 2032
- Figure 8: South America IVD Quality Control Industry Volume (K Unit), by Country 2024 & 2032
- Figure 9: South America IVD Quality Control Industry Revenue Share (%), by Country 2024 & 2032
- Figure 10: South America IVD Quality Control Industry Volume Share (%), by Country 2024 & 2032
- Figure 11: Europe IVD Quality Control Industry Revenue (Million), by Country 2024 & 2032
- Figure 12: Europe IVD Quality Control Industry Volume (K Unit), by Country 2024 & 2032
- Figure 13: Europe IVD Quality Control Industry Revenue Share (%), by Country 2024 & 2032
- Figure 14: Europe IVD Quality Control Industry Volume Share (%), by Country 2024 & 2032
- Figure 15: Asia Pacific IVD Quality Control Industry Revenue (Million), by Country 2024 & 2032
- Figure 16: Asia Pacific IVD Quality Control Industry Volume (K Unit), by Country 2024 & 2032
- Figure 17: Asia Pacific IVD Quality Control Industry Revenue Share (%), by Country 2024 & 2032
- Figure 18: Asia Pacific IVD Quality Control Industry Volume Share (%), by Country 2024 & 2032
- Figure 19: MEA IVD Quality Control Industry Revenue (Million), by Country 2024 & 2032
- Figure 20: MEA IVD Quality Control Industry Volume (K Unit), by Country 2024 & 2032
- Figure 21: MEA IVD Quality Control Industry Revenue Share (%), by Country 2024 & 2032
- Figure 22: MEA IVD Quality Control Industry Volume Share (%), by Country 2024 & 2032
- Figure 23: North America IVD Quality Control Industry Revenue (Million), by Products and Services 2024 & 2032
- Figure 24: North America IVD Quality Control Industry Volume (K Unit), by Products and Services 2024 & 2032
- Figure 25: North America IVD Quality Control Industry Revenue Share (%), by Products and Services 2024 & 2032
- Figure 26: North America IVD Quality Control Industry Volume Share (%), by Products and Services 2024 & 2032
- Figure 27: North America IVD Quality Control Industry Revenue (Million), by Application 2024 & 2032
- Figure 28: North America IVD Quality Control Industry Volume (K Unit), by Application 2024 & 2032
- Figure 29: North America IVD Quality Control Industry Revenue Share (%), by Application 2024 & 2032
- Figure 30: North America IVD Quality Control Industry Volume Share (%), by Application 2024 & 2032
- Figure 31: North America IVD Quality Control Industry Revenue (Million), by End Users 2024 & 2032
- Figure 32: North America IVD Quality Control Industry Volume (K Unit), by End Users 2024 & 2032
- Figure 33: North America IVD Quality Control Industry Revenue Share (%), by End Users 2024 & 2032
- Figure 34: North America IVD Quality Control Industry Volume Share (%), by End Users 2024 & 2032
- Figure 35: North America IVD Quality Control Industry Revenue (Million), by Country 2024 & 2032
- Figure 36: North America IVD Quality Control Industry Volume (K Unit), by Country 2024 & 2032
- Figure 37: North America IVD Quality Control Industry Revenue Share (%), by Country 2024 & 2032
- Figure 38: North America IVD Quality Control Industry Volume Share (%), by Country 2024 & 2032
- Figure 39: Europe IVD Quality Control Industry Revenue (Million), by Products and Services 2024 & 2032
- Figure 40: Europe IVD Quality Control Industry Volume (K Unit), by Products and Services 2024 & 2032
- Figure 41: Europe IVD Quality Control Industry Revenue Share (%), by Products and Services 2024 & 2032
- Figure 42: Europe IVD Quality Control Industry Volume Share (%), by Products and Services 2024 & 2032
- Figure 43: Europe IVD Quality Control Industry Revenue (Million), by Application 2024 & 2032
- Figure 44: Europe IVD Quality Control Industry Volume (K Unit), by Application 2024 & 2032
- Figure 45: Europe IVD Quality Control Industry Revenue Share (%), by Application 2024 & 2032
- Figure 46: Europe IVD Quality Control Industry Volume Share (%), by Application 2024 & 2032
- Figure 47: Europe IVD Quality Control Industry Revenue (Million), by End Users 2024 & 2032
- Figure 48: Europe IVD Quality Control Industry Volume (K Unit), by End Users 2024 & 2032
- Figure 49: Europe IVD Quality Control Industry Revenue Share (%), by End Users 2024 & 2032
- Figure 50: Europe IVD Quality Control Industry Volume Share (%), by End Users 2024 & 2032
- Figure 51: Europe IVD Quality Control Industry Revenue (Million), by Country 2024 & 2032
- Figure 52: Europe IVD Quality Control Industry Volume (K Unit), by Country 2024 & 2032
- Figure 53: Europe IVD Quality Control Industry Revenue Share (%), by Country 2024 & 2032
- Figure 54: Europe IVD Quality Control Industry Volume Share (%), by Country 2024 & 2032
- Figure 55: Asia Pacific IVD Quality Control Industry Revenue (Million), by Products and Services 2024 & 2032
- Figure 56: Asia Pacific IVD Quality Control Industry Volume (K Unit), by Products and Services 2024 & 2032
- Figure 57: Asia Pacific IVD Quality Control Industry Revenue Share (%), by Products and Services 2024 & 2032
- Figure 58: Asia Pacific IVD Quality Control Industry Volume Share (%), by Products and Services 2024 & 2032
- Figure 59: Asia Pacific IVD Quality Control Industry Revenue (Million), by Application 2024 & 2032
- Figure 60: Asia Pacific IVD Quality Control Industry Volume (K Unit), by Application 2024 & 2032
- Figure 61: Asia Pacific IVD Quality Control Industry Revenue Share (%), by Application 2024 & 2032
- Figure 62: Asia Pacific IVD Quality Control Industry Volume Share (%), by Application 2024 & 2032
- Figure 63: Asia Pacific IVD Quality Control Industry Revenue (Million), by End Users 2024 & 2032
- Figure 64: Asia Pacific IVD Quality Control Industry Volume (K Unit), by End Users 2024 & 2032
- Figure 65: Asia Pacific IVD Quality Control Industry Revenue Share (%), by End Users 2024 & 2032
- Figure 66: Asia Pacific IVD Quality Control Industry Volume Share (%), by End Users 2024 & 2032
- Figure 67: Asia Pacific IVD Quality Control Industry Revenue (Million), by Country 2024 & 2032
- Figure 68: Asia Pacific IVD Quality Control Industry Volume (K Unit), by Country 2024 & 2032
- Figure 69: Asia Pacific IVD Quality Control Industry Revenue Share (%), by Country 2024 & 2032
- Figure 70: Asia Pacific IVD Quality Control Industry Volume Share (%), by Country 2024 & 2032
- Figure 71: Middle East and Africa IVD Quality Control Industry Revenue (Million), by Products and Services 2024 & 2032
- Figure 72: Middle East and Africa IVD Quality Control Industry Volume (K Unit), by Products and Services 2024 & 2032
- Figure 73: Middle East and Africa IVD Quality Control Industry Revenue Share (%), by Products and Services 2024 & 2032
- Figure 74: Middle East and Africa IVD Quality Control Industry Volume Share (%), by Products and Services 2024 & 2032
- Figure 75: Middle East and Africa IVD Quality Control Industry Revenue (Million), by Application 2024 & 2032
- Figure 76: Middle East and Africa IVD Quality Control Industry Volume (K Unit), by Application 2024 & 2032
- Figure 77: Middle East and Africa IVD Quality Control Industry Revenue Share (%), by Application 2024 & 2032
- Figure 78: Middle East and Africa IVD Quality Control Industry Volume Share (%), by Application 2024 & 2032
- Figure 79: Middle East and Africa IVD Quality Control Industry Revenue (Million), by End Users 2024 & 2032
- Figure 80: Middle East and Africa IVD Quality Control Industry Volume (K Unit), by End Users 2024 & 2032
- Figure 81: Middle East and Africa IVD Quality Control Industry Revenue Share (%), by End Users 2024 & 2032
- Figure 82: Middle East and Africa IVD Quality Control Industry Volume Share (%), by End Users 2024 & 2032
- Figure 83: Middle East and Africa IVD Quality Control Industry Revenue (Million), by Country 2024 & 2032
- Figure 84: Middle East and Africa IVD Quality Control Industry Volume (K Unit), by Country 2024 & 2032
- Figure 85: Middle East and Africa IVD Quality Control Industry Revenue Share (%), by Country 2024 & 2032
- Figure 86: Middle East and Africa IVD Quality Control Industry Volume Share (%), by Country 2024 & 2032
- Figure 87: South America IVD Quality Control Industry Revenue (Million), by Products and Services 2024 & 2032
- Figure 88: South America IVD Quality Control Industry Volume (K Unit), by Products and Services 2024 & 2032
- Figure 89: South America IVD Quality Control Industry Revenue Share (%), by Products and Services 2024 & 2032
- Figure 90: South America IVD Quality Control Industry Volume Share (%), by Products and Services 2024 & 2032
- Figure 91: South America IVD Quality Control Industry Revenue (Million), by Application 2024 & 2032
- Figure 92: South America IVD Quality Control Industry Volume (K Unit), by Application 2024 & 2032
- Figure 93: South America IVD Quality Control Industry Revenue Share (%), by Application 2024 & 2032
- Figure 94: South America IVD Quality Control Industry Volume Share (%), by Application 2024 & 2032
- Figure 95: South America IVD Quality Control Industry Revenue (Million), by End Users 2024 & 2032
- Figure 96: South America IVD Quality Control Industry Volume (K Unit), by End Users 2024 & 2032
- Figure 97: South America IVD Quality Control Industry Revenue Share (%), by End Users 2024 & 2032
- Figure 98: South America IVD Quality Control Industry Volume Share (%), by End Users 2024 & 2032
- Figure 99: South America IVD Quality Control Industry Revenue (Million), by Country 2024 & 2032
- Figure 100: South America IVD Quality Control Industry Volume (K Unit), by Country 2024 & 2032
- Figure 101: South America IVD Quality Control Industry Revenue Share (%), by Country 2024 & 2032
- Figure 102: South America IVD Quality Control Industry Volume Share (%), by Country 2024 & 2032
List of Tables
- Table 1: Global IVD Quality Control Industry Revenue Million Forecast, by Region 2019 & 2032
- Table 2: Global IVD Quality Control Industry Volume K Unit Forecast, by Region 2019 & 2032
- Table 3: Global IVD Quality Control Industry Revenue Million Forecast, by Products and Services 2019 & 2032
- Table 4: Global IVD Quality Control Industry Volume K Unit Forecast, by Products and Services 2019 & 2032
- Table 5: Global IVD Quality Control Industry Revenue Million Forecast, by Application 2019 & 2032
- Table 6: Global IVD Quality Control Industry Volume K Unit Forecast, by Application 2019 & 2032
- Table 7: Global IVD Quality Control Industry Revenue Million Forecast, by End Users 2019 & 2032
- Table 8: Global IVD Quality Control Industry Volume K Unit Forecast, by End Users 2019 & 2032
- Table 9: Global IVD Quality Control Industry Revenue Million Forecast, by Region 2019 & 2032
- Table 10: Global IVD Quality Control Industry Volume K Unit Forecast, by Region 2019 & 2032
- Table 11: Global IVD Quality Control Industry Revenue Million Forecast, by Country 2019 & 2032
- Table 12: Global IVD Quality Control Industry Volume K Unit Forecast, by Country 2019 & 2032
- Table 13: United States IVD Quality Control Industry Revenue (Million) Forecast, by Application 2019 & 2032
- Table 14: United States IVD Quality Control Industry Volume (K Unit) Forecast, by Application 2019 & 2032
- Table 15: Canada IVD Quality Control Industry Revenue (Million) Forecast, by Application 2019 & 2032
- Table 16: Canada IVD Quality Control Industry Volume (K Unit) Forecast, by Application 2019 & 2032
- Table 17: Mexico IVD Quality Control Industry Revenue (Million) Forecast, by Application 2019 & 2032
- Table 18: Mexico IVD Quality Control Industry Volume (K Unit) Forecast, by Application 2019 & 2032
- Table 19: Global IVD Quality Control Industry Revenue Million Forecast, by Country 2019 & 2032
- Table 20: Global IVD Quality Control Industry Volume K Unit Forecast, by Country 2019 & 2032
- Table 21: Brazil IVD Quality Control Industry Revenue (Million) Forecast, by Application 2019 & 2032
- Table 22: Brazil IVD Quality Control Industry Volume (K Unit) Forecast, by Application 2019 & 2032
- Table 23: Mexico IVD Quality Control Industry Revenue (Million) Forecast, by Application 2019 & 2032
- Table 24: Mexico IVD Quality Control Industry Volume (K Unit) Forecast, by Application 2019 & 2032
- Table 25: Rest of South America IVD Quality Control Industry Revenue (Million) Forecast, by Application 2019 & 2032
- Table 26: Rest of South America IVD Quality Control Industry Volume (K Unit) Forecast, by Application 2019 & 2032
- Table 27: Global IVD Quality Control Industry Revenue Million Forecast, by Country 2019 & 2032
- Table 28: Global IVD Quality Control Industry Volume K Unit Forecast, by Country 2019 & 2032
- Table 29: Germany IVD Quality Control Industry Revenue (Million) Forecast, by Application 2019 & 2032
- Table 30: Germany IVD Quality Control Industry Volume (K Unit) Forecast, by Application 2019 & 2032
- Table 31: United Kingdom IVD Quality Control Industry Revenue (Million) Forecast, by Application 2019 & 2032
- Table 32: United Kingdom IVD Quality Control Industry Volume (K Unit) Forecast, by Application 2019 & 2032
- Table 33: France IVD Quality Control Industry Revenue (Million) Forecast, by Application 2019 & 2032
- Table 34: France IVD Quality Control Industry Volume (K Unit) Forecast, by Application 2019 & 2032
- Table 35: Italy IVD Quality Control Industry Revenue (Million) Forecast, by Application 2019 & 2032
- Table 36: Italy IVD Quality Control Industry Volume (K Unit) Forecast, by Application 2019 & 2032
- Table 37: Spain IVD Quality Control Industry Revenue (Million) Forecast, by Application 2019 & 2032
- Table 38: Spain IVD Quality Control Industry Volume (K Unit) Forecast, by Application 2019 & 2032
- Table 39: Rest of Europe IVD Quality Control Industry Revenue (Million) Forecast, by Application 2019 & 2032
- Table 40: Rest of Europe IVD Quality Control Industry Volume (K Unit) Forecast, by Application 2019 & 2032
- Table 41: Global IVD Quality Control Industry Revenue Million Forecast, by Country 2019 & 2032
- Table 42: Global IVD Quality Control Industry Volume K Unit Forecast, by Country 2019 & 2032
- Table 43: China IVD Quality Control Industry Revenue (Million) Forecast, by Application 2019 & 2032
- Table 44: China IVD Quality Control Industry Volume (K Unit) Forecast, by Application 2019 & 2032
- Table 45: Japan IVD Quality Control Industry Revenue (Million) Forecast, by Application 2019 & 2032
- Table 46: Japan IVD Quality Control Industry Volume (K Unit) Forecast, by Application 2019 & 2032
- Table 47: India IVD Quality Control Industry Revenue (Million) Forecast, by Application 2019 & 2032
- Table 48: India IVD Quality Control Industry Volume (K Unit) Forecast, by Application 2019 & 2032
- Table 49: South Korea IVD Quality Control Industry Revenue (Million) Forecast, by Application 2019 & 2032
- Table 50: South Korea IVD Quality Control Industry Volume (K Unit) Forecast, by Application 2019 & 2032
- Table 51: Taiwan IVD Quality Control Industry Revenue (Million) Forecast, by Application 2019 & 2032
- Table 52: Taiwan IVD Quality Control Industry Volume (K Unit) Forecast, by Application 2019 & 2032
- Table 53: Australia IVD Quality Control Industry Revenue (Million) Forecast, by Application 2019 & 2032
- Table 54: Australia IVD Quality Control Industry Volume (K Unit) Forecast, by Application 2019 & 2032
- Table 55: Rest of Asia-Pacific IVD Quality Control Industry Revenue (Million) Forecast, by Application 2019 & 2032
- Table 56: Rest of Asia-Pacific IVD Quality Control Industry Volume (K Unit) Forecast, by Application 2019 & 2032
- Table 57: Global IVD Quality Control Industry Revenue Million Forecast, by Country 2019 & 2032
- Table 58: Global IVD Quality Control Industry Volume K Unit Forecast, by Country 2019 & 2032
- Table 59: Middle East IVD Quality Control Industry Revenue (Million) Forecast, by Application 2019 & 2032
- Table 60: Middle East IVD Quality Control Industry Volume (K Unit) Forecast, by Application 2019 & 2032
- Table 61: Africa IVD Quality Control Industry Revenue (Million) Forecast, by Application 2019 & 2032
- Table 62: Africa IVD Quality Control Industry Volume (K Unit) Forecast, by Application 2019 & 2032
- Table 63: Global IVD Quality Control Industry Revenue Million Forecast, by Products and Services 2019 & 2032
- Table 64: Global IVD Quality Control Industry Volume K Unit Forecast, by Products and Services 2019 & 2032
- Table 65: Global IVD Quality Control Industry Revenue Million Forecast, by Application 2019 & 2032
- Table 66: Global IVD Quality Control Industry Volume K Unit Forecast, by Application 2019 & 2032
- Table 67: Global IVD Quality Control Industry Revenue Million Forecast, by End Users 2019 & 2032
- Table 68: Global IVD Quality Control Industry Volume K Unit Forecast, by End Users 2019 & 2032
- Table 69: Global IVD Quality Control Industry Revenue Million Forecast, by Country 2019 & 2032
- Table 70: Global IVD Quality Control Industry Volume K Unit Forecast, by Country 2019 & 2032
- Table 71: United States IVD Quality Control Industry Revenue (Million) Forecast, by Application 2019 & 2032
- Table 72: United States IVD Quality Control Industry Volume (K Unit) Forecast, by Application 2019 & 2032
- Table 73: Canada IVD Quality Control Industry Revenue (Million) Forecast, by Application 2019 & 2032
- Table 74: Canada IVD Quality Control Industry Volume (K Unit) Forecast, by Application 2019 & 2032
- Table 75: Mexico IVD Quality Control Industry Revenue (Million) Forecast, by Application 2019 & 2032
- Table 76: Mexico IVD Quality Control Industry Volume (K Unit) Forecast, by Application 2019 & 2032
- Table 77: Global IVD Quality Control Industry Revenue Million Forecast, by Products and Services 2019 & 2032
- Table 78: Global IVD Quality Control Industry Volume K Unit Forecast, by Products and Services 2019 & 2032
- Table 79: Global IVD Quality Control Industry Revenue Million Forecast, by Application 2019 & 2032
- Table 80: Global IVD Quality Control Industry Volume K Unit Forecast, by Application 2019 & 2032
- Table 81: Global IVD Quality Control Industry Revenue Million Forecast, by End Users 2019 & 2032
- Table 82: Global IVD Quality Control Industry Volume K Unit Forecast, by End Users 2019 & 2032
- Table 83: Global IVD Quality Control Industry Revenue Million Forecast, by Country 2019 & 2032
- Table 84: Global IVD Quality Control Industry Volume K Unit Forecast, by Country 2019 & 2032
- Table 85: Germany IVD Quality Control Industry Revenue (Million) Forecast, by Application 2019 & 2032
- Table 86: Germany IVD Quality Control Industry Volume (K Unit) Forecast, by Application 2019 & 2032
- Table 87: United Kingdom IVD Quality Control Industry Revenue (Million) Forecast, by Application 2019 & 2032
- Table 88: United Kingdom IVD Quality Control Industry Volume (K Unit) Forecast, by Application 2019 & 2032
- Table 89: France IVD Quality Control Industry Revenue (Million) Forecast, by Application 2019 & 2032
- Table 90: France IVD Quality Control Industry Volume (K Unit) Forecast, by Application 2019 & 2032
- Table 91: Italy IVD Quality Control Industry Revenue (Million) Forecast, by Application 2019 & 2032
- Table 92: Italy IVD Quality Control Industry Volume (K Unit) Forecast, by Application 2019 & 2032
- Table 93: Spain IVD Quality Control Industry Revenue (Million) Forecast, by Application 2019 & 2032
- Table 94: Spain IVD Quality Control Industry Volume (K Unit) Forecast, by Application 2019 & 2032
- Table 95: Rest of Europe IVD Quality Control Industry Revenue (Million) Forecast, by Application 2019 & 2032
- Table 96: Rest of Europe IVD Quality Control Industry Volume (K Unit) Forecast, by Application 2019 & 2032
- Table 97: Global IVD Quality Control Industry Revenue Million Forecast, by Products and Services 2019 & 2032
- Table 98: Global IVD Quality Control Industry Volume K Unit Forecast, by Products and Services 2019 & 2032
- Table 99: Global IVD Quality Control Industry Revenue Million Forecast, by Application 2019 & 2032
- Table 100: Global IVD Quality Control Industry Volume K Unit Forecast, by Application 2019 & 2032
- Table 101: Global IVD Quality Control Industry Revenue Million Forecast, by End Users 2019 & 2032
- Table 102: Global IVD Quality Control Industry Volume K Unit Forecast, by End Users 2019 & 2032
- Table 103: Global IVD Quality Control Industry Revenue Million Forecast, by Country 2019 & 2032
- Table 104: Global IVD Quality Control Industry Volume K Unit Forecast, by Country 2019 & 2032
- Table 105: China IVD Quality Control Industry Revenue (Million) Forecast, by Application 2019 & 2032
- Table 106: China IVD Quality Control Industry Volume (K Unit) Forecast, by Application 2019 & 2032
- Table 107: Japan IVD Quality Control Industry Revenue (Million) Forecast, by Application 2019 & 2032
- Table 108: Japan IVD Quality Control Industry Volume (K Unit) Forecast, by Application 2019 & 2032
- Table 109: India IVD Quality Control Industry Revenue (Million) Forecast, by Application 2019 & 2032
- Table 110: India IVD Quality Control Industry Volume (K Unit) Forecast, by Application 2019 & 2032
- Table 111: Australia IVD Quality Control Industry Revenue (Million) Forecast, by Application 2019 & 2032
- Table 112: Australia IVD Quality Control Industry Volume (K Unit) Forecast, by Application 2019 & 2032
- Table 113: South Korea IVD Quality Control Industry Revenue (Million) Forecast, by Application 2019 & 2032
- Table 114: South Korea IVD Quality Control Industry Volume (K Unit) Forecast, by Application 2019 & 2032
- Table 115: Rest of Asia Pacific IVD Quality Control Industry Revenue (Million) Forecast, by Application 2019 & 2032
- Table 116: Rest of Asia Pacific IVD Quality Control Industry Volume (K Unit) Forecast, by Application 2019 & 2032
- Table 117: Global IVD Quality Control Industry Revenue Million Forecast, by Products and Services 2019 & 2032
- Table 118: Global IVD Quality Control Industry Volume K Unit Forecast, by Products and Services 2019 & 2032
- Table 119: Global IVD Quality Control Industry Revenue Million Forecast, by Application 2019 & 2032
- Table 120: Global IVD Quality Control Industry Volume K Unit Forecast, by Application 2019 & 2032
- Table 121: Global IVD Quality Control Industry Revenue Million Forecast, by End Users 2019 & 2032
- Table 122: Global IVD Quality Control Industry Volume K Unit Forecast, by End Users 2019 & 2032
- Table 123: Global IVD Quality Control Industry Revenue Million Forecast, by Country 2019 & 2032
- Table 124: Global IVD Quality Control Industry Volume K Unit Forecast, by Country 2019 & 2032
- Table 125: GCC IVD Quality Control Industry Revenue (Million) Forecast, by Application 2019 & 2032
- Table 126: GCC IVD Quality Control Industry Volume (K Unit) Forecast, by Application 2019 & 2032
- Table 127: South Africa IVD Quality Control Industry Revenue (Million) Forecast, by Application 2019 & 2032
- Table 128: South Africa IVD Quality Control Industry Volume (K Unit) Forecast, by Application 2019 & 2032
- Table 129: Rest of Middle East and Africa IVD Quality Control Industry Revenue (Million) Forecast, by Application 2019 & 2032
- Table 130: Rest of Middle East and Africa IVD Quality Control Industry Volume (K Unit) Forecast, by Application 2019 & 2032
- Table 131: Global IVD Quality Control Industry Revenue Million Forecast, by Products and Services 2019 & 2032
- Table 132: Global IVD Quality Control Industry Volume K Unit Forecast, by Products and Services 2019 & 2032
- Table 133: Global IVD Quality Control Industry Revenue Million Forecast, by Application 2019 & 2032
- Table 134: Global IVD Quality Control Industry Volume K Unit Forecast, by Application 2019 & 2032
- Table 135: Global IVD Quality Control Industry Revenue Million Forecast, by End Users 2019 & 2032
- Table 136: Global IVD Quality Control Industry Volume K Unit Forecast, by End Users 2019 & 2032
- Table 137: Global IVD Quality Control Industry Revenue Million Forecast, by Country 2019 & 2032
- Table 138: Global IVD Quality Control Industry Volume K Unit Forecast, by Country 2019 & 2032
- Table 139: Brazil IVD Quality Control Industry Revenue (Million) Forecast, by Application 2019 & 2032
- Table 140: Brazil IVD Quality Control Industry Volume (K Unit) Forecast, by Application 2019 & 2032
- Table 141: Argentina IVD Quality Control Industry Revenue (Million) Forecast, by Application 2019 & 2032
- Table 142: Argentina IVD Quality Control Industry Volume (K Unit) Forecast, by Application 2019 & 2032
- Table 143: Rest of South America IVD Quality Control Industry Revenue (Million) Forecast, by Application 2019 & 2032
- Table 144: Rest of South America IVD Quality Control Industry Volume (K Unit) Forecast, by Application 2019 & 2032
Frequently Asked Questions
1. What is the projected Compound Annual Growth Rate (CAGR) of the IVD Quality Control Industry?
The projected CAGR is approximately 3.50%.
2. Which companies are prominent players in the IVD Quality Control Industry?
Key companies in the market include Quidel Corporation, Qnostics Ltd, Microbiologics Inc, Bio-Rad Laboratories Inc, ZeptoMetrix Corporation, Abbott Laboratories, bioMerieux Inc, F Hoffmann-La Roche AG, SeraCare Life Sciences Inc, Thermo Fisher Scientific.
3. What are the main segments of the IVD Quality Control Industry?
The market segments include Products and Services, Application, End Users.
4. Can you provide details about the market size?
The market size is estimated to be USD XX Million as of 2022.
5. What are some drivers contributing to market growth?
Increased Demand for Advanced Diagnostics for Sensitive Reports and Accurate Diagnosis; Rise in Global Incidence of Infectious Diseases. Cancers and Genetic Disorders; Rise in the Volume of Accredited Clinical Laboratories and Adoption of Third-Party Quality Controls.
6. What are the notable trends driving market growth?
Molecular Diagnostics Segment is Expected to Register a Significant CAGR in the In-Vitro Diagnostics Quality Control Market Over the Forecast Period.
7. Are there any restraints impacting market growth?
Unfavorable Reimbursement Policies for IVD Industry; Lack of Stringent Regulations for Clinical Laboratory Accreditation in Several Emerging Economies.
8. Can you provide examples of recent developments in the market?
In July 2022, BrightSight Inc. launched a digital Connected Diagnostics Platform at the 2022 AACC Annual Scientific Meeting and Clinical Lab Expo. This diagnostic platform is developed for in vitro diagnostics manufacturers that streamline workflows. It includes a Proxy Agent, Analytics Dashboards, Integration Middleware, and Workflow Portals.
9. What pricing options are available for accessing the report?
Pricing options include single-user, multi-user, and enterprise licenses priced at USD 4750, USD 5250, and USD 8750 respectively.
10. Is the market size provided in terms of value or volume?
The market size is provided in terms of value, measured in Million and volume, measured in K Unit.
11. Are there any specific market keywords associated with the report?
Yes, the market keyword associated with the report is "IVD Quality Control Industry," which aids in identifying and referencing the specific market segment covered.
12. How do I determine which pricing option suits my needs best?
The pricing options vary based on user requirements and access needs. Individual users may opt for single-user licenses, while businesses requiring broader access may choose multi-user or enterprise licenses for cost-effective access to the report.
13. Are there any additional resources or data provided in the IVD Quality Control Industry report?
While the report offers comprehensive insights, it's advisable to review the specific contents or supplementary materials provided to ascertain if additional resources or data are available.
14. How can I stay updated on further developments or reports in the IVD Quality Control Industry?
To stay informed about further developments, trends, and reports in the IVD Quality Control Industry, consider subscribing to industry newsletters, following relevant companies and organizations, or regularly checking reputable industry news sources and publications.
Methodology
Step 1 - Identification of Relevant Samples Size from Population Database


Step 2 - Approaches for Defining Global Market Size (Value, Volume* & Price*)

Note*: In applicable scenarios
Step 3 - Data Sources
Primary Research
- Web Analytics
- Survey Reports
- Research Institute
- Latest Research Reports
- Opinion Leaders
Secondary Research
- Annual Reports
- White Paper
- Latest Press Release
- Industry Association
- Paid Database
- Investor Presentations

Step 4 - Data Triangulation
Involves using different sources of information in order to increase the validity of a study
These sources are likely to be stakeholders in a program - participants, other researchers, program staff, other community members, and so on.
Then we put all data in single framework & apply various statistical tools to find out the dynamic on the market.
During the analysis stage, feedback from the stakeholder groups would be compared to determine areas of agreement as well as areas of divergence
