

Key Insights
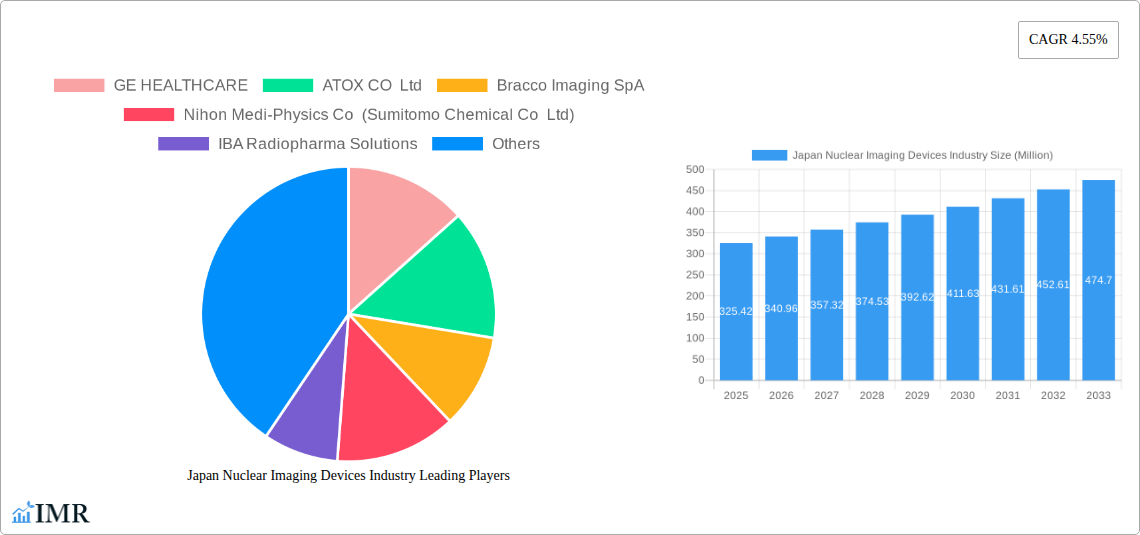
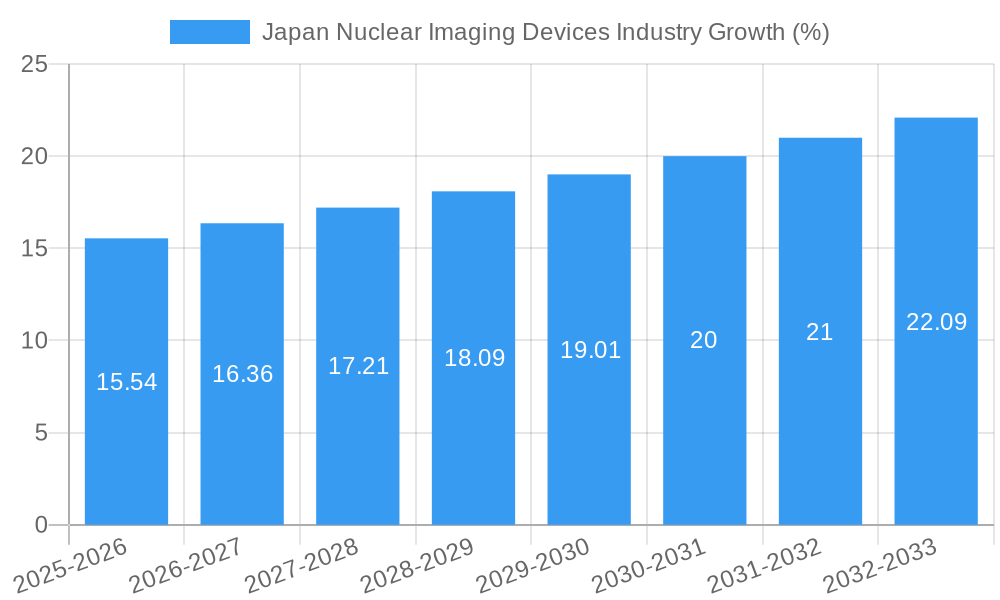
The Japan nuclear imaging devices market, valued at ¥325.42 million in 2025, is projected to experience robust growth, driven by a Compound Annual Growth Rate (CAGR) of 4.55% from 2025 to 2033. This expansion is fueled by several key factors. Increasing prevalence of chronic diseases like cancer, cardiovascular disorders, and neurological conditions necessitates advanced diagnostic tools. Technological advancements in SPECT, PET, and hybrid imaging systems are improving image quality, reducing scan times, and enhancing diagnostic accuracy. The growing geriatric population in Japan further contributes to market demand as older adults are more susceptible to these diseases. Furthermore, government initiatives focused on improving healthcare infrastructure and expanding access to advanced diagnostic technologies are positively impacting market growth. Increased investment in research and development within the medical imaging sector is leading to the introduction of innovative systems with enhanced capabilities.
However, the market faces certain challenges. High costs associated with purchasing, maintaining, and operating sophisticated nuclear imaging devices can limit accessibility, particularly in smaller hospitals and clinics. The stringent regulatory environment surrounding radiation safety and the handling of radioactive materials presents another hurdle for market expansion. Competition among established players like GE Healthcare, Siemens Healthineers, and Fujifilm, alongside emerging companies, creates a dynamic landscape. Despite these restraints, the market's long-term outlook remains positive, propelled by continuous technological innovation, rising healthcare expenditure, and a growing need for precise and timely diagnosis across various medical specialties. Strategic partnerships, collaborations, and the adoption of innovative financing models could effectively address the cost barriers and propel faster market growth.
Japan Nuclear Imaging Devices Industry: Market Report 2019-2033
This comprehensive report provides an in-depth analysis of the Japan nuclear imaging devices industry, covering market dynamics, growth trends, key players, and future outlook. With a focus on the parent market of medical imaging and the child market of nuclear medicine imaging, this report is essential for industry professionals, investors, and researchers seeking to understand this vital sector. The report analyzes market trends from 2019-2024 (historical period), with estimates for 2025 (base and estimated year) and a forecast extending to 2033. Market values are presented in million units.
Japan Nuclear Imaging Devices Industry Market Dynamics & Structure
The Japanese nuclear imaging devices market is characterized by a moderately concentrated landscape, with key players like GE Healthcare, Siemens Healthineers, and Fujifilm holding significant market share (xx%). Technological innovation, driven by advancements in SPECT, PET, and hybrid systems, is a primary growth driver. Stringent regulatory frameworks, including those set by the Pharmaceuticals and Medical Devices Agency (PMDA), shape product development and market entry. The market faces competition from alternative diagnostic imaging techniques like MRI and CT scans, but the unique capabilities of nuclear imaging maintain its demand, particularly in oncology and cardiology. M&A activity has been relatively moderate in recent years, with xx deals recorded between 2019 and 2024, primarily focused on enhancing product portfolios and expanding geographical reach.
- Market Concentration: Moderately concentrated, with top 5 players holding xx% market share.
- Technological Innovation: Advancements in SPECT/CT, PET/CT, and hybrid systems are key drivers.
- Regulatory Framework: PMDA regulations significantly influence market dynamics.
- Competitive Substitutes: MRI, CT scans pose competition, but nuclear imaging retains niche applications.
- End-User Demographics: Hospitals and specialized imaging centers dominate end-user segment.
- M&A Activity: xx M&A deals recorded between 2019-2024, primarily focused on portfolio expansion.
Japan Nuclear Imaging Devices Industry Growth Trends & Insights
The Japanese nuclear imaging devices market exhibited a CAGR of xx% during the historical period (2019-2024), reaching a market size of xx million units in 2024. Growth is driven by an aging population, increasing prevalence of chronic diseases (particularly cancer and cardiovascular diseases), and rising healthcare expenditure. The adoption rate of advanced imaging technologies like hybrid SPECT/CT and PET/CT systems is steadily increasing, replacing standalone SPECT systems in many applications. Technological advancements, such as improved image resolution and faster scan times, are contributing to market expansion. A shift towards personalized medicine is also influencing demand, as nuclear imaging plays a critical role in targeted therapy selection and treatment monitoring. The forecast period (2025-2033) projects continued growth, with a projected CAGR of xx%, driven by factors such as increasing government investments in healthcare infrastructure, the rising prevalence of chronic diseases, and continued technological innovations in this field.
Dominant Regions, Countries, or Segments in Japan Nuclear Imaging Devices Industry
The Kanto region, encompassing Tokyo and surrounding prefectures, represents the largest segment within the Japanese nuclear imaging devices market, accounting for approximately xx% of the total market size in 2024. This dominance is attributed to the high concentration of hospitals, advanced medical facilities, and research institutions within this region. The Oncology application segment holds the largest market share due to the increasing incidence of cancer and the crucial role of nuclear imaging in diagnosis, staging, and treatment monitoring. Hospitals are the primary end-users, representing xx% of the market. The continued growth of this sector is projected to be driven by factors such as an aging population, advancements in cancer therapies, and increased government spending on healthcare.
- Leading Region: Kanto region (Tokyo and surrounding prefectures)
- Dominant Application: Oncology
- Primary End-User: Hospitals
- Key Growth Drivers: Aging population, rising cancer incidence, technological advancements.
Japan Nuclear Imaging Devices Industry Product Landscape
The Japanese market offers a diverse range of nuclear imaging devices, including Single Photon Emission Computed Tomography (SPECT), Positron Emission Tomography (PET), hybrid SPECT/CT and PET/CT systems, and planar scintigraphy systems. Recent innovations focus on improved image quality, reduced radiation exposure, and faster scan times. Hybrid systems, integrating SPECT or PET with CT, are gaining popularity due to their enhanced diagnostic capabilities. Unique selling propositions include advanced image reconstruction algorithms, user-friendly interfaces, and streamlined workflows.
Key Drivers, Barriers & Challenges in Japan Nuclear Imaging Devices Industry
Key Drivers:
- Rising prevalence of chronic diseases (cancer, cardiovascular disease).
- Increasing healthcare expenditure and government investments in healthcare infrastructure.
- Technological advancements in nuclear imaging technology.
- Growing demand for early and accurate diagnosis.
Challenges:
- High cost of equipment and radiopharmaceuticals.
- Stringent regulatory approvals, potentially creating market entry barriers.
- Competition from alternative imaging modalities (MRI, CT).
- Limited availability of trained personnel in some areas. This issue may lead to a xx% reduction in the overall market growth by 2033.
Emerging Opportunities in Japan Nuclear Imaging Devices Industry
- Growing demand for molecular imaging techniques.
- Increasing adoption of AI-driven image analysis tools.
- Expansion into new applications such as neurology and gastroenterology.
- Potential for development of targeted radiopharmaceuticals for personalized medicine.
Growth Accelerators in the Japan Nuclear Imaging Devices Industry
Technological advancements, particularly in hybrid systems and AI-assisted image analysis, coupled with strategic partnerships between device manufacturers and radiopharmaceutical companies, are key growth catalysts. Expansion into underserved regional markets and increased collaboration with research institutions further drive market growth. The growing emphasis on preventive healthcare, early disease detection, and personalized medicine are significant long-term growth drivers.
Key Players Shaping the Japan Nuclear Imaging Devices Market
- GE HEALTHCARE
- ATOX CO Ltd
- Bracco Imaging SpA
- Nihon Medi-Physics Co (Sumitomo Chemical Co Ltd)
- IBA Radiopharma Solutions
- Fujifilm (FUJIFILM Toyama Chemical Co Ltd)
- CANON INC
- Koninklijke Philips NV
- Siemens Healthineers
- JFE Engineering Corporation
Notable Milestones in Japan Nuclear Imaging Devices Industry Sector
- Oct 2022: The IAEA redesignated National Institutes for Quantum Science and Technology (QST) as a Collaborating Centre until 2026, boosting research and development in nuclear medicine imaging.
- Aug 2022: PeptiDream Inc.'s partnership with RayzeBio Inc. expands radiopharmaceutical development and commercialization opportunities in Japan.
- Jan 2021: Fuzionaire Radioisotope Technologies K.K.'s collaboration with Nihon Medi-Physics Co. Ltd. accelerates radiopharmaceutical technology development and market entry.
In-Depth Japan Nuclear Imaging Devices Industry Market Outlook
The Japanese nuclear imaging devices market is poised for significant growth over the forecast period (2025-2033), driven by technological advancements, increased healthcare spending, and the rising prevalence of chronic diseases. Strategic partnerships, market expansion into underserved areas, and the development of innovative imaging techniques will further enhance market potential. Companies focusing on developing advanced hybrid systems and incorporating AI into their offerings are expected to gain a competitive edge. The long-term prospects for this market remain positive, promising substantial opportunities for growth and innovation.
Japan Nuclear Imaging Devices Industry Segmentation
-
1. Product
- 1.1. Equipment
-
1.2. Radioisotope
-
1.2.1. SPECT Radioisotopes
- 1.2.1.1. Technetium-99m (TC-99m)
- 1.2.1.2. Thallium-201 (TI-201)
- 1.2.1.3. Gallium (Ga-67)
- 1.2.1.4. Iodine (I-123)
- 1.2.1.5. Other SPECT Radioisotopes
-
1.2.2. PET Radioisotopes
- 1.2.2.1. Fluorine-18 (F-18)
- 1.2.2.2. Rubidium-82 (RB-82)
- 1.2.2.3. Other PET Radioisotopes
-
1.2.1. SPECT Radioisotopes
-
2. Application
-
2.1. SPECT Applications
- 2.1.1. Orthopedics
- 2.1.2. Thyroid
- 2.1.3. Cardiology
- 2.1.4. Other SPECT Applications
-
2.2. PET Applications
- 2.2.1. Oncology
- 2.2.2. Neurology
- 2.2.3. Other PET Applications
-
2.1. SPECT Applications
Japan Nuclear Imaging Devices Industry Segmentation By Geography
- 1. Japan
Japan Nuclear Imaging Devices Industry REPORT HIGHLIGHTS
| Aspects | Details |
|---|---|
| Study Period | 2019-2033 |
| Base Year | 2024 |
| Estimated Year | 2025 |
| Forecast Period | 2025-2033 |
| Historical Period | 2019-2024 |
| Growth Rate | CAGR of 4.55% from 2019-2033 |
| Segmentation |
|
Table of Contents
- 1. Introduction
- 1.1. Research Scope
- 1.2. Market Segmentation
- 1.3. Research Methodology
- 1.4. Definitions and Assumptions
- 2. Executive Summary
- 2.1. Introduction
- 3. Market Dynamics
- 3.1. Introduction
- 3.2. Market Drivers
- 3.2.1. Rise in Prevalence of Cancer and Cardiac Disorders; Increase in Technological Advancements; Growth in the Applications of Nuclear Medicine and Imaging
- 3.3. Market Restrains
- 3.3.1. High Cost of Techniques; Short Half-life of Radiopharmaceuticals
- 3.4. Market Trends
- 3.4.1. Oncology Segment is Expected to Witness Significant Growth Over the Forecast Period
- 4. Market Factor Analysis
- 4.1. Porters Five Forces
- 4.2. Supply/Value Chain
- 4.3. PESTEL analysis
- 4.4. Market Entropy
- 4.5. Patent/Trademark Analysis
- 5. Japan Nuclear Imaging Devices Industry Analysis, Insights and Forecast, 2019-2031
- 5.1. Market Analysis, Insights and Forecast - by Product
- 5.1.1. Equipment
- 5.1.2. Radioisotope
- 5.1.2.1. SPECT Radioisotopes
- 5.1.2.1.1. Technetium-99m (TC-99m)
- 5.1.2.1.2. Thallium-201 (TI-201)
- 5.1.2.1.3. Gallium (Ga-67)
- 5.1.2.1.4. Iodine (I-123)
- 5.1.2.1.5. Other SPECT Radioisotopes
- 5.1.2.2. PET Radioisotopes
- 5.1.2.2.1. Fluorine-18 (F-18)
- 5.1.2.2.2. Rubidium-82 (RB-82)
- 5.1.2.2.3. Other PET Radioisotopes
- 5.1.2.1. SPECT Radioisotopes
- 5.2. Market Analysis, Insights and Forecast - by Application
- 5.2.1. SPECT Applications
- 5.2.1.1. Orthopedics
- 5.2.1.2. Thyroid
- 5.2.1.3. Cardiology
- 5.2.1.4. Other SPECT Applications
- 5.2.2. PET Applications
- 5.2.2.1. Oncology
- 5.2.2.2. Neurology
- 5.2.2.3. Other PET Applications
- 5.2.1. SPECT Applications
- 5.3. Market Analysis, Insights and Forecast - by Region
- 5.3.1. Japan
- 5.1. Market Analysis, Insights and Forecast - by Product
- 6. Competitive Analysis
- 6.1. Market Share Analysis 2024
- 6.2. Company Profiles
- 6.2.1 GE HEALTHCARE
- 6.2.1.1. Overview
- 6.2.1.2. Products
- 6.2.1.3. SWOT Analysis
- 6.2.1.4. Recent Developments
- 6.2.1.5. Financials (Based on Availability)
- 6.2.2 ATOX CO Ltd
- 6.2.2.1. Overview
- 6.2.2.2. Products
- 6.2.2.3. SWOT Analysis
- 6.2.2.4. Recent Developments
- 6.2.2.5. Financials (Based on Availability)
- 6.2.3 Bracco Imaging SpA
- 6.2.3.1. Overview
- 6.2.3.2. Products
- 6.2.3.3. SWOT Analysis
- 6.2.3.4. Recent Developments
- 6.2.3.5. Financials (Based on Availability)
- 6.2.4 Nihon Medi-Physics Co (Sumitomo Chemical Co Ltd)
- 6.2.4.1. Overview
- 6.2.4.2. Products
- 6.2.4.3. SWOT Analysis
- 6.2.4.4. Recent Developments
- 6.2.4.5. Financials (Based on Availability)
- 6.2.5 IBA Radiopharma Solutions
- 6.2.5.1. Overview
- 6.2.5.2. Products
- 6.2.5.3. SWOT Analysis
- 6.2.5.4. Recent Developments
- 6.2.5.5. Financials (Based on Availability)
- 6.2.6 Fujifilm (FUJIFILM Toyama Chemical Co Ltd)
- 6.2.6.1. Overview
- 6.2.6.2. Products
- 6.2.6.3. SWOT Analysis
- 6.2.6.4. Recent Developments
- 6.2.6.5. Financials (Based on Availability)
- 6.2.7 CANON INC
- 6.2.7.1. Overview
- 6.2.7.2. Products
- 6.2.7.3. SWOT Analysis
- 6.2.7.4. Recent Developments
- 6.2.7.5. Financials (Based on Availability)
- 6.2.8 Koninklijke Philips NV
- 6.2.8.1. Overview
- 6.2.8.2. Products
- 6.2.8.3. SWOT Analysis
- 6.2.8.4. Recent Developments
- 6.2.8.5. Financials (Based on Availability)
- 6.2.9 Siemens Healthineers
- 6.2.9.1. Overview
- 6.2.9.2. Products
- 6.2.9.3. SWOT Analysis
- 6.2.9.4. Recent Developments
- 6.2.9.5. Financials (Based on Availability)
- 6.2.10 JFE Engineering Corporation
- 6.2.10.1. Overview
- 6.2.10.2. Products
- 6.2.10.3. SWOT Analysis
- 6.2.10.4. Recent Developments
- 6.2.10.5. Financials (Based on Availability)
- 6.2.1 GE HEALTHCARE
List of Figures
- Figure 1: Japan Nuclear Imaging Devices Industry Revenue Breakdown (Million, %) by Product 2024 & 2032
- Figure 2: Japan Nuclear Imaging Devices Industry Share (%) by Company 2024
List of Tables
- Table 1: Japan Nuclear Imaging Devices Industry Revenue Million Forecast, by Region 2019 & 2032
- Table 2: Japan Nuclear Imaging Devices Industry Volume K Units Forecast, by Region 2019 & 2032
- Table 3: Japan Nuclear Imaging Devices Industry Revenue Million Forecast, by Product 2019 & 2032
- Table 4: Japan Nuclear Imaging Devices Industry Volume K Units Forecast, by Product 2019 & 2032
- Table 5: Japan Nuclear Imaging Devices Industry Revenue Million Forecast, by Application 2019 & 2032
- Table 6: Japan Nuclear Imaging Devices Industry Volume K Units Forecast, by Application 2019 & 2032
- Table 7: Japan Nuclear Imaging Devices Industry Revenue Million Forecast, by Region 2019 & 2032
- Table 8: Japan Nuclear Imaging Devices Industry Volume K Units Forecast, by Region 2019 & 2032
- Table 9: Japan Nuclear Imaging Devices Industry Revenue Million Forecast, by Country 2019 & 2032
- Table 10: Japan Nuclear Imaging Devices Industry Volume K Units Forecast, by Country 2019 & 2032
- Table 11: Japan Nuclear Imaging Devices Industry Revenue Million Forecast, by Product 2019 & 2032
- Table 12: Japan Nuclear Imaging Devices Industry Volume K Units Forecast, by Product 2019 & 2032
- Table 13: Japan Nuclear Imaging Devices Industry Revenue Million Forecast, by Application 2019 & 2032
- Table 14: Japan Nuclear Imaging Devices Industry Volume K Units Forecast, by Application 2019 & 2032
- Table 15: Japan Nuclear Imaging Devices Industry Revenue Million Forecast, by Country 2019 & 2032
- Table 16: Japan Nuclear Imaging Devices Industry Volume K Units Forecast, by Country 2019 & 2032
Frequently Asked Questions
1. What is the projected Compound Annual Growth Rate (CAGR) of the Japan Nuclear Imaging Devices Industry?
The projected CAGR is approximately 4.55%.
2. Which companies are prominent players in the Japan Nuclear Imaging Devices Industry?
Key companies in the market include GE HEALTHCARE, ATOX CO Ltd, Bracco Imaging SpA, Nihon Medi-Physics Co (Sumitomo Chemical Co Ltd), IBA Radiopharma Solutions, Fujifilm (FUJIFILM Toyama Chemical Co Ltd), CANON INC, Koninklijke Philips NV, Siemens Healthineers, JFE Engineering Corporation.
3. What are the main segments of the Japan Nuclear Imaging Devices Industry?
The market segments include Product, Application.
4. Can you provide details about the market size?
The market size is estimated to be USD 325.42 Million as of 2022.
5. What are some drivers contributing to market growth?
Rise in Prevalence of Cancer and Cardiac Disorders; Increase in Technological Advancements; Growth in the Applications of Nuclear Medicine and Imaging.
6. What are the notable trends driving market growth?
Oncology Segment is Expected to Witness Significant Growth Over the Forecast Period.
7. Are there any restraints impacting market growth?
High Cost of Techniques; Short Half-life of Radiopharmaceuticals.
8. Can you provide examples of recent developments in the market?
Oct 2022: The IAEA redesignated National Institutes for Quantum Science and Technology (QST) as a Collaborating Centre until 2026 for radiation oncology, nuclear medicine and molecular imaging, dosimetry, and science technology and society.
9. What pricing options are available for accessing the report?
Pricing options include single-user, multi-user, and enterprise licenses priced at USD 3800, USD 4500, and USD 5800 respectively.
10. Is the market size provided in terms of value or volume?
The market size is provided in terms of value, measured in Million and volume, measured in K Units.
11. Are there any specific market keywords associated with the report?
Yes, the market keyword associated with the report is "Japan Nuclear Imaging Devices Industry," which aids in identifying and referencing the specific market segment covered.
12. How do I determine which pricing option suits my needs best?
The pricing options vary based on user requirements and access needs. Individual users may opt for single-user licenses, while businesses requiring broader access may choose multi-user or enterprise licenses for cost-effective access to the report.
13. Are there any additional resources or data provided in the Japan Nuclear Imaging Devices Industry report?
While the report offers comprehensive insights, it's advisable to review the specific contents or supplementary materials provided to ascertain if additional resources or data are available.
14. How can I stay updated on further developments or reports in the Japan Nuclear Imaging Devices Industry?
To stay informed about further developments, trends, and reports in the Japan Nuclear Imaging Devices Industry, consider subscribing to industry newsletters, following relevant companies and organizations, or regularly checking reputable industry news sources and publications.
Methodology
Step 1 - Identification of Relevant Samples Size from Population Database


Step 2 - Approaches for Defining Global Market Size (Value, Volume* & Price*)

Note*: In applicable scenarios
Step 3 - Data Sources
Primary Research
- Web Analytics
- Survey Reports
- Research Institute
- Latest Research Reports
- Opinion Leaders
Secondary Research
- Annual Reports
- White Paper
- Latest Press Release
- Industry Association
- Paid Database
- Investor Presentations

Step 4 - Data Triangulation
Involves using different sources of information in order to increase the validity of a study
These sources are likely to be stakeholders in a program - participants, other researchers, program staff, other community members, and so on.
Then we put all data in single framework & apply various statistical tools to find out the dynamic on the market.
During the analysis stage, feedback from the stakeholder groups would be compared to determine areas of agreement as well as areas of divergence
