

Key Insights
The Left Ventricular Assist Device (LVAD) market, a significant segment within the broader ventricular assist device market, is experiencing robust growth, projected to reach a substantial size driven by several key factors. The aging global population, coupled with increasing prevalence of heart failure, forms the bedrock of this expansion. Technological advancements leading to smaller, more efficient, and less invasive LVAD systems are significantly reducing complications and improving patient outcomes, thereby boosting market adoption. Furthermore, the increasing success rates of LVADs as a bridge-to-transplant (BTT) therapy and the growing acceptance of destination therapy (DT) are pivotal drivers. The market's growth is also fueled by supportive regulatory environments in key regions like North America and Europe, which facilitate product approvals and market entry. However, high costs associated with the devices, procedures, and long-term management remain a significant restraint. The need for skilled medical professionals to perform implantation and post-operative care further limits market penetration in regions with limited healthcare infrastructure. Nevertheless, ongoing research and development focused on improving device longevity, reducing complications, and lowering costs are expected to mitigate some of these challenges in the coming years.
Competition within the LVAD market is intense, with established players like Abiomed, Medtronic, and Abbott Laboratories vying for market share alongside emerging companies that are introducing innovative technologies. Strategic partnerships, mergers, and acquisitions are likely to continue shaping the competitive landscape, driving further innovation and potentially consolidation in the sector. Regional variations in healthcare expenditure, regulatory frameworks, and disease prevalence will influence market dynamics. North America, with its advanced healthcare infrastructure and high adoption rates of advanced medical technologies, is expected to maintain its dominant position. However, the Asia Pacific region, particularly China and India, presents a significant growth opportunity due to a rapidly expanding population, increasing healthcare spending, and rising prevalence of heart failure. Continued market expansion will depend on balancing technological progress with accessibility and affordability concerns to ensure wider patient access to life-saving LVAD technology.

LVAD Industry Market Report: 2019-2033
This comprehensive report provides a detailed analysis of the Left Ventricular Assist Device (LVAD) industry, encompassing market dynamics, growth trends, competitive landscape, and future outlook. The report covers the period 2019-2033, with a focus on the forecast period 2025-2033 and a base year of 2025. The total market size is projected to reach xx Billion by 2033. This in-depth analysis is essential for industry professionals, investors, and researchers seeking to understand and capitalize on opportunities within this rapidly evolving sector. The report analyzes both parent (Mechanical Circulatory Support Devices) and child (LVAD) markets.
LVAD Industry Market Dynamics & Structure
The LVAD market is characterized by a moderately concentrated structure with key players holding significant market share. Technological innovation, particularly in areas like miniaturization, improved durability, and less invasive implantation techniques, are primary drivers. Stringent regulatory frameworks, including FDA approvals and CE markings, significantly influence market access. Competitive pressure arises from both established players and emerging companies developing innovative solutions. End-user demographics are primarily focused on patients with advanced heart failure, with a growing prevalence driving demand. M&A activity has been moderate, with strategic acquisitions aimed at strengthening product portfolios and expanding market reach. The market is expected to be worth xx Billion in 2025.
- Market Concentration: Moderately concentrated, with top players holding approximately xx% of market share in 2025.
- Technological Innovation: Miniaturization, improved biocompatibility, and wireless technologies are key drivers.
- Regulatory Landscape: Stringent FDA and CE approvals create barriers to entry, but ensure safety and efficacy.
- Competitive Substitutes: Other heart failure therapies, including heart transplants and medical management, create competitive pressure.
- End-User Demographics: Aging population and increasing prevalence of heart failure drive market growth.
- M&A Activity: Moderate level of activity, primarily focused on strategic acquisitions and partnerships.
LVAD Industry Growth Trends & Insights
The LVAD market has witnessed significant growth over the past five years, driven by increasing prevalence of heart failure, technological advancements leading to improved device performance and patient outcomes, and expanded applications beyond bridge-to-transplant (BTT) therapy. The market is projected to exhibit a CAGR of xx% from 2025 to 2033. This growth is fueled by increasing adoption rates, particularly in destination therapy, technological disruptions resulting in smaller, more efficient devices, and shifts in consumer behavior toward minimally invasive procedures. Improved reimbursement policies and increasing awareness among healthcare professionals are also contributing factors.

Dominant Regions, Countries, or Segments in LVAD Industry
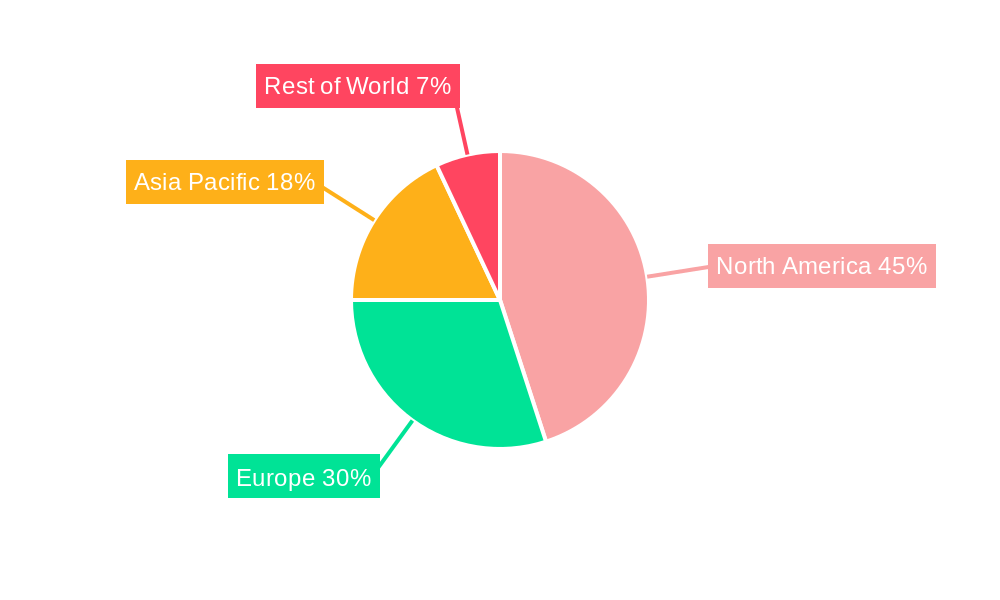
North America currently holds the largest market share, driven by high prevalence of heart failure, advanced healthcare infrastructure, and higher adoption rates of advanced therapies. However, significant growth potential exists in emerging markets such as Asia-Pacific and Europe. Within device types, Left Ventricular Assist Devices (LVADs) dominate the market, accounting for the majority of sales. Bridge-to-transplant (BTT) therapy remains a significant application, but destination therapy is witnessing rapid growth.
- Leading Region: North America
- Key Drivers (North America): High prevalence of heart failure, advanced healthcare infrastructure, strong reimbursement policies.
- Growth Potential Regions: Asia-Pacific and Europe (driven by increasing healthcare spending and rising prevalence of heart failure).
- Dominant Segment (Device Type): LVADs
- Dominant Segment (Application): Bridge-to-transplant (BTT) therapy, with significant growth in destination therapy.
LVAD Industry Product Landscape
The LVAD market features a range of devices with varying designs, sizes, and functionalities. Innovations focus on minimizing invasiveness, improving power efficiency, and enhancing long-term durability. Key performance metrics include flow rate, power consumption, and device longevity. Unique selling propositions often emphasize improved patient outcomes, reduced complications, and enhanced quality of life. Technological advancements are focused on fully implantable devices, reduced blood trauma, and improved device control systems.
Key Drivers, Barriers & Challenges in LVAD Industry
Key Drivers:
- Increasing prevalence of heart failure.
- Technological advancements leading to improved device performance.
- Growing acceptance of destination therapy.
- Favorable reimbursement policies in developed countries.
Key Barriers and Challenges:
- High cost of devices and procedures.
- Risk of complications, including bleeding, infection, and device failure.
- Limited access to LVAD technology in many developing countries.
- Stringent regulatory requirements.
- Potential supply chain disruptions. The global impact of the disruption in 2021 caused a xx Billion loss to the industry.
Emerging Opportunities in LVAD Industry
- Expansion into emerging markets with unmet medical needs.
- Development of next-generation devices with improved functionality and longevity.
- Exploration of new applications, such as supporting cardiac rehabilitation.
- Increasing focus on remote monitoring and telehealth solutions.
Growth Accelerators in the LVAD Industry
Technological breakthroughs in miniaturization, biocompatibility, and power management are significantly boosting market growth. Strategic partnerships between device manufacturers and healthcare providers are optimizing clinical pathways and improving patient access. Expanding into emerging markets and broadening applications beyond the traditional BTT and destination therapy segments are key strategies for sustainable growth.
Key Players Shaping the LVAD Industry Market
- Abiomed Inc
- Calon Cardio
- Terumo Corporation
- SynCardia Systems LLC
- Jarvik Heart Inc
- Medtronic PLC
- Abbott Laboratories (St Jude Medical Inc)
- BiVACOR Inc
- Berlin Heart GmbH
Notable Milestones in LVAD Industry Sector
- June 2021: Abbott announced increased capacity to meet growing demand for MCS devices following Medtronic's HVAD withdrawal.
- January 2022: IIT Kanpur launched Hridyantra, a program to develop advanced LVADs.
In-Depth LVAD Industry Market Outlook
The LVAD market is poised for sustained growth, driven by continuous technological innovation, increasing patient demand, and expansion into new markets. Strategic partnerships, targeted R&D efforts, and a focus on improving patient outcomes will be crucial for success in this competitive landscape. The market's long-term potential remains significant, presenting substantial opportunities for established and emerging players alike.
LVAD Industry Segmentation
-
1. Type of Ventricular Device
- 1.1. Left Ventricular Assist Device (LVAD)
- 1.2. Right Ventricular Assist Device (RVAD)
- 1.3. Biventricular Assist Device (BIVAD)
-
2. Application
- 2.1. Bridge-to-transplant (BTT) Therapy
- 2.2. Destination Therapy
- 2.3. Other Therapies
LVAD Industry Segmentation By Geography
-
1. North America
- 1.1. United States
- 1.2. Canada
- 1.3. Mexico
-
2. Europe
- 2.1. Germany
- 2.2. United Kingdom
- 2.3. France
- 2.4. Italy
- 2.5. Spain
- 2.6. Rest of Europe
-
3. Asia Pacific
- 3.1. China
- 3.2. Japan
- 3.3. India
- 3.4. Australia
- 3.5. South Korea
- 3.6. Rest of Asia Pacific
- 4. Middle East
-
5. GCC
- 5.1. South Africa
- 5.2. Rest of Middle East
-
6. South America
- 6.1. Brazil
- 6.2. Argentina
- 6.3. Rest of South America
LVAD Industry REPORT HIGHLIGHTS
| Aspects | Details |
|---|---|
| Study Period | 2019-2033 |
| Base Year | 2024 |
| Estimated Year | 2025 |
| Forecast Period | 2025-2033 |
| Historical Period | 2019-2024 |
| Growth Rate | CAGR of 7.23% from 2019-2033 |
| Segmentation |
|
Table of Contents
- 1. Introduction
- 1.1. Research Scope
- 1.2. Market Segmentation
- 1.3. Research Methodology
- 1.4. Definitions and Assumptions
- 2. Executive Summary
- 2.1. Introduction
- 3. Market Dynamics
- 3.1. Introduction
- 3.2. Market Drivers
- 3.2.1. Growing Burden of Cardiac Diseases and Heart Failure; Technological Advancement of Devices for Cardiac Diseases Management; Growing Initiatives and Awareness Regarding Cardiovascular Diseases
- 3.3. Market Restrains
- 3.3.1. High Cost of Devices and Procedures; Several Risks Associated to VAD Implant
- 3.4. Market Trends
- 3.4.1. Left Ventricular Assist Device (LVAD) is Expected to Hold the Major Share in the Type of Ventricular Device Segment
- 4. Market Factor Analysis
- 4.1. Porters Five Forces
- 4.2. Supply/Value Chain
- 4.3. PESTEL analysis
- 4.4. Market Entropy
- 4.5. Patent/Trademark Analysis
- 5. Global LVAD Industry Analysis, Insights and Forecast, 2019-2031
- 5.1. Market Analysis, Insights and Forecast - by Type of Ventricular Device
- 5.1.1. Left Ventricular Assist Device (LVAD)
- 5.1.2. Right Ventricular Assist Device (RVAD)
- 5.1.3. Biventricular Assist Device (BIVAD)
- 5.2. Market Analysis, Insights and Forecast - by Application
- 5.2.1. Bridge-to-transplant (BTT) Therapy
- 5.2.2. Destination Therapy
- 5.2.3. Other Therapies
- 5.3. Market Analysis, Insights and Forecast - by Region
- 5.3.1. North America
- 5.3.2. Europe
- 5.3.3. Asia Pacific
- 5.3.4. Middle East
- 5.3.5. GCC
- 5.3.6. South America
- 5.1. Market Analysis, Insights and Forecast - by Type of Ventricular Device
- 6. North America LVAD Industry Analysis, Insights and Forecast, 2019-2031
- 6.1. Market Analysis, Insights and Forecast - by Type of Ventricular Device
- 6.1.1. Left Ventricular Assist Device (LVAD)
- 6.1.2. Right Ventricular Assist Device (RVAD)
- 6.1.3. Biventricular Assist Device (BIVAD)
- 6.2. Market Analysis, Insights and Forecast - by Application
- 6.2.1. Bridge-to-transplant (BTT) Therapy
- 6.2.2. Destination Therapy
- 6.2.3. Other Therapies
- 6.1. Market Analysis, Insights and Forecast - by Type of Ventricular Device
- 7. Europe LVAD Industry Analysis, Insights and Forecast, 2019-2031
- 7.1. Market Analysis, Insights and Forecast - by Type of Ventricular Device
- 7.1.1. Left Ventricular Assist Device (LVAD)
- 7.1.2. Right Ventricular Assist Device (RVAD)
- 7.1.3. Biventricular Assist Device (BIVAD)
- 7.2. Market Analysis, Insights and Forecast - by Application
- 7.2.1. Bridge-to-transplant (BTT) Therapy
- 7.2.2. Destination Therapy
- 7.2.3. Other Therapies
- 7.1. Market Analysis, Insights and Forecast - by Type of Ventricular Device
- 8. Asia Pacific LVAD Industry Analysis, Insights and Forecast, 2019-2031
- 8.1. Market Analysis, Insights and Forecast - by Type of Ventricular Device
- 8.1.1. Left Ventricular Assist Device (LVAD)
- 8.1.2. Right Ventricular Assist Device (RVAD)
- 8.1.3. Biventricular Assist Device (BIVAD)
- 8.2. Market Analysis, Insights and Forecast - by Application
- 8.2.1. Bridge-to-transplant (BTT) Therapy
- 8.2.2. Destination Therapy
- 8.2.3. Other Therapies
- 8.1. Market Analysis, Insights and Forecast - by Type of Ventricular Device
- 9. Middle East LVAD Industry Analysis, Insights and Forecast, 2019-2031
- 9.1. Market Analysis, Insights and Forecast - by Type of Ventricular Device
- 9.1.1. Left Ventricular Assist Device (LVAD)
- 9.1.2. Right Ventricular Assist Device (RVAD)
- 9.1.3. Biventricular Assist Device (BIVAD)
- 9.2. Market Analysis, Insights and Forecast - by Application
- 9.2.1. Bridge-to-transplant (BTT) Therapy
- 9.2.2. Destination Therapy
- 9.2.3. Other Therapies
- 9.1. Market Analysis, Insights and Forecast - by Type of Ventricular Device
- 10. GCC LVAD Industry Analysis, Insights and Forecast, 2019-2031
- 10.1. Market Analysis, Insights and Forecast - by Type of Ventricular Device
- 10.1.1. Left Ventricular Assist Device (LVAD)
- 10.1.2. Right Ventricular Assist Device (RVAD)
- 10.1.3. Biventricular Assist Device (BIVAD)
- 10.2. Market Analysis, Insights and Forecast - by Application
- 10.2.1. Bridge-to-transplant (BTT) Therapy
- 10.2.2. Destination Therapy
- 10.2.3. Other Therapies
- 10.1. Market Analysis, Insights and Forecast - by Type of Ventricular Device
- 11. South America LVAD Industry Analysis, Insights and Forecast, 2019-2031
- 11.1. Market Analysis, Insights and Forecast - by Type of Ventricular Device
- 11.1.1. Left Ventricular Assist Device (LVAD)
- 11.1.2. Right Ventricular Assist Device (RVAD)
- 11.1.3. Biventricular Assist Device (BIVAD)
- 11.2. Market Analysis, Insights and Forecast - by Application
- 11.2.1. Bridge-to-transplant (BTT) Therapy
- 11.2.2. Destination Therapy
- 11.2.3. Other Therapies
- 11.1. Market Analysis, Insights and Forecast - by Type of Ventricular Device
- 12. North America LVAD Industry Analysis, Insights and Forecast, 2019-2031
- 12.1. Market Analysis, Insights and Forecast - By Country/Sub-region
- 12.1.1 United States
- 12.1.2 Canada
- 12.1.3 Mexico
- 13. Europe LVAD Industry Analysis, Insights and Forecast, 2019-2031
- 13.1. Market Analysis, Insights and Forecast - By Country/Sub-region
- 13.1.1 Germany
- 13.1.2 United Kingdom
- 13.1.3 France
- 13.1.4 Italy
- 13.1.5 Spain
- 13.1.6 Rest of Europe
- 14. Asia Pacific LVAD Industry Analysis, Insights and Forecast, 2019-2031
- 14.1. Market Analysis, Insights and Forecast - By Country/Sub-region
- 14.1.1 China
- 14.1.2 Japan
- 14.1.3 India
- 14.1.4 Australia
- 14.1.5 South Korea
- 14.1.6 Rest of Asia Pacific
- 15. Middle East LVAD Industry Analysis, Insights and Forecast, 2019-2031
- 15.1. Market Analysis, Insights and Forecast - By Country/Sub-region
- 15.1.1.
- 16. GCC LVAD Industry Analysis, Insights and Forecast, 2019-2031
- 16.1. Market Analysis, Insights and Forecast - By Country/Sub-region
- 16.1.1 South Africa
- 16.1.2 Rest of Middle East
- 17. South America LVAD Industry Analysis, Insights and Forecast, 2019-2031
- 17.1. Market Analysis, Insights and Forecast - By Country/Sub-region
- 17.1.1 Brazil
- 17.1.2 Argentina
- 17.1.3 Rest of South America
- 18. Competitive Analysis
- 18.1. Global Market Share Analysis 2024
- 18.2. Company Profiles
- 18.2.1 Abiomed Inc
- 18.2.1.1. Overview
- 18.2.1.2. Products
- 18.2.1.3. SWOT Analysis
- 18.2.1.4. Recent Developments
- 18.2.1.5. Financials (Based on Availability)
- 18.2.2 Calon Cardio
- 18.2.2.1. Overview
- 18.2.2.2. Products
- 18.2.2.3. SWOT Analysis
- 18.2.2.4. Recent Developments
- 18.2.2.5. Financials (Based on Availability)
- 18.2.3 Terumo Corporation*List Not Exhaustive
- 18.2.3.1. Overview
- 18.2.3.2. Products
- 18.2.3.3. SWOT Analysis
- 18.2.3.4. Recent Developments
- 18.2.3.5. Financials (Based on Availability)
- 18.2.4 SynCardia Systems LLC
- 18.2.4.1. Overview
- 18.2.4.2. Products
- 18.2.4.3. SWOT Analysis
- 18.2.4.4. Recent Developments
- 18.2.4.5. Financials (Based on Availability)
- 18.2.5 Jarvik Heart Inc
- 18.2.5.1. Overview
- 18.2.5.2. Products
- 18.2.5.3. SWOT Analysis
- 18.2.5.4. Recent Developments
- 18.2.5.5. Financials (Based on Availability)
- 18.2.6 Medtronic PLC
- 18.2.6.1. Overview
- 18.2.6.2. Products
- 18.2.6.3. SWOT Analysis
- 18.2.6.4. Recent Developments
- 18.2.6.5. Financials (Based on Availability)
- 18.2.7 Abbott Laboratories (St Jude Medical Inc )
- 18.2.7.1. Overview
- 18.2.7.2. Products
- 18.2.7.3. SWOT Analysis
- 18.2.7.4. Recent Developments
- 18.2.7.5. Financials (Based on Availability)
- 18.2.8 BiVACOR Inc
- 18.2.8.1. Overview
- 18.2.8.2. Products
- 18.2.8.3. SWOT Analysis
- 18.2.8.4. Recent Developments
- 18.2.8.5. Financials (Based on Availability)
- 18.2.9 Berlin Heart GmbH
- 18.2.9.1. Overview
- 18.2.9.2. Products
- 18.2.9.3. SWOT Analysis
- 18.2.9.4. Recent Developments
- 18.2.9.5. Financials (Based on Availability)
- 18.2.1 Abiomed Inc
List of Figures
- Figure 1: Global LVAD Industry Revenue Breakdown (Billion, %) by Region 2024 & 2032
- Figure 2: Global LVAD Industry Volume Breakdown (Piece, %) by Region 2024 & 2032
- Figure 3: North America LVAD Industry Revenue (Billion), by Country 2024 & 2032
- Figure 4: North America LVAD Industry Volume (Piece), by Country 2024 & 2032
- Figure 5: North America LVAD Industry Revenue Share (%), by Country 2024 & 2032
- Figure 6: North America LVAD Industry Volume Share (%), by Country 2024 & 2032
- Figure 7: Europe LVAD Industry Revenue (Billion), by Country 2024 & 2032
- Figure 8: Europe LVAD Industry Volume (Piece), by Country 2024 & 2032
- Figure 9: Europe LVAD Industry Revenue Share (%), by Country 2024 & 2032
- Figure 10: Europe LVAD Industry Volume Share (%), by Country 2024 & 2032
- Figure 11: Asia Pacific LVAD Industry Revenue (Billion), by Country 2024 & 2032
- Figure 12: Asia Pacific LVAD Industry Volume (Piece), by Country 2024 & 2032
- Figure 13: Asia Pacific LVAD Industry Revenue Share (%), by Country 2024 & 2032
- Figure 14: Asia Pacific LVAD Industry Volume Share (%), by Country 2024 & 2032
- Figure 15: Middle East LVAD Industry Revenue (Billion), by Country 2024 & 2032
- Figure 16: Middle East LVAD Industry Volume (Piece), by Country 2024 & 2032
- Figure 17: Middle East LVAD Industry Revenue Share (%), by Country 2024 & 2032
- Figure 18: Middle East LVAD Industry Volume Share (%), by Country 2024 & 2032
- Figure 19: GCC LVAD Industry Revenue (Billion), by Country 2024 & 2032
- Figure 20: GCC LVAD Industry Volume (Piece), by Country 2024 & 2032
- Figure 21: GCC LVAD Industry Revenue Share (%), by Country 2024 & 2032
- Figure 22: GCC LVAD Industry Volume Share (%), by Country 2024 & 2032
- Figure 23: South America LVAD Industry Revenue (Billion), by Country 2024 & 2032
- Figure 24: South America LVAD Industry Volume (Piece), by Country 2024 & 2032
- Figure 25: South America LVAD Industry Revenue Share (%), by Country 2024 & 2032
- Figure 26: South America LVAD Industry Volume Share (%), by Country 2024 & 2032
- Figure 27: North America LVAD Industry Revenue (Billion), by Type of Ventricular Device 2024 & 2032
- Figure 28: North America LVAD Industry Volume (Piece), by Type of Ventricular Device 2024 & 2032
- Figure 29: North America LVAD Industry Revenue Share (%), by Type of Ventricular Device 2024 & 2032
- Figure 30: North America LVAD Industry Volume Share (%), by Type of Ventricular Device 2024 & 2032
- Figure 31: North America LVAD Industry Revenue (Billion), by Application 2024 & 2032
- Figure 32: North America LVAD Industry Volume (Piece), by Application 2024 & 2032
- Figure 33: North America LVAD Industry Revenue Share (%), by Application 2024 & 2032
- Figure 34: North America LVAD Industry Volume Share (%), by Application 2024 & 2032
- Figure 35: North America LVAD Industry Revenue (Billion), by Country 2024 & 2032
- Figure 36: North America LVAD Industry Volume (Piece), by Country 2024 & 2032
- Figure 37: North America LVAD Industry Revenue Share (%), by Country 2024 & 2032
- Figure 38: North America LVAD Industry Volume Share (%), by Country 2024 & 2032
- Figure 39: Europe LVAD Industry Revenue (Billion), by Type of Ventricular Device 2024 & 2032
- Figure 40: Europe LVAD Industry Volume (Piece), by Type of Ventricular Device 2024 & 2032
- Figure 41: Europe LVAD Industry Revenue Share (%), by Type of Ventricular Device 2024 & 2032
- Figure 42: Europe LVAD Industry Volume Share (%), by Type of Ventricular Device 2024 & 2032
- Figure 43: Europe LVAD Industry Revenue (Billion), by Application 2024 & 2032
- Figure 44: Europe LVAD Industry Volume (Piece), by Application 2024 & 2032
- Figure 45: Europe LVAD Industry Revenue Share (%), by Application 2024 & 2032
- Figure 46: Europe LVAD Industry Volume Share (%), by Application 2024 & 2032
- Figure 47: Europe LVAD Industry Revenue (Billion), by Country 2024 & 2032
- Figure 48: Europe LVAD Industry Volume (Piece), by Country 2024 & 2032
- Figure 49: Europe LVAD Industry Revenue Share (%), by Country 2024 & 2032
- Figure 50: Europe LVAD Industry Volume Share (%), by Country 2024 & 2032
- Figure 51: Asia Pacific LVAD Industry Revenue (Billion), by Type of Ventricular Device 2024 & 2032
- Figure 52: Asia Pacific LVAD Industry Volume (Piece), by Type of Ventricular Device 2024 & 2032
- Figure 53: Asia Pacific LVAD Industry Revenue Share (%), by Type of Ventricular Device 2024 & 2032
- Figure 54: Asia Pacific LVAD Industry Volume Share (%), by Type of Ventricular Device 2024 & 2032
- Figure 55: Asia Pacific LVAD Industry Revenue (Billion), by Application 2024 & 2032
- Figure 56: Asia Pacific LVAD Industry Volume (Piece), by Application 2024 & 2032
- Figure 57: Asia Pacific LVAD Industry Revenue Share (%), by Application 2024 & 2032
- Figure 58: Asia Pacific LVAD Industry Volume Share (%), by Application 2024 & 2032
- Figure 59: Asia Pacific LVAD Industry Revenue (Billion), by Country 2024 & 2032
- Figure 60: Asia Pacific LVAD Industry Volume (Piece), by Country 2024 & 2032
- Figure 61: Asia Pacific LVAD Industry Revenue Share (%), by Country 2024 & 2032
- Figure 62: Asia Pacific LVAD Industry Volume Share (%), by Country 2024 & 2032
- Figure 63: Middle East LVAD Industry Revenue (Billion), by Type of Ventricular Device 2024 & 2032
- Figure 64: Middle East LVAD Industry Volume (Piece), by Type of Ventricular Device 2024 & 2032
- Figure 65: Middle East LVAD Industry Revenue Share (%), by Type of Ventricular Device 2024 & 2032
- Figure 66: Middle East LVAD Industry Volume Share (%), by Type of Ventricular Device 2024 & 2032
- Figure 67: Middle East LVAD Industry Revenue (Billion), by Application 2024 & 2032
- Figure 68: Middle East LVAD Industry Volume (Piece), by Application 2024 & 2032
- Figure 69: Middle East LVAD Industry Revenue Share (%), by Application 2024 & 2032
- Figure 70: Middle East LVAD Industry Volume Share (%), by Application 2024 & 2032
- Figure 71: Middle East LVAD Industry Revenue (Billion), by Country 2024 & 2032
- Figure 72: Middle East LVAD Industry Volume (Piece), by Country 2024 & 2032
- Figure 73: Middle East LVAD Industry Revenue Share (%), by Country 2024 & 2032
- Figure 74: Middle East LVAD Industry Volume Share (%), by Country 2024 & 2032
- Figure 75: GCC LVAD Industry Revenue (Billion), by Type of Ventricular Device 2024 & 2032
- Figure 76: GCC LVAD Industry Volume (Piece), by Type of Ventricular Device 2024 & 2032
- Figure 77: GCC LVAD Industry Revenue Share (%), by Type of Ventricular Device 2024 & 2032
- Figure 78: GCC LVAD Industry Volume Share (%), by Type of Ventricular Device 2024 & 2032
- Figure 79: GCC LVAD Industry Revenue (Billion), by Application 2024 & 2032
- Figure 80: GCC LVAD Industry Volume (Piece), by Application 2024 & 2032
- Figure 81: GCC LVAD Industry Revenue Share (%), by Application 2024 & 2032
- Figure 82: GCC LVAD Industry Volume Share (%), by Application 2024 & 2032
- Figure 83: GCC LVAD Industry Revenue (Billion), by Country 2024 & 2032
- Figure 84: GCC LVAD Industry Volume (Piece), by Country 2024 & 2032
- Figure 85: GCC LVAD Industry Revenue Share (%), by Country 2024 & 2032
- Figure 86: GCC LVAD Industry Volume Share (%), by Country 2024 & 2032
- Figure 87: South America LVAD Industry Revenue (Billion), by Type of Ventricular Device 2024 & 2032
- Figure 88: South America LVAD Industry Volume (Piece), by Type of Ventricular Device 2024 & 2032
- Figure 89: South America LVAD Industry Revenue Share (%), by Type of Ventricular Device 2024 & 2032
- Figure 90: South America LVAD Industry Volume Share (%), by Type of Ventricular Device 2024 & 2032
- Figure 91: South America LVAD Industry Revenue (Billion), by Application 2024 & 2032
- Figure 92: South America LVAD Industry Volume (Piece), by Application 2024 & 2032
- Figure 93: South America LVAD Industry Revenue Share (%), by Application 2024 & 2032
- Figure 94: South America LVAD Industry Volume Share (%), by Application 2024 & 2032
- Figure 95: South America LVAD Industry Revenue (Billion), by Country 2024 & 2032
- Figure 96: South America LVAD Industry Volume (Piece), by Country 2024 & 2032
- Figure 97: South America LVAD Industry Revenue Share (%), by Country 2024 & 2032
- Figure 98: South America LVAD Industry Volume Share (%), by Country 2024 & 2032
List of Tables
- Table 1: Global LVAD Industry Revenue Billion Forecast, by Region 2019 & 2032
- Table 2: Global LVAD Industry Volume Piece Forecast, by Region 2019 & 2032
- Table 3: Global LVAD Industry Revenue Billion Forecast, by Type of Ventricular Device 2019 & 2032
- Table 4: Global LVAD Industry Volume Piece Forecast, by Type of Ventricular Device 2019 & 2032
- Table 5: Global LVAD Industry Revenue Billion Forecast, by Application 2019 & 2032
- Table 6: Global LVAD Industry Volume Piece Forecast, by Application 2019 & 2032
- Table 7: Global LVAD Industry Revenue Billion Forecast, by Region 2019 & 2032
- Table 8: Global LVAD Industry Volume Piece Forecast, by Region 2019 & 2032
- Table 9: Global LVAD Industry Revenue Billion Forecast, by Country 2019 & 2032
- Table 10: Global LVAD Industry Volume Piece Forecast, by Country 2019 & 2032
- Table 11: United States LVAD Industry Revenue (Billion) Forecast, by Application 2019 & 2032
- Table 12: United States LVAD Industry Volume (Piece) Forecast, by Application 2019 & 2032
- Table 13: Canada LVAD Industry Revenue (Billion) Forecast, by Application 2019 & 2032
- Table 14: Canada LVAD Industry Volume (Piece) Forecast, by Application 2019 & 2032
- Table 15: Mexico LVAD Industry Revenue (Billion) Forecast, by Application 2019 & 2032
- Table 16: Mexico LVAD Industry Volume (Piece) Forecast, by Application 2019 & 2032
- Table 17: Global LVAD Industry Revenue Billion Forecast, by Country 2019 & 2032
- Table 18: Global LVAD Industry Volume Piece Forecast, by Country 2019 & 2032
- Table 19: Germany LVAD Industry Revenue (Billion) Forecast, by Application 2019 & 2032
- Table 20: Germany LVAD Industry Volume (Piece) Forecast, by Application 2019 & 2032
- Table 21: United Kingdom LVAD Industry Revenue (Billion) Forecast, by Application 2019 & 2032
- Table 22: United Kingdom LVAD Industry Volume (Piece) Forecast, by Application 2019 & 2032
- Table 23: France LVAD Industry Revenue (Billion) Forecast, by Application 2019 & 2032
- Table 24: France LVAD Industry Volume (Piece) Forecast, by Application 2019 & 2032
- Table 25: Italy LVAD Industry Revenue (Billion) Forecast, by Application 2019 & 2032
- Table 26: Italy LVAD Industry Volume (Piece) Forecast, by Application 2019 & 2032
- Table 27: Spain LVAD Industry Revenue (Billion) Forecast, by Application 2019 & 2032
- Table 28: Spain LVAD Industry Volume (Piece) Forecast, by Application 2019 & 2032
- Table 29: Rest of Europe LVAD Industry Revenue (Billion) Forecast, by Application 2019 & 2032
- Table 30: Rest of Europe LVAD Industry Volume (Piece) Forecast, by Application 2019 & 2032
- Table 31: Global LVAD Industry Revenue Billion Forecast, by Country 2019 & 2032
- Table 32: Global LVAD Industry Volume Piece Forecast, by Country 2019 & 2032
- Table 33: China LVAD Industry Revenue (Billion) Forecast, by Application 2019 & 2032
- Table 34: China LVAD Industry Volume (Piece) Forecast, by Application 2019 & 2032
- Table 35: Japan LVAD Industry Revenue (Billion) Forecast, by Application 2019 & 2032
- Table 36: Japan LVAD Industry Volume (Piece) Forecast, by Application 2019 & 2032
- Table 37: India LVAD Industry Revenue (Billion) Forecast, by Application 2019 & 2032
- Table 38: India LVAD Industry Volume (Piece) Forecast, by Application 2019 & 2032
- Table 39: Australia LVAD Industry Revenue (Billion) Forecast, by Application 2019 & 2032
- Table 40: Australia LVAD Industry Volume (Piece) Forecast, by Application 2019 & 2032
- Table 41: South Korea LVAD Industry Revenue (Billion) Forecast, by Application 2019 & 2032
- Table 42: South Korea LVAD Industry Volume (Piece) Forecast, by Application 2019 & 2032
- Table 43: Rest of Asia Pacific LVAD Industry Revenue (Billion) Forecast, by Application 2019 & 2032
- Table 44: Rest of Asia Pacific LVAD Industry Volume (Piece) Forecast, by Application 2019 & 2032
- Table 45: Global LVAD Industry Revenue Billion Forecast, by Country 2019 & 2032
- Table 46: Global LVAD Industry Volume Piece Forecast, by Country 2019 & 2032
- Table 47: LVAD Industry Revenue (Billion) Forecast, by Application 2019 & 2032
- Table 48: LVAD Industry Volume (Piece) Forecast, by Application 2019 & 2032
- Table 49: Global LVAD Industry Revenue Billion Forecast, by Country 2019 & 2032
- Table 50: Global LVAD Industry Volume Piece Forecast, by Country 2019 & 2032
- Table 51: South Africa LVAD Industry Revenue (Billion) Forecast, by Application 2019 & 2032
- Table 52: South Africa LVAD Industry Volume (Piece) Forecast, by Application 2019 & 2032
- Table 53: Rest of Middle East LVAD Industry Revenue (Billion) Forecast, by Application 2019 & 2032
- Table 54: Rest of Middle East LVAD Industry Volume (Piece) Forecast, by Application 2019 & 2032
- Table 55: Global LVAD Industry Revenue Billion Forecast, by Country 2019 & 2032
- Table 56: Global LVAD Industry Volume Piece Forecast, by Country 2019 & 2032
- Table 57: Brazil LVAD Industry Revenue (Billion) Forecast, by Application 2019 & 2032
- Table 58: Brazil LVAD Industry Volume (Piece) Forecast, by Application 2019 & 2032
- Table 59: Argentina LVAD Industry Revenue (Billion) Forecast, by Application 2019 & 2032
- Table 60: Argentina LVAD Industry Volume (Piece) Forecast, by Application 2019 & 2032
- Table 61: Rest of South America LVAD Industry Revenue (Billion) Forecast, by Application 2019 & 2032
- Table 62: Rest of South America LVAD Industry Volume (Piece) Forecast, by Application 2019 & 2032
- Table 63: Global LVAD Industry Revenue Billion Forecast, by Type of Ventricular Device 2019 & 2032
- Table 64: Global LVAD Industry Volume Piece Forecast, by Type of Ventricular Device 2019 & 2032
- Table 65: Global LVAD Industry Revenue Billion Forecast, by Application 2019 & 2032
- Table 66: Global LVAD Industry Volume Piece Forecast, by Application 2019 & 2032
- Table 67: Global LVAD Industry Revenue Billion Forecast, by Country 2019 & 2032
- Table 68: Global LVAD Industry Volume Piece Forecast, by Country 2019 & 2032
- Table 69: United States LVAD Industry Revenue (Billion) Forecast, by Application 2019 & 2032
- Table 70: United States LVAD Industry Volume (Piece) Forecast, by Application 2019 & 2032
- Table 71: Canada LVAD Industry Revenue (Billion) Forecast, by Application 2019 & 2032
- Table 72: Canada LVAD Industry Volume (Piece) Forecast, by Application 2019 & 2032
- Table 73: Mexico LVAD Industry Revenue (Billion) Forecast, by Application 2019 & 2032
- Table 74: Mexico LVAD Industry Volume (Piece) Forecast, by Application 2019 & 2032
- Table 75: Global LVAD Industry Revenue Billion Forecast, by Type of Ventricular Device 2019 & 2032
- Table 76: Global LVAD Industry Volume Piece Forecast, by Type of Ventricular Device 2019 & 2032
- Table 77: Global LVAD Industry Revenue Billion Forecast, by Application 2019 & 2032
- Table 78: Global LVAD Industry Volume Piece Forecast, by Application 2019 & 2032
- Table 79: Global LVAD Industry Revenue Billion Forecast, by Country 2019 & 2032
- Table 80: Global LVAD Industry Volume Piece Forecast, by Country 2019 & 2032
- Table 81: Germany LVAD Industry Revenue (Billion) Forecast, by Application 2019 & 2032
- Table 82: Germany LVAD Industry Volume (Piece) Forecast, by Application 2019 & 2032
- Table 83: United Kingdom LVAD Industry Revenue (Billion) Forecast, by Application 2019 & 2032
- Table 84: United Kingdom LVAD Industry Volume (Piece) Forecast, by Application 2019 & 2032
- Table 85: France LVAD Industry Revenue (Billion) Forecast, by Application 2019 & 2032
- Table 86: France LVAD Industry Volume (Piece) Forecast, by Application 2019 & 2032
- Table 87: Italy LVAD Industry Revenue (Billion) Forecast, by Application 2019 & 2032
- Table 88: Italy LVAD Industry Volume (Piece) Forecast, by Application 2019 & 2032
- Table 89: Spain LVAD Industry Revenue (Billion) Forecast, by Application 2019 & 2032
- Table 90: Spain LVAD Industry Volume (Piece) Forecast, by Application 2019 & 2032
- Table 91: Rest of Europe LVAD Industry Revenue (Billion) Forecast, by Application 2019 & 2032
- Table 92: Rest of Europe LVAD Industry Volume (Piece) Forecast, by Application 2019 & 2032
- Table 93: Global LVAD Industry Revenue Billion Forecast, by Type of Ventricular Device 2019 & 2032
- Table 94: Global LVAD Industry Volume Piece Forecast, by Type of Ventricular Device 2019 & 2032
- Table 95: Global LVAD Industry Revenue Billion Forecast, by Application 2019 & 2032
- Table 96: Global LVAD Industry Volume Piece Forecast, by Application 2019 & 2032
- Table 97: Global LVAD Industry Revenue Billion Forecast, by Country 2019 & 2032
- Table 98: Global LVAD Industry Volume Piece Forecast, by Country 2019 & 2032
- Table 99: China LVAD Industry Revenue (Billion) Forecast, by Application 2019 & 2032
- Table 100: China LVAD Industry Volume (Piece) Forecast, by Application 2019 & 2032
- Table 101: Japan LVAD Industry Revenue (Billion) Forecast, by Application 2019 & 2032
- Table 102: Japan LVAD Industry Volume (Piece) Forecast, by Application 2019 & 2032
- Table 103: India LVAD Industry Revenue (Billion) Forecast, by Application 2019 & 2032
- Table 104: India LVAD Industry Volume (Piece) Forecast, by Application 2019 & 2032
- Table 105: Australia LVAD Industry Revenue (Billion) Forecast, by Application 2019 & 2032
- Table 106: Australia LVAD Industry Volume (Piece) Forecast, by Application 2019 & 2032
- Table 107: South Korea LVAD Industry Revenue (Billion) Forecast, by Application 2019 & 2032
- Table 108: South Korea LVAD Industry Volume (Piece) Forecast, by Application 2019 & 2032
- Table 109: Rest of Asia Pacific LVAD Industry Revenue (Billion) Forecast, by Application 2019 & 2032
- Table 110: Rest of Asia Pacific LVAD Industry Volume (Piece) Forecast, by Application 2019 & 2032
- Table 111: Global LVAD Industry Revenue Billion Forecast, by Type of Ventricular Device 2019 & 2032
- Table 112: Global LVAD Industry Volume Piece Forecast, by Type of Ventricular Device 2019 & 2032
- Table 113: Global LVAD Industry Revenue Billion Forecast, by Application 2019 & 2032
- Table 114: Global LVAD Industry Volume Piece Forecast, by Application 2019 & 2032
- Table 115: Global LVAD Industry Revenue Billion Forecast, by Country 2019 & 2032
- Table 116: Global LVAD Industry Volume Piece Forecast, by Country 2019 & 2032
- Table 117: Global LVAD Industry Revenue Billion Forecast, by Type of Ventricular Device 2019 & 2032
- Table 118: Global LVAD Industry Volume Piece Forecast, by Type of Ventricular Device 2019 & 2032
- Table 119: Global LVAD Industry Revenue Billion Forecast, by Application 2019 & 2032
- Table 120: Global LVAD Industry Volume Piece Forecast, by Application 2019 & 2032
- Table 121: Global LVAD Industry Revenue Billion Forecast, by Country 2019 & 2032
- Table 122: Global LVAD Industry Volume Piece Forecast, by Country 2019 & 2032
- Table 123: South Africa LVAD Industry Revenue (Billion) Forecast, by Application 2019 & 2032
- Table 124: South Africa LVAD Industry Volume (Piece) Forecast, by Application 2019 & 2032
- Table 125: Rest of Middle East LVAD Industry Revenue (Billion) Forecast, by Application 2019 & 2032
- Table 126: Rest of Middle East LVAD Industry Volume (Piece) Forecast, by Application 2019 & 2032
- Table 127: Global LVAD Industry Revenue Billion Forecast, by Type of Ventricular Device 2019 & 2032
- Table 128: Global LVAD Industry Volume Piece Forecast, by Type of Ventricular Device 2019 & 2032
- Table 129: Global LVAD Industry Revenue Billion Forecast, by Application 2019 & 2032
- Table 130: Global LVAD Industry Volume Piece Forecast, by Application 2019 & 2032
- Table 131: Global LVAD Industry Revenue Billion Forecast, by Country 2019 & 2032
- Table 132: Global LVAD Industry Volume Piece Forecast, by Country 2019 & 2032
- Table 133: Brazil LVAD Industry Revenue (Billion) Forecast, by Application 2019 & 2032
- Table 134: Brazil LVAD Industry Volume (Piece) Forecast, by Application 2019 & 2032
- Table 135: Argentina LVAD Industry Revenue (Billion) Forecast, by Application 2019 & 2032
- Table 136: Argentina LVAD Industry Volume (Piece) Forecast, by Application 2019 & 2032
- Table 137: Rest of South America LVAD Industry Revenue (Billion) Forecast, by Application 2019 & 2032
- Table 138: Rest of South America LVAD Industry Volume (Piece) Forecast, by Application 2019 & 2032
Frequently Asked Questions
1. What is the projected Compound Annual Growth Rate (CAGR) of the LVAD Industry?
The projected CAGR is approximately 7.23%.
2. Which companies are prominent players in the LVAD Industry?
Key companies in the market include Abiomed Inc, Calon Cardio, Terumo Corporation*List Not Exhaustive, SynCardia Systems LLC, Jarvik Heart Inc, Medtronic PLC, Abbott Laboratories (St Jude Medical Inc ), BiVACOR Inc, Berlin Heart GmbH.
3. What are the main segments of the LVAD Industry?
The market segments include Type of Ventricular Device, Application.
4. Can you provide details about the market size?
The market size is estimated to be USD 1.8 Billion as of 2022.
5. What are some drivers contributing to market growth?
Growing Burden of Cardiac Diseases and Heart Failure; Technological Advancement of Devices for Cardiac Diseases Management; Growing Initiatives and Awareness Regarding Cardiovascular Diseases.
6. What are the notable trends driving market growth?
Left Ventricular Assist Device (LVAD) is Expected to Hold the Major Share in the Type of Ventricular Device Segment.
7. Are there any restraints impacting market growth?
High Cost of Devices and Procedures; Several Risks Associated to VAD Implant.
8. Can you provide examples of recent developments in the market?
In January 2022, the School of Medical Research and Technology (SMRT) of IIT Kanpur has launched Hridyantra, a challenge-based program to develop an advanced artificial heart also called Left Ventricular Assist device (LVAD) for patients with end-stage heart failure.
9. What pricing options are available for accessing the report?
Pricing options include single-user, multi-user, and enterprise licenses priced at USD 4750, USD 5250, and USD 8750 respectively.
10. Is the market size provided in terms of value or volume?
The market size is provided in terms of value, measured in Billion and volume, measured in Piece.
11. Are there any specific market keywords associated with the report?
Yes, the market keyword associated with the report is "LVAD Industry," which aids in identifying and referencing the specific market segment covered.
12. How do I determine which pricing option suits my needs best?
The pricing options vary based on user requirements and access needs. Individual users may opt for single-user licenses, while businesses requiring broader access may choose multi-user or enterprise licenses for cost-effective access to the report.
13. Are there any additional resources or data provided in the LVAD Industry report?
While the report offers comprehensive insights, it's advisable to review the specific contents or supplementary materials provided to ascertain if additional resources or data are available.
14. How can I stay updated on further developments or reports in the LVAD Industry?
To stay informed about further developments, trends, and reports in the LVAD Industry, consider subscribing to industry newsletters, following relevant companies and organizations, or regularly checking reputable industry news sources and publications.
Methodology
Step 1 - Identification of Relevant Samples Size from Population Database


Step 2 - Approaches for Defining Global Market Size (Value, Volume* & Price*)

Note*: In applicable scenarios
Step 3 - Data Sources
Primary Research
- Web Analytics
- Survey Reports
- Research Institute
- Latest Research Reports
- Opinion Leaders
Secondary Research
- Annual Reports
- White Paper
- Latest Press Release
- Industry Association
- Paid Database
- Investor Presentations

Step 4 - Data Triangulation
Involves using different sources of information in order to increase the validity of a study
These sources are likely to be stakeholders in a program - participants, other researchers, program staff, other community members, and so on.
Then we put all data in single framework & apply various statistical tools to find out the dynamic on the market.
During the analysis stage, feedback from the stakeholder groups would be compared to determine areas of agreement as well as areas of divergence
