

Key Insights
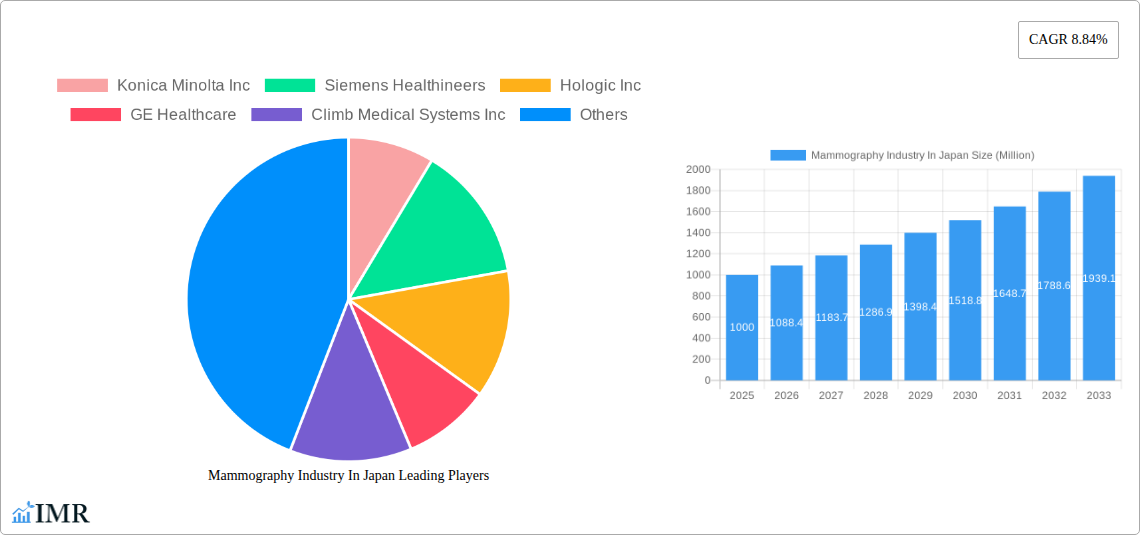
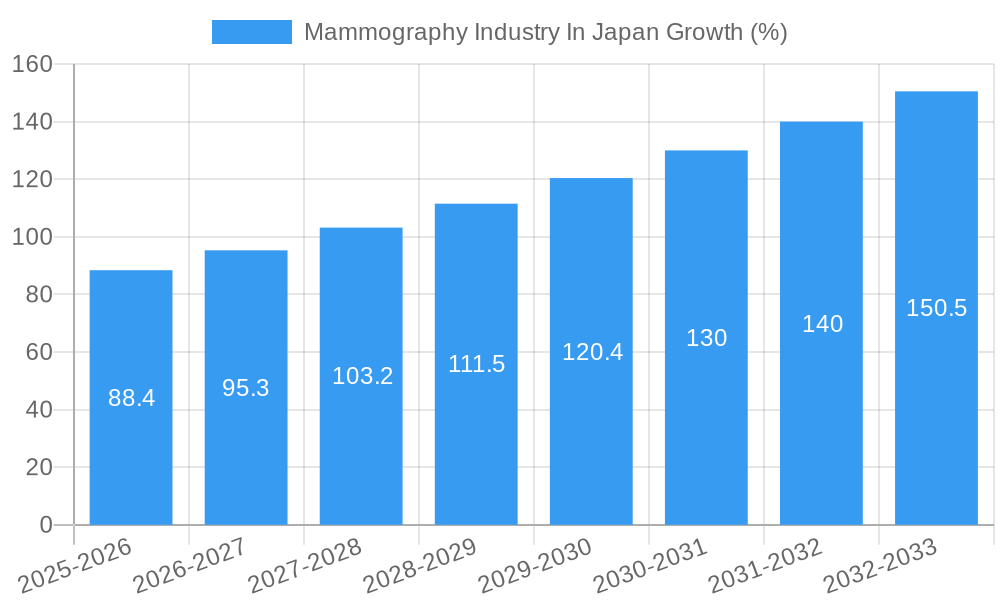
The Japanese mammography market, valued at an estimated ¥150 billion (approximately $1 billion USD) in 2025, is experiencing robust growth, projected to expand at a compound annual growth rate (CAGR) of 8.84% from 2025 to 2033. This growth is fueled by several key factors. Firstly, an aging population in Japan is increasing the prevalence of breast cancer, driving demand for early detection and diagnostic services. Secondly, advancements in mammography technology, particularly the adoption of 3D mammography systems offering improved image quality and diagnostic accuracy, are significantly impacting market expansion. Increased government initiatives promoting early cancer screening and improved healthcare infrastructure further contribute to this positive growth trajectory. However, the market faces challenges such as high equipment costs and the need for skilled radiologists, potentially limiting market penetration in certain regions. The segment of 3D mammography systems is expected to exhibit the most significant growth, outpacing the adoption of analog systems due to its superior diagnostic capabilities. Hospitals remain the dominant end-users, owing to their established infrastructure and capacity for advanced imaging techniques.
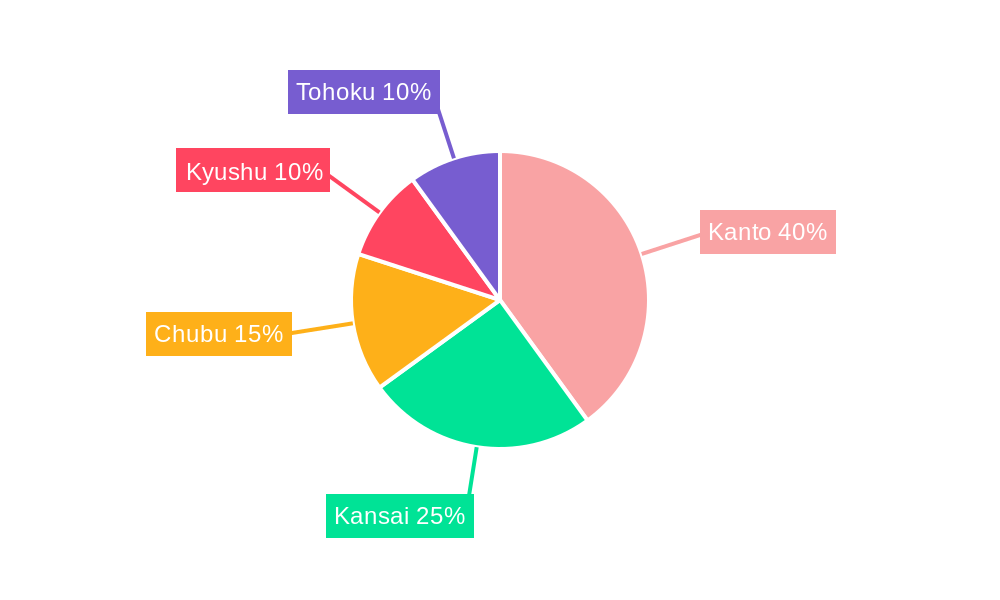
The regional breakdown within Japan reveals variations in market penetration. The Kanto region, home to major metropolitan areas, likely holds the largest market share, followed by Kansai and Chubu. However, growth is anticipated in less-developed regions like Tohoku and Kyushu, driven by government investments and healthcare infrastructure improvements targeting underserved populations. Competition among major players like Konica Minolta, Siemens Healthineers, Hologic, and Fujifilm is intense, with companies focusing on technological innovation, strategic partnerships, and service offerings to gain market share. The forecast period (2025-2033) is likely to witness a continued shift towards digital mammography systems, further contributing to the market's expansion and presenting lucrative opportunities for established and emerging players alike. Further growth will likely depend on the sustained investment in healthcare infrastructure, and continued government support for cancer screening programs.
Mammography Industry in Japan: 2019-2033 Market Report
This comprehensive report provides an in-depth analysis of the Japanese mammography market, covering market dynamics, growth trends, key players, and future outlook. The report utilizes data from 2019-2024 (Historical Period), with a base year of 2025 and a forecast period extending to 2033 (Study Period: 2019-2033; Forecast Period: 2025-2033). It segments the market by product type (Digital Systems, 3D Mammography Systems, Analog Systems, Other Product Types) and end-user (Hospitals, Specialty Clinics, Diagnostic Centers) to provide a granular understanding of this vital healthcare sector. The report is essential for industry professionals, investors, and stakeholders seeking insights into the Japanese mammography market.
Mammography Industry In Japan Market Dynamics & Structure
The Japanese mammography market is characterized by a moderate level of concentration, with key players like Konica Minolta Inc, Siemens Healthineers, and Fujifilm Holdings Corporation holding significant market share (estimated at xx% collectively in 2025). Technological innovation, driven by advancements in digital mammography and AI-powered image analysis, is a key market driver. The regulatory framework, including governmental initiatives promoting early breast cancer detection, plays a significant role. Competitive pressures stem from both domestic and international players, while substitute technologies remain limited. The aging population and rising breast cancer incidence contribute to increased demand. M&A activity remains relatively low (estimated at xx deals in the past 5 years), but strategic partnerships are increasingly common.
- Market Concentration: Moderately concentrated, with top 3 players holding xx% market share in 2025.
- Technological Innovation: Focus on digital mammography, 3D tomosynthesis, and AI-powered image analysis.
- Regulatory Framework: Governmental support for early detection programs drives market growth.
- Competitive Landscape: Mix of domestic and international players, with limited substitute technologies.
- M&A Activity: Relatively low, with a focus on strategic partnerships instead.
Mammography Industry In Japan Growth Trends & Insights
The Japanese mammography market experienced steady growth between 2019 and 2024, with a projected Compound Annual Growth Rate (CAGR) of xx% from 2025 to 2033. This growth is driven by factors including increased awareness of breast cancer, government initiatives promoting early detection, and technological advancements leading to improved diagnostic accuracy. Market penetration of digital mammography systems is expected to reach xx% by 2033, reflecting a shift away from analog systems. Consumer behavior is evolving towards a preference for faster, more accurate, and less invasive diagnostic procedures, further fueling market expansion. The market size in 2025 is estimated at ¥xx million, and is projected to reach ¥xx million by 2033.
Dominant Regions, Countries, or Segments in Mammography Industry In Japan
The largest segment within the Japanese mammography market is Digital Mammography Systems, driven by superior image quality, faster processing times, and enhanced diagnostic capabilities. The Kanto region exhibits the highest market share due to a higher population density and concentration of hospitals and diagnostic centers. Growth is primarily driven by increasing government funding for cancer screening programs, along with rising awareness among the population about the importance of regular screenings.
- Leading Segment: Digital Mammography Systems, holding xx% of the market in 2025.
- Dominant Region: Kanto region, accounting for xx% of the market share in 2025.
- Key Growth Drivers: Government funding for cancer screening, rising public awareness.
Mammography Industry In Japan Product Landscape
The Japanese mammography market showcases a range of digital and analog systems, with a clear trend towards digital systems, specifically 3D mammography systems offering enhanced image clarity and reduced radiation exposure. Technological advancements are focused on improving image quality, reducing examination time, and incorporating AI-assisted diagnostic tools. Unique selling propositions frequently include superior image resolution, streamlined workflows, and patient-friendly design features.
Key Drivers, Barriers & Challenges in Mammography Industry In Japan
Key Drivers:
- Increasing prevalence of breast cancer.
- Government initiatives promoting early detection and screening.
- Technological advancements offering improved diagnostic accuracy.
Challenges & Restraints:
- High initial investment cost of digital mammography systems.
- Limited reimbursement rates for some advanced technologies.
- Competition from established players and new entrants.
Emerging Opportunities in Mammography Industry In Japan
Emerging opportunities lie in the increasing adoption of AI-powered image analysis tools for improved diagnostic accuracy and efficiency, expanding into underserved rural areas through mobile mammography units, and developing personalized screening programs tailored to individual risk factors. Furthermore, increased focus on patient education and outreach programs can drive market expansion.
Growth Accelerators in the Mammography Industry In Japan Industry
Long-term growth will be fueled by technological breakthroughs such as improved AI algorithms for faster and more accurate diagnosis, strategic partnerships between imaging equipment manufacturers and healthcare providers, and expansion into new geographical markets beyond major urban centers. Government support for preventative healthcare and increased public awareness campaigns will also contribute significantly to market expansion.
Key Players Shaping the Mammography Industry In Japan Market
- Konica Minolta Inc
- Siemens Healthineers
- Hologic Inc
- GE Healthcare
- Climb Medical Systems Inc
- Koninklijke Philips NV
- Canon Medical Systems Corporation
- Carestream Health Inc
- Climb Medical Systems Inc
- Fujifilm Holdings Corporation
Notable Milestones in Mammography Industry In Japan Sector
- September 2021: Kao Group launches Pink Ribbon Campaign 2021 to raise breast cancer awareness and promote mammography.
- August 2021: Fujifilm Holdings Corporation integrates ScreenPoint Medical's Transpara AI into its ASPIRE Cristalle mammography system.
In-Depth Mammography Industry In Japan Market Outlook
The Japanese mammography market is poised for continued growth, driven by technological innovation, government support, and rising public awareness. Strategic partnerships and expansion into new markets will be key to unlocking future potential. The increasing adoption of AI-powered tools and a shift towards personalized screening programs will shape the market landscape in the coming years, offering significant opportunities for both established players and new entrants.
Mammography Industry In Japan Segmentation
-
1. Product Type
-
1.1. Digital Systems
- 1.1.1. 2D Mammography System
- 1.1.2. 3D Mammography System
- 1.2. Analog Systems
- 1.3. Other Product Types
-
1.1. Digital Systems
-
2. End User
- 2.1. Hospitals
- 2.2. Specialty Clinics
- 2.3. Diagnostic Centers
Mammography Industry In Japan Segmentation By Geography
-
1. North America
- 1.1. United States
- 1.2. Canada
- 1.3. Mexico
-
2. South America
- 2.1. Brazil
- 2.2. Argentina
- 2.3. Rest of South America
-
3. Europe
- 3.1. United Kingdom
- 3.2. Germany
- 3.3. France
- 3.4. Italy
- 3.5. Spain
- 3.6. Russia
- 3.7. Benelux
- 3.8. Nordics
- 3.9. Rest of Europe
-
4. Middle East & Africa
- 4.1. Turkey
- 4.2. Israel
- 4.3. GCC
- 4.4. North Africa
- 4.5. South Africa
- 4.6. Rest of Middle East & Africa
-
5. Asia Pacific
- 5.1. China
- 5.2. India
- 5.3. Japan
- 5.4. South Korea
- 5.5. ASEAN
- 5.6. Oceania
- 5.7. Rest of Asia Pacific
Mammography Industry In Japan REPORT HIGHLIGHTS
| Aspects | Details |
|---|---|
| Study Period | 2019-2033 |
| Base Year | 2024 |
| Estimated Year | 2025 |
| Forecast Period | 2025-2033 |
| Historical Period | 2019-2024 |
| Growth Rate | CAGR of 8.84% from 2019-2033 |
| Segmentation |
|
Table of Contents
- 1. Introduction
- 1.1. Research Scope
- 1.2. Market Segmentation
- 1.3. Research Methodology
- 1.4. Definitions and Assumptions
- 2. Executive Summary
- 2.1. Introduction
- 3. Market Dynamics
- 3.1. Introduction
- 3.2. Market Drivers
- 3.2.1. High Burden of Breast Cancer; Technological Advancements in the Field of Breast Imaging
- 3.3. Market Restrains
- 3.3.1. Risk of Adverse Effects from Radiation Exposure
- 3.4. Market Trends
- 3.4.1. 3D mammography segment is Expected to Hold a Significant Market Share Over the Forecast Period
- 4. Market Factor Analysis
- 4.1. Porters Five Forces
- 4.2. Supply/Value Chain
- 4.3. PESTEL analysis
- 4.4. Market Entropy
- 4.5. Patent/Trademark Analysis
- 5. Global Mammography Industry In Japan Analysis, Insights and Forecast, 2019-2031
- 5.1. Market Analysis, Insights and Forecast - by Product Type
- 5.1.1. Digital Systems
- 5.1.1.1. 2D Mammography System
- 5.1.1.2. 3D Mammography System
- 5.1.2. Analog Systems
- 5.1.3. Other Product Types
- 5.1.1. Digital Systems
- 5.2. Market Analysis, Insights and Forecast - by End User
- 5.2.1. Hospitals
- 5.2.2. Specialty Clinics
- 5.2.3. Diagnostic Centers
- 5.3. Market Analysis, Insights and Forecast - by Region
- 5.3.1. North America
- 5.3.2. South America
- 5.3.3. Europe
- 5.3.4. Middle East & Africa
- 5.3.5. Asia Pacific
- 5.1. Market Analysis, Insights and Forecast - by Product Type
- 6. North America Mammography Industry In Japan Analysis, Insights and Forecast, 2019-2031
- 6.1. Market Analysis, Insights and Forecast - by Product Type
- 6.1.1. Digital Systems
- 6.1.1.1. 2D Mammography System
- 6.1.1.2. 3D Mammography System
- 6.1.2. Analog Systems
- 6.1.3. Other Product Types
- 6.1.1. Digital Systems
- 6.2. Market Analysis, Insights and Forecast - by End User
- 6.2.1. Hospitals
- 6.2.2. Specialty Clinics
- 6.2.3. Diagnostic Centers
- 6.1. Market Analysis, Insights and Forecast - by Product Type
- 7. South America Mammography Industry In Japan Analysis, Insights and Forecast, 2019-2031
- 7.1. Market Analysis, Insights and Forecast - by Product Type
- 7.1.1. Digital Systems
- 7.1.1.1. 2D Mammography System
- 7.1.1.2. 3D Mammography System
- 7.1.2. Analog Systems
- 7.1.3. Other Product Types
- 7.1.1. Digital Systems
- 7.2. Market Analysis, Insights and Forecast - by End User
- 7.2.1. Hospitals
- 7.2.2. Specialty Clinics
- 7.2.3. Diagnostic Centers
- 7.1. Market Analysis, Insights and Forecast - by Product Type
- 8. Europe Mammography Industry In Japan Analysis, Insights and Forecast, 2019-2031
- 8.1. Market Analysis, Insights and Forecast - by Product Type
- 8.1.1. Digital Systems
- 8.1.1.1. 2D Mammography System
- 8.1.1.2. 3D Mammography System
- 8.1.2. Analog Systems
- 8.1.3. Other Product Types
- 8.1.1. Digital Systems
- 8.2. Market Analysis, Insights and Forecast - by End User
- 8.2.1. Hospitals
- 8.2.2. Specialty Clinics
- 8.2.3. Diagnostic Centers
- 8.1. Market Analysis, Insights and Forecast - by Product Type
- 9. Middle East & Africa Mammography Industry In Japan Analysis, Insights and Forecast, 2019-2031
- 9.1. Market Analysis, Insights and Forecast - by Product Type
- 9.1.1. Digital Systems
- 9.1.1.1. 2D Mammography System
- 9.1.1.2. 3D Mammography System
- 9.1.2. Analog Systems
- 9.1.3. Other Product Types
- 9.1.1. Digital Systems
- 9.2. Market Analysis, Insights and Forecast - by End User
- 9.2.1. Hospitals
- 9.2.2. Specialty Clinics
- 9.2.3. Diagnostic Centers
- 9.1. Market Analysis, Insights and Forecast - by Product Type
- 10. Asia Pacific Mammography Industry In Japan Analysis, Insights and Forecast, 2019-2031
- 10.1. Market Analysis, Insights and Forecast - by Product Type
- 10.1.1. Digital Systems
- 10.1.1.1. 2D Mammography System
- 10.1.1.2. 3D Mammography System
- 10.1.2. Analog Systems
- 10.1.3. Other Product Types
- 10.1.1. Digital Systems
- 10.2. Market Analysis, Insights and Forecast - by End User
- 10.2.1. Hospitals
- 10.2.2. Specialty Clinics
- 10.2.3. Diagnostic Centers
- 10.1. Market Analysis, Insights and Forecast - by Product Type
- 11. Kanto Mammography Industry In Japan Analysis, Insights and Forecast, 2019-2031
- 12. Kansai Mammography Industry In Japan Analysis, Insights and Forecast, 2019-2031
- 13. Chubu Mammography Industry In Japan Analysis, Insights and Forecast, 2019-2031
- 14. Kyushu Mammography Industry In Japan Analysis, Insights and Forecast, 2019-2031
- 15. Tohoku Mammography Industry In Japan Analysis, Insights and Forecast, 2019-2031
- 16. Competitive Analysis
- 16.1. Global Market Share Analysis 2024
- 16.2. Company Profiles
- 16.2.1 Konica Minolta Inc
- 16.2.1.1. Overview
- 16.2.1.2. Products
- 16.2.1.3. SWOT Analysis
- 16.2.1.4. Recent Developments
- 16.2.1.5. Financials (Based on Availability)
- 16.2.2 Siemens Healthineers
- 16.2.2.1. Overview
- 16.2.2.2. Products
- 16.2.2.3. SWOT Analysis
- 16.2.2.4. Recent Developments
- 16.2.2.5. Financials (Based on Availability)
- 16.2.3 Hologic Inc
- 16.2.3.1. Overview
- 16.2.3.2. Products
- 16.2.3.3. SWOT Analysis
- 16.2.3.4. Recent Developments
- 16.2.3.5. Financials (Based on Availability)
- 16.2.4 GE Healthcare
- 16.2.4.1. Overview
- 16.2.4.2. Products
- 16.2.4.3. SWOT Analysis
- 16.2.4.4. Recent Developments
- 16.2.4.5. Financials (Based on Availability)
- 16.2.5 Climb Medical Systems Inc
- 16.2.5.1. Overview
- 16.2.5.2. Products
- 16.2.5.3. SWOT Analysis
- 16.2.5.4. Recent Developments
- 16.2.5.5. Financials (Based on Availability)
- 16.2.6 Koninklijke Philips NV
- 16.2.6.1. Overview
- 16.2.6.2. Products
- 16.2.6.3. SWOT Analysis
- 16.2.6.4. Recent Developments
- 16.2.6.5. Financials (Based on Availability)
- 16.2.7 Canon Medical Systems Corporation
- 16.2.7.1. Overview
- 16.2.7.2. Products
- 16.2.7.3. SWOT Analysis
- 16.2.7.4. Recent Developments
- 16.2.7.5. Financials (Based on Availability)
- 16.2.8 Carestream Health Inc
- 16.2.8.1. Overview
- 16.2.8.2. Products
- 16.2.8.3. SWOT Analysis
- 16.2.8.4. Recent Developments
- 16.2.8.5. Financials (Based on Availability)
- 16.2.9 Climb Medical Systems Inc *List Not Exhaustive
- 16.2.9.1. Overview
- 16.2.9.2. Products
- 16.2.9.3. SWOT Analysis
- 16.2.9.4. Recent Developments
- 16.2.9.5. Financials (Based on Availability)
- 16.2.10 Fujifilm Holdings Corporation
- 16.2.10.1. Overview
- 16.2.10.2. Products
- 16.2.10.3. SWOT Analysis
- 16.2.10.4. Recent Developments
- 16.2.10.5. Financials (Based on Availability)
- 16.2.1 Konica Minolta Inc
List of Figures
- Figure 1: Global Mammography Industry In Japan Revenue Breakdown (Million, %) by Region 2024 & 2032
- Figure 2: Japan Mammography Industry In Japan Revenue (Million), by Country 2024 & 2032
- Figure 3: Japan Mammography Industry In Japan Revenue Share (%), by Country 2024 & 2032
- Figure 4: North America Mammography Industry In Japan Revenue (Million), by Product Type 2024 & 2032
- Figure 5: North America Mammography Industry In Japan Revenue Share (%), by Product Type 2024 & 2032
- Figure 6: North America Mammography Industry In Japan Revenue (Million), by End User 2024 & 2032
- Figure 7: North America Mammography Industry In Japan Revenue Share (%), by End User 2024 & 2032
- Figure 8: North America Mammography Industry In Japan Revenue (Million), by Country 2024 & 2032
- Figure 9: North America Mammography Industry In Japan Revenue Share (%), by Country 2024 & 2032
- Figure 10: South America Mammography Industry In Japan Revenue (Million), by Product Type 2024 & 2032
- Figure 11: South America Mammography Industry In Japan Revenue Share (%), by Product Type 2024 & 2032
- Figure 12: South America Mammography Industry In Japan Revenue (Million), by End User 2024 & 2032
- Figure 13: South America Mammography Industry In Japan Revenue Share (%), by End User 2024 & 2032
- Figure 14: South America Mammography Industry In Japan Revenue (Million), by Country 2024 & 2032
- Figure 15: South America Mammography Industry In Japan Revenue Share (%), by Country 2024 & 2032
- Figure 16: Europe Mammography Industry In Japan Revenue (Million), by Product Type 2024 & 2032
- Figure 17: Europe Mammography Industry In Japan Revenue Share (%), by Product Type 2024 & 2032
- Figure 18: Europe Mammography Industry In Japan Revenue (Million), by End User 2024 & 2032
- Figure 19: Europe Mammography Industry In Japan Revenue Share (%), by End User 2024 & 2032
- Figure 20: Europe Mammography Industry In Japan Revenue (Million), by Country 2024 & 2032
- Figure 21: Europe Mammography Industry In Japan Revenue Share (%), by Country 2024 & 2032
- Figure 22: Middle East & Africa Mammography Industry In Japan Revenue (Million), by Product Type 2024 & 2032
- Figure 23: Middle East & Africa Mammography Industry In Japan Revenue Share (%), by Product Type 2024 & 2032
- Figure 24: Middle East & Africa Mammography Industry In Japan Revenue (Million), by End User 2024 & 2032
- Figure 25: Middle East & Africa Mammography Industry In Japan Revenue Share (%), by End User 2024 & 2032
- Figure 26: Middle East & Africa Mammography Industry In Japan Revenue (Million), by Country 2024 & 2032
- Figure 27: Middle East & Africa Mammography Industry In Japan Revenue Share (%), by Country 2024 & 2032
- Figure 28: Asia Pacific Mammography Industry In Japan Revenue (Million), by Product Type 2024 & 2032
- Figure 29: Asia Pacific Mammography Industry In Japan Revenue Share (%), by Product Type 2024 & 2032
- Figure 30: Asia Pacific Mammography Industry In Japan Revenue (Million), by End User 2024 & 2032
- Figure 31: Asia Pacific Mammography Industry In Japan Revenue Share (%), by End User 2024 & 2032
- Figure 32: Asia Pacific Mammography Industry In Japan Revenue (Million), by Country 2024 & 2032
- Figure 33: Asia Pacific Mammography Industry In Japan Revenue Share (%), by Country 2024 & 2032
List of Tables
- Table 1: Global Mammography Industry In Japan Revenue Million Forecast, by Region 2019 & 2032
- Table 2: Global Mammography Industry In Japan Revenue Million Forecast, by Product Type 2019 & 2032
- Table 3: Global Mammography Industry In Japan Revenue Million Forecast, by End User 2019 & 2032
- Table 4: Global Mammography Industry In Japan Revenue Million Forecast, by Region 2019 & 2032
- Table 5: Global Mammography Industry In Japan Revenue Million Forecast, by Country 2019 & 2032
- Table 6: Kanto Mammography Industry In Japan Revenue (Million) Forecast, by Application 2019 & 2032
- Table 7: Kansai Mammography Industry In Japan Revenue (Million) Forecast, by Application 2019 & 2032
- Table 8: Chubu Mammography Industry In Japan Revenue (Million) Forecast, by Application 2019 & 2032
- Table 9: Kyushu Mammography Industry In Japan Revenue (Million) Forecast, by Application 2019 & 2032
- Table 10: Tohoku Mammography Industry In Japan Revenue (Million) Forecast, by Application 2019 & 2032
- Table 11: Global Mammography Industry In Japan Revenue Million Forecast, by Product Type 2019 & 2032
- Table 12: Global Mammography Industry In Japan Revenue Million Forecast, by End User 2019 & 2032
- Table 13: Global Mammography Industry In Japan Revenue Million Forecast, by Country 2019 & 2032
- Table 14: United States Mammography Industry In Japan Revenue (Million) Forecast, by Application 2019 & 2032
- Table 15: Canada Mammography Industry In Japan Revenue (Million) Forecast, by Application 2019 & 2032
- Table 16: Mexico Mammography Industry In Japan Revenue (Million) Forecast, by Application 2019 & 2032
- Table 17: Global Mammography Industry In Japan Revenue Million Forecast, by Product Type 2019 & 2032
- Table 18: Global Mammography Industry In Japan Revenue Million Forecast, by End User 2019 & 2032
- Table 19: Global Mammography Industry In Japan Revenue Million Forecast, by Country 2019 & 2032
- Table 20: Brazil Mammography Industry In Japan Revenue (Million) Forecast, by Application 2019 & 2032
- Table 21: Argentina Mammography Industry In Japan Revenue (Million) Forecast, by Application 2019 & 2032
- Table 22: Rest of South America Mammography Industry In Japan Revenue (Million) Forecast, by Application 2019 & 2032
- Table 23: Global Mammography Industry In Japan Revenue Million Forecast, by Product Type 2019 & 2032
- Table 24: Global Mammography Industry In Japan Revenue Million Forecast, by End User 2019 & 2032
- Table 25: Global Mammography Industry In Japan Revenue Million Forecast, by Country 2019 & 2032
- Table 26: United Kingdom Mammography Industry In Japan Revenue (Million) Forecast, by Application 2019 & 2032
- Table 27: Germany Mammography Industry In Japan Revenue (Million) Forecast, by Application 2019 & 2032
- Table 28: France Mammography Industry In Japan Revenue (Million) Forecast, by Application 2019 & 2032
- Table 29: Italy Mammography Industry In Japan Revenue (Million) Forecast, by Application 2019 & 2032
- Table 30: Spain Mammography Industry In Japan Revenue (Million) Forecast, by Application 2019 & 2032
- Table 31: Russia Mammography Industry In Japan Revenue (Million) Forecast, by Application 2019 & 2032
- Table 32: Benelux Mammography Industry In Japan Revenue (Million) Forecast, by Application 2019 & 2032
- Table 33: Nordics Mammography Industry In Japan Revenue (Million) Forecast, by Application 2019 & 2032
- Table 34: Rest of Europe Mammography Industry In Japan Revenue (Million) Forecast, by Application 2019 & 2032
- Table 35: Global Mammography Industry In Japan Revenue Million Forecast, by Product Type 2019 & 2032
- Table 36: Global Mammography Industry In Japan Revenue Million Forecast, by End User 2019 & 2032
- Table 37: Global Mammography Industry In Japan Revenue Million Forecast, by Country 2019 & 2032
- Table 38: Turkey Mammography Industry In Japan Revenue (Million) Forecast, by Application 2019 & 2032
- Table 39: Israel Mammography Industry In Japan Revenue (Million) Forecast, by Application 2019 & 2032
- Table 40: GCC Mammography Industry In Japan Revenue (Million) Forecast, by Application 2019 & 2032
- Table 41: North Africa Mammography Industry In Japan Revenue (Million) Forecast, by Application 2019 & 2032
- Table 42: South Africa Mammography Industry In Japan Revenue (Million) Forecast, by Application 2019 & 2032
- Table 43: Rest of Middle East & Africa Mammography Industry In Japan Revenue (Million) Forecast, by Application 2019 & 2032
- Table 44: Global Mammography Industry In Japan Revenue Million Forecast, by Product Type 2019 & 2032
- Table 45: Global Mammography Industry In Japan Revenue Million Forecast, by End User 2019 & 2032
- Table 46: Global Mammography Industry In Japan Revenue Million Forecast, by Country 2019 & 2032
- Table 47: China Mammography Industry In Japan Revenue (Million) Forecast, by Application 2019 & 2032
- Table 48: India Mammography Industry In Japan Revenue (Million) Forecast, by Application 2019 & 2032
- Table 49: Japan Mammography Industry In Japan Revenue (Million) Forecast, by Application 2019 & 2032
- Table 50: South Korea Mammography Industry In Japan Revenue (Million) Forecast, by Application 2019 & 2032
- Table 51: ASEAN Mammography Industry In Japan Revenue (Million) Forecast, by Application 2019 & 2032
- Table 52: Oceania Mammography Industry In Japan Revenue (Million) Forecast, by Application 2019 & 2032
- Table 53: Rest of Asia Pacific Mammography Industry In Japan Revenue (Million) Forecast, by Application 2019 & 2032
Frequently Asked Questions
1. What is the projected Compound Annual Growth Rate (CAGR) of the Mammography Industry In Japan?
The projected CAGR is approximately 8.84%.
2. Which companies are prominent players in the Mammography Industry In Japan?
Key companies in the market include Konica Minolta Inc, Siemens Healthineers, Hologic Inc, GE Healthcare, Climb Medical Systems Inc, Koninklijke Philips NV, Canon Medical Systems Corporation, Carestream Health Inc, Climb Medical Systems Inc *List Not Exhaustive, Fujifilm Holdings Corporation.
3. What are the main segments of the Mammography Industry In Japan?
The market segments include Product Type, End User.
4. Can you provide details about the market size?
The market size is estimated to be USD XX Million as of 2022.
5. What are some drivers contributing to market growth?
High Burden of Breast Cancer; Technological Advancements in the Field of Breast Imaging.
6. What are the notable trends driving market growth?
3D mammography segment is Expected to Hold a Significant Market Share Over the Forecast Period.
7. Are there any restraints impacting market growth?
Risk of Adverse Effects from Radiation Exposure.
8. Can you provide examples of recent developments in the market?
In September 2021, Kao Group announced that it initiated a Pink Ribbon Campaign 2021 to create awareness of breast cancer among Japanese people and promoted mammography for diagnosis of this cancer.
9. What pricing options are available for accessing the report?
Pricing options include single-user, multi-user, and enterprise licenses priced at USD 3800, USD 4500, and USD 5800 respectively.
10. Is the market size provided in terms of value or volume?
The market size is provided in terms of value, measured in Million.
11. Are there any specific market keywords associated with the report?
Yes, the market keyword associated with the report is "Mammography Industry In Japan," which aids in identifying and referencing the specific market segment covered.
12. How do I determine which pricing option suits my needs best?
The pricing options vary based on user requirements and access needs. Individual users may opt for single-user licenses, while businesses requiring broader access may choose multi-user or enterprise licenses for cost-effective access to the report.
13. Are there any additional resources or data provided in the Mammography Industry In Japan report?
While the report offers comprehensive insights, it's advisable to review the specific contents or supplementary materials provided to ascertain if additional resources or data are available.
14. How can I stay updated on further developments or reports in the Mammography Industry In Japan?
To stay informed about further developments, trends, and reports in the Mammography Industry In Japan, consider subscribing to industry newsletters, following relevant companies and organizations, or regularly checking reputable industry news sources and publications.
Methodology
Step 1 - Identification of Relevant Samples Size from Population Database


Step 2 - Approaches for Defining Global Market Size (Value, Volume* & Price*)

Note*: In applicable scenarios
Step 3 - Data Sources
Primary Research
- Web Analytics
- Survey Reports
- Research Institute
- Latest Research Reports
- Opinion Leaders
Secondary Research
- Annual Reports
- White Paper
- Latest Press Release
- Industry Association
- Paid Database
- Investor Presentations

Step 4 - Data Triangulation
Involves using different sources of information in order to increase the validity of a study
These sources are likely to be stakeholders in a program - participants, other researchers, program staff, other community members, and so on.
Then we put all data in single framework & apply various statistical tools to find out the dynamic on the market.
During the analysis stage, feedback from the stakeholder groups would be compared to determine areas of agreement as well as areas of divergence
