

Key Insights
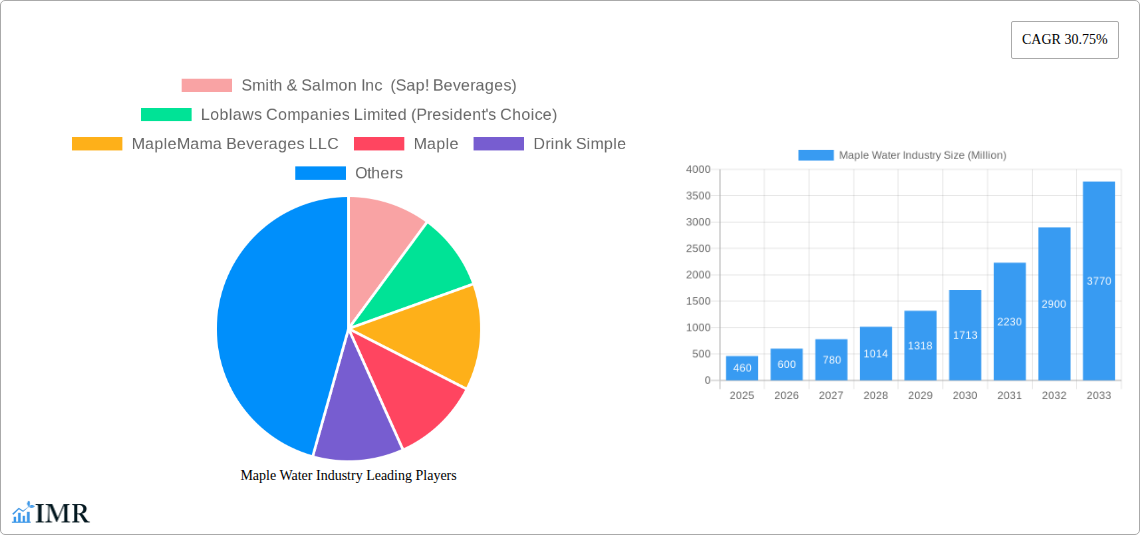
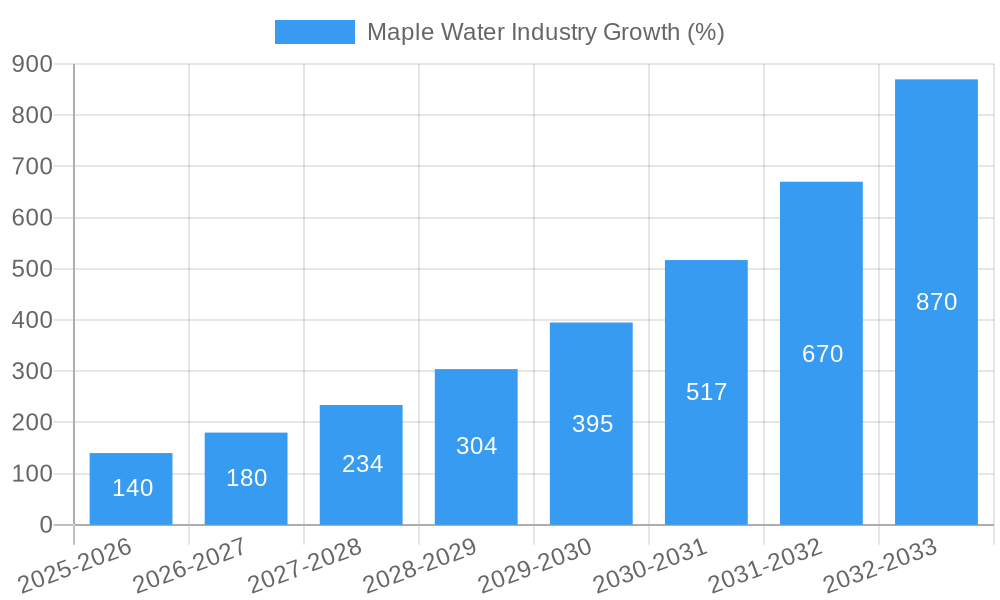
The maple water market, currently valued at $460 million (0.46 billion) in 2025, exhibits robust growth potential, projected to expand at a compound annual growth rate (CAGR) of 30.75% from 2025 to 2033. This surge is driven by several key factors. Increasing consumer awareness of health and wellness fuels demand for natural, low-calorie beverages. Maple water's inherent nutritional benefits, including electrolytes and antioxidants, further contribute to its appeal, particularly among health-conscious millennials and Gen Z consumers. The growing popularity of plant-based alternatives to traditional beverages also presents a significant market opportunity. Furthermore, innovative product offerings, such as flavored maple water variations and diverse packaging options (bottles, cartons, etc.), cater to evolving consumer preferences and expand market reach. Strategic distribution channels, encompassing supermarkets, convenience stores, online retailers, and specialty stores, facilitate broader accessibility and enhance market penetration. While competitive pressures from established beverage brands exist, the unique properties and health halo of maple water position it for continued growth.
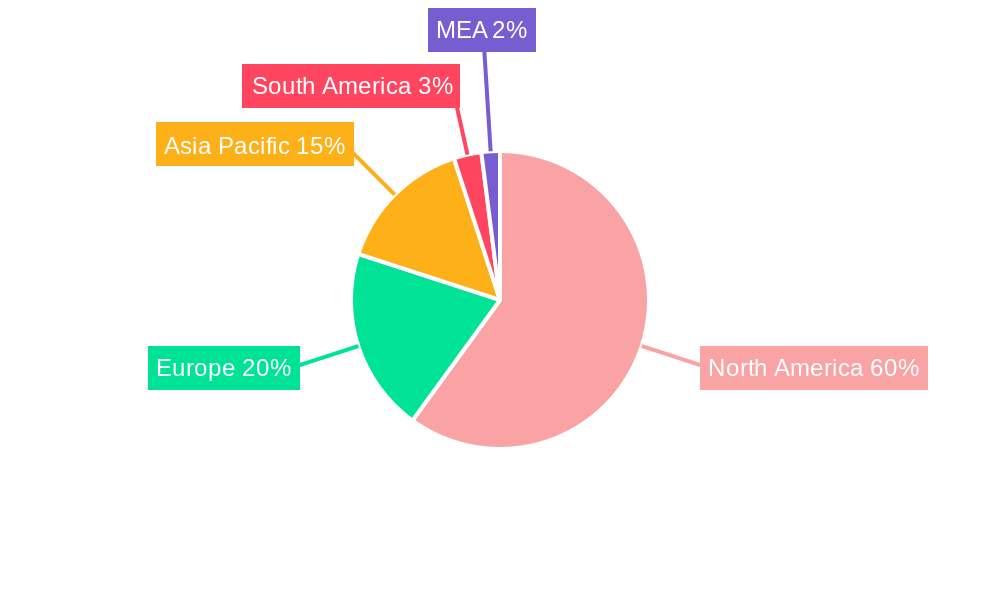
The North American market, encompassing the United States, Canada, and Mexico, currently dominates the global maple water landscape, driven by high consumer demand and established production infrastructure. However, significant growth opportunities exist in other regions, particularly in Europe and Asia-Pacific. Expansion into these markets will be fueled by increased product awareness campaigns and strategic partnerships with local distributors. Challenges include fluctuating raw material prices and ensuring consistent product quality to maintain consumer trust. Successfully navigating these challenges through efficient supply chain management and brand building will be critical to sustaining the market’s impressive growth trajectory. The market segmentation highlights the importance of understanding consumer preferences in packaging and flavor profiles to optimize product offerings and maximize market share across different distribution channels.
Maple Water Industry: A Comprehensive Market Report (2019-2033)
This comprehensive report provides an in-depth analysis of the maple water industry, offering invaluable insights for industry professionals, investors, and strategic planners. The study period covers 2019-2033, with a focus on the base year 2025 and a forecast period of 2025-2033. The report leverages extensive market research and data analysis to provide a clear picture of the current landscape and future trajectory of this dynamic sector. The total market size in 2025 is estimated at xx Million, projected to reach xx Million by 2033.
Maple Water Industry Market Dynamics & Structure
The maple water industry is characterized by a moderately fragmented market structure, with several key players competing for market share. Market concentration is relatively low, presenting opportunities for new entrants. Technological innovation, particularly in packaging and processing, is a key driver of growth, alongside rising consumer demand for healthier beverages. Regulatory frameworks vary across different regions, influencing production and distribution. Competitive substitutes include other functional beverages, such as coconut water and fruit juices. The end-user demographics are predominantly health-conscious millennials and Gen Z consumers. M&A activity has been moderate, with a few significant deals shaping the market landscape in recent years. The volume of M&A deals is estimated to be xx in 2024.
- Market Concentration: Low to Moderate (xx% market share held by top 5 players in 2025)
- Technological Innovation: Focus on sustainable packaging and enhanced flavor profiles.
- Regulatory Framework: Varies by region, impacting production costs and distribution.
- Competitive Substitutes: Coconut water, fruit juices, and other functional beverages.
- End-User Demographics: Health-conscious consumers, millennials, and Gen Z.
- M&A Trends: Moderate activity, with potential for increased consolidation in the coming years.
Maple Water Industry Growth Trends & Insights
The maple water market has witnessed significant growth over the past few years, driven by increasing consumer awareness of its health benefits and unique taste profile. The market size experienced a CAGR of xx% during the historical period (2019-2024). This growth is expected to continue during the forecast period (2025-2033), albeit at a slightly moderated pace, with a projected CAGR of xx%. This moderation is partly due to market saturation in some established regions and the emergence of competing functional beverages. Technological disruptions, such as advancements in extraction and preservation techniques, are further propelling market expansion. Changing consumer preferences towards natural and healthier alternatives are also key factors influencing growth. Market penetration is currently estimated at xx% in North America and is expected to reach xx% by 2033.
Dominant Regions, Countries, or Segments in Maple Water Industry
North America (specifically the US and Canada) currently dominates the maple water market, driven by high maple syrup production and strong consumer demand for locally sourced and natural beverages. Within the product landscape, unflavored maple water holds the largest market share in terms of volume, with flavored varieties showing strong growth potential. Bottles are the most prevalent packaging type, although cartons/Tetra Pak are gaining traction due to their sustainability benefits. Supermarkets/Hypermarkets represent the major distribution channel, but online retail and specialty stores are showing increased importance.
- Key Drivers in North America: Strong consumer preference for natural beverages, well-established distribution channels, and high maple syrup production.
- Product Type: Unflavored maple water currently dominates.
- Packaging Type: Bottles remain the leading packaging choice.
- Distribution Channel: Supermarkets/hypermarkets are the primary channel.
Maple Water Industry Product Landscape
Maple water products are largely differentiated based on flavor profiles (e.g., plain, vanilla, coconut) and packaging types. Recent innovations focus on enhanced taste, convenience (e.g., ready-to-drink formats), and sustainable packaging. Many brands emphasize the natural source and health benefits (e.g., electrolytes, antioxidants) of maple water as unique selling propositions. Technological advancements are focused on improving extraction methods to maximize yield and maintain quality.
Key Drivers, Barriers & Challenges in Maple Water Industry
Key Drivers:
- Growing consumer preference for healthy, natural beverages.
- Increased awareness of maple water's health benefits.
- Innovation in packaging and flavor profiles.
Challenges:
- Seasonal availability of maple sap impacts production.
- Competition from other functional beverages.
- Relatively high production costs compared to other beverages. This results in a higher price point that limits market penetration.
Emerging Opportunities in Maple Water Industry
- Expansion into new geographical markets (e.g., Asia, Europe).
- Development of novel flavors and product formats (e.g., ready-to-mix concentrates).
- Strategic partnerships with food and beverage companies for co-branding and distribution.
Growth Accelerators in the Maple Water Industry Industry
Technological advancements in extraction and processing, coupled with strategic partnerships to expand distribution networks and marketing efforts, will be crucial for driving long-term growth. Exploring untapped markets and adapting to evolving consumer preferences, including organic and sustainable product options, also presents significant opportunities.
Key Players Shaping the Maple Water Industry Market
- Smith & Salmon Inc (Sap! Beverages)
- Loblaws Companies Limited (President's Choice)
- MapleMama Beverages LLC
- Maple
- Drink Simple
- Lower Valley Beverage Co (sapsucker)
- Kiki Maple Water
- Feronia Forests LLC (Vertical Water)
- Pure Maple Water Company Ltd
- Asarasi
Notable Milestones in Maple Water Industry Sector
- 2020: Launch of several new flavored maple water products.
- 2022: Increased investment in sustainable packaging solutions by major players.
- 2023: First major M&A deal in the industry.
In-Depth Maple Water Industry Market Outlook
The maple water industry is poised for continued growth, driven by increasing health consciousness and the unique properties of the product. Strategic investments in research and development, along with expansion into new markets, will be key to unlocking the full market potential and capitalizing on emerging opportunities within the functional beverage segment.
Maple Water Industry Segmentation
-
1. Product Type
- 1.1. Flavored
- 1.2. Unflavored
-
2. Packaging Type
- 2.1. Bottles
- 2.2. Cartons/Tetra Pak
- 2.3. Other Packaging Types
-
3. Distribution Channel
- 3.1. Supermarkets/Hypermarkets
- 3.2. Convenience Stores
- 3.3. Specialty Stores
- 3.4. Online Retail Stores
- 3.5. Other Distribution Channels
Maple Water Industry Segmentation By Geography
-
1. North America
- 1.1. United States
- 1.2. Canada
- 1.3. Mexico
- 1.4. Rest of North America
-
2. Europe
- 2.1. Germany
- 2.2. United Kingdom
- 2.3. France
- 2.4. Italy
- 2.5. Spain
- 2.6. Rest of Europe
-
3. Asia Pacific
- 3.1. China
- 3.2. India
- 3.3. Australia
- 3.4. Japan
-
4. Rest of the World
- 4.1. South America
- 4.2. Middle East and Africa
Maple Water Industry REPORT HIGHLIGHTS
| Aspects | Details |
|---|---|
| Study Period | 2019-2033 |
| Base Year | 2024 |
| Estimated Year | 2025 |
| Forecast Period | 2025-2033 |
| Historical Period | 2019-2024 |
| Growth Rate | CAGR of 30.75% from 2019-2033 |
| Segmentation |
|
Table of Contents
- 1. Introduction
- 1.1. Research Scope
- 1.2. Market Segmentation
- 1.3. Research Methodology
- 1.4. Definitions and Assumptions
- 2. Executive Summary
- 2.1. Introduction
- 3. Market Dynamics
- 3.1. Introduction
- 3.2. Market Drivers
- 3.2.1. Popularization of Adventure Sports and Expedition; Suitability of the Freeze-Dried Technique for Heat Sensitive Food Products
- 3.3. Market Restrains
- 3.3.1. High Cost Associated with the Freeze-Drying Technology
- 3.4. Market Trends
- 3.4.1. Value-added Hydration is Evolving Consumer Preferences in the Maple Water Market
- 4. Market Factor Analysis
- 4.1. Porters Five Forces
- 4.2. Supply/Value Chain
- 4.3. PESTEL analysis
- 4.4. Market Entropy
- 4.5. Patent/Trademark Analysis
- 5. Global Maple Water Industry Analysis, Insights and Forecast, 2019-2031
- 5.1. Market Analysis, Insights and Forecast - by Product Type
- 5.1.1. Flavored
- 5.1.2. Unflavored
- 5.2. Market Analysis, Insights and Forecast - by Packaging Type
- 5.2.1. Bottles
- 5.2.2. Cartons/Tetra Pak
- 5.2.3. Other Packaging Types
- 5.3. Market Analysis, Insights and Forecast - by Distribution Channel
- 5.3.1. Supermarkets/Hypermarkets
- 5.3.2. Convenience Stores
- 5.3.3. Specialty Stores
- 5.3.4. Online Retail Stores
- 5.3.5. Other Distribution Channels
- 5.4. Market Analysis, Insights and Forecast - by Region
- 5.4.1. North America
- 5.4.2. Europe
- 5.4.3. Asia Pacific
- 5.4.4. Rest of the World
- 5.1. Market Analysis, Insights and Forecast - by Product Type
- 6. North America Maple Water Industry Analysis, Insights and Forecast, 2019-2031
- 6.1. Market Analysis, Insights and Forecast - by Product Type
- 6.1.1. Flavored
- 6.1.2. Unflavored
- 6.2. Market Analysis, Insights and Forecast - by Packaging Type
- 6.2.1. Bottles
- 6.2.2. Cartons/Tetra Pak
- 6.2.3. Other Packaging Types
- 6.3. Market Analysis, Insights and Forecast - by Distribution Channel
- 6.3.1. Supermarkets/Hypermarkets
- 6.3.2. Convenience Stores
- 6.3.3. Specialty Stores
- 6.3.4. Online Retail Stores
- 6.3.5. Other Distribution Channels
- 6.1. Market Analysis, Insights and Forecast - by Product Type
- 7. Europe Maple Water Industry Analysis, Insights and Forecast, 2019-2031
- 7.1. Market Analysis, Insights and Forecast - by Product Type
- 7.1.1. Flavored
- 7.1.2. Unflavored
- 7.2. Market Analysis, Insights and Forecast - by Packaging Type
- 7.2.1. Bottles
- 7.2.2. Cartons/Tetra Pak
- 7.2.3. Other Packaging Types
- 7.3. Market Analysis, Insights and Forecast - by Distribution Channel
- 7.3.1. Supermarkets/Hypermarkets
- 7.3.2. Convenience Stores
- 7.3.3. Specialty Stores
- 7.3.4. Online Retail Stores
- 7.3.5. Other Distribution Channels
- 7.1. Market Analysis, Insights and Forecast - by Product Type
- 8. Asia Pacific Maple Water Industry Analysis, Insights and Forecast, 2019-2031
- 8.1. Market Analysis, Insights and Forecast - by Product Type
- 8.1.1. Flavored
- 8.1.2. Unflavored
- 8.2. Market Analysis, Insights and Forecast - by Packaging Type
- 8.2.1. Bottles
- 8.2.2. Cartons/Tetra Pak
- 8.2.3. Other Packaging Types
- 8.3. Market Analysis, Insights and Forecast - by Distribution Channel
- 8.3.1. Supermarkets/Hypermarkets
- 8.3.2. Convenience Stores
- 8.3.3. Specialty Stores
- 8.3.4. Online Retail Stores
- 8.3.5. Other Distribution Channels
- 8.1. Market Analysis, Insights and Forecast - by Product Type
- 9. Rest of the World Maple Water Industry Analysis, Insights and Forecast, 2019-2031
- 9.1. Market Analysis, Insights and Forecast - by Product Type
- 9.1.1. Flavored
- 9.1.2. Unflavored
- 9.2. Market Analysis, Insights and Forecast - by Packaging Type
- 9.2.1. Bottles
- 9.2.2. Cartons/Tetra Pak
- 9.2.3. Other Packaging Types
- 9.3. Market Analysis, Insights and Forecast - by Distribution Channel
- 9.3.1. Supermarkets/Hypermarkets
- 9.3.2. Convenience Stores
- 9.3.3. Specialty Stores
- 9.3.4. Online Retail Stores
- 9.3.5. Other Distribution Channels
- 9.1. Market Analysis, Insights and Forecast - by Product Type
- 10. North America Maple Water Industry Analysis, Insights and Forecast, 2019-2031
- 10.1. Market Analysis, Insights and Forecast - By Country/Sub-region
- 10.1.1 United States
- 10.1.2 Canada
- 10.1.3 Mexico
- 11. Europe Maple Water Industry Analysis, Insights and Forecast, 2019-2031
- 11.1. Market Analysis, Insights and Forecast - By Country/Sub-region
- 11.1.1 Germany
- 11.1.2 United Kingdom
- 11.1.3 France
- 11.1.4 Spain
- 11.1.5 Italy
- 11.1.6 Spain
- 11.1.7 Belgium
- 11.1.8 Netherland
- 11.1.9 Nordics
- 11.1.10 Rest of Europe
- 12. Asia Pacific Maple Water Industry Analysis, Insights and Forecast, 2019-2031
- 12.1. Market Analysis, Insights and Forecast - By Country/Sub-region
- 12.1.1 China
- 12.1.2 Japan
- 12.1.3 India
- 12.1.4 South Korea
- 12.1.5 Southeast Asia
- 12.1.6 Australia
- 12.1.7 Indonesia
- 12.1.8 Phillipes
- 12.1.9 Singapore
- 12.1.10 Thailandc
- 12.1.11 Rest of Asia Pacific
- 13. South America Maple Water Industry Analysis, Insights and Forecast, 2019-2031
- 13.1. Market Analysis, Insights and Forecast - By Country/Sub-region
- 13.1.1 Brazil
- 13.1.2 Argentina
- 13.1.3 Peru
- 13.1.4 Chile
- 13.1.5 Colombia
- 13.1.6 Ecuador
- 13.1.7 Venezuela
- 13.1.8 Rest of South America
- 14. North America Maple Water Industry Analysis, Insights and Forecast, 2019-2031
- 14.1. Market Analysis, Insights and Forecast - By Country/Sub-region
- 14.1.1 United States
- 14.1.2 Canada
- 14.1.3 Mexico
- 15. MEA Maple Water Industry Analysis, Insights and Forecast, 2019-2031
- 15.1. Market Analysis, Insights and Forecast - By Country/Sub-region
- 15.1.1 United Arab Emirates
- 15.1.2 Saudi Arabia
- 15.1.3 South Africa
- 15.1.4 Rest of Middle East and Africa
- 16. Competitive Analysis
- 16.1. Global Market Share Analysis 2024
- 16.2. Company Profiles
- 16.2.1 Smith & Salmon Inc (Sap! Beverages)
- 16.2.1.1. Overview
- 16.2.1.2. Products
- 16.2.1.3. SWOT Analysis
- 16.2.1.4. Recent Developments
- 16.2.1.5. Financials (Based on Availability)
- 16.2.2 Loblaws Companies Limited (President's Choice)
- 16.2.2.1. Overview
- 16.2.2.2. Products
- 16.2.2.3. SWOT Analysis
- 16.2.2.4. Recent Developments
- 16.2.2.5. Financials (Based on Availability)
- 16.2.3 MapleMama Beverages LLC
- 16.2.3.1. Overview
- 16.2.3.2. Products
- 16.2.3.3. SWOT Analysis
- 16.2.3.4. Recent Developments
- 16.2.3.5. Financials (Based on Availability)
- 16.2.4 Maple
- 16.2.4.1. Overview
- 16.2.4.2. Products
- 16.2.4.3. SWOT Analysis
- 16.2.4.4. Recent Developments
- 16.2.4.5. Financials (Based on Availability)
- 16.2.5 Drink Simple
- 16.2.5.1. Overview
- 16.2.5.2. Products
- 16.2.5.3. SWOT Analysis
- 16.2.5.4. Recent Developments
- 16.2.5.5. Financials (Based on Availability)
- 16.2.6 Lower Valley Beverage Co(sapsucker)*List Not Exhaustive
- 16.2.6.1. Overview
- 16.2.6.2. Products
- 16.2.6.3. SWOT Analysis
- 16.2.6.4. Recent Developments
- 16.2.6.5. Financials (Based on Availability)
- 16.2.7 Kiki Maple Water
- 16.2.7.1. Overview
- 16.2.7.2. Products
- 16.2.7.3. SWOT Analysis
- 16.2.7.4. Recent Developments
- 16.2.7.5. Financials (Based on Availability)
- 16.2.8 Feronia Forests LLC (Vertical Water)
- 16.2.8.1. Overview
- 16.2.8.2. Products
- 16.2.8.3. SWOT Analysis
- 16.2.8.4. Recent Developments
- 16.2.8.5. Financials (Based on Availability)
- 16.2.9 Pure Maple Water Company Ltd
- 16.2.9.1. Overview
- 16.2.9.2. Products
- 16.2.9.3. SWOT Analysis
- 16.2.9.4. Recent Developments
- 16.2.9.5. Financials (Based on Availability)
- 16.2.10 Asarasi
- 16.2.10.1. Overview
- 16.2.10.2. Products
- 16.2.10.3. SWOT Analysis
- 16.2.10.4. Recent Developments
- 16.2.10.5. Financials (Based on Availability)
- 16.2.1 Smith & Salmon Inc (Sap! Beverages)
List of Figures
- Figure 1: Global Maple Water Industry Revenue Breakdown (Million, %) by Region 2024 & 2032
- Figure 2: North America Maple Water Industry Revenue (Million), by Country 2024 & 2032
- Figure 3: North America Maple Water Industry Revenue Share (%), by Country 2024 & 2032
- Figure 4: Europe Maple Water Industry Revenue (Million), by Country 2024 & 2032
- Figure 5: Europe Maple Water Industry Revenue Share (%), by Country 2024 & 2032
- Figure 6: Asia Pacific Maple Water Industry Revenue (Million), by Country 2024 & 2032
- Figure 7: Asia Pacific Maple Water Industry Revenue Share (%), by Country 2024 & 2032
- Figure 8: South America Maple Water Industry Revenue (Million), by Country 2024 & 2032
- Figure 9: South America Maple Water Industry Revenue Share (%), by Country 2024 & 2032
- Figure 10: North America Maple Water Industry Revenue (Million), by Country 2024 & 2032
- Figure 11: North America Maple Water Industry Revenue Share (%), by Country 2024 & 2032
- Figure 12: MEA Maple Water Industry Revenue (Million), by Country 2024 & 2032
- Figure 13: MEA Maple Water Industry Revenue Share (%), by Country 2024 & 2032
- Figure 14: North America Maple Water Industry Revenue (Million), by Product Type 2024 & 2032
- Figure 15: North America Maple Water Industry Revenue Share (%), by Product Type 2024 & 2032
- Figure 16: North America Maple Water Industry Revenue (Million), by Packaging Type 2024 & 2032
- Figure 17: North America Maple Water Industry Revenue Share (%), by Packaging Type 2024 & 2032
- Figure 18: North America Maple Water Industry Revenue (Million), by Distribution Channel 2024 & 2032
- Figure 19: North America Maple Water Industry Revenue Share (%), by Distribution Channel 2024 & 2032
- Figure 20: North America Maple Water Industry Revenue (Million), by Country 2024 & 2032
- Figure 21: North America Maple Water Industry Revenue Share (%), by Country 2024 & 2032
- Figure 22: Europe Maple Water Industry Revenue (Million), by Product Type 2024 & 2032
- Figure 23: Europe Maple Water Industry Revenue Share (%), by Product Type 2024 & 2032
- Figure 24: Europe Maple Water Industry Revenue (Million), by Packaging Type 2024 & 2032
- Figure 25: Europe Maple Water Industry Revenue Share (%), by Packaging Type 2024 & 2032
- Figure 26: Europe Maple Water Industry Revenue (Million), by Distribution Channel 2024 & 2032
- Figure 27: Europe Maple Water Industry Revenue Share (%), by Distribution Channel 2024 & 2032
- Figure 28: Europe Maple Water Industry Revenue (Million), by Country 2024 & 2032
- Figure 29: Europe Maple Water Industry Revenue Share (%), by Country 2024 & 2032
- Figure 30: Asia Pacific Maple Water Industry Revenue (Million), by Product Type 2024 & 2032
- Figure 31: Asia Pacific Maple Water Industry Revenue Share (%), by Product Type 2024 & 2032
- Figure 32: Asia Pacific Maple Water Industry Revenue (Million), by Packaging Type 2024 & 2032
- Figure 33: Asia Pacific Maple Water Industry Revenue Share (%), by Packaging Type 2024 & 2032
- Figure 34: Asia Pacific Maple Water Industry Revenue (Million), by Distribution Channel 2024 & 2032
- Figure 35: Asia Pacific Maple Water Industry Revenue Share (%), by Distribution Channel 2024 & 2032
- Figure 36: Asia Pacific Maple Water Industry Revenue (Million), by Country 2024 & 2032
- Figure 37: Asia Pacific Maple Water Industry Revenue Share (%), by Country 2024 & 2032
- Figure 38: Rest of the World Maple Water Industry Revenue (Million), by Product Type 2024 & 2032
- Figure 39: Rest of the World Maple Water Industry Revenue Share (%), by Product Type 2024 & 2032
- Figure 40: Rest of the World Maple Water Industry Revenue (Million), by Packaging Type 2024 & 2032
- Figure 41: Rest of the World Maple Water Industry Revenue Share (%), by Packaging Type 2024 & 2032
- Figure 42: Rest of the World Maple Water Industry Revenue (Million), by Distribution Channel 2024 & 2032
- Figure 43: Rest of the World Maple Water Industry Revenue Share (%), by Distribution Channel 2024 & 2032
- Figure 44: Rest of the World Maple Water Industry Revenue (Million), by Country 2024 & 2032
- Figure 45: Rest of the World Maple Water Industry Revenue Share (%), by Country 2024 & 2032
List of Tables
- Table 1: Global Maple Water Industry Revenue Million Forecast, by Region 2019 & 2032
- Table 2: Global Maple Water Industry Revenue Million Forecast, by Product Type 2019 & 2032
- Table 3: Global Maple Water Industry Revenue Million Forecast, by Packaging Type 2019 & 2032
- Table 4: Global Maple Water Industry Revenue Million Forecast, by Distribution Channel 2019 & 2032
- Table 5: Global Maple Water Industry Revenue Million Forecast, by Region 2019 & 2032
- Table 6: Global Maple Water Industry Revenue Million Forecast, by Country 2019 & 2032
- Table 7: United States Maple Water Industry Revenue (Million) Forecast, by Application 2019 & 2032
- Table 8: Canada Maple Water Industry Revenue (Million) Forecast, by Application 2019 & 2032
- Table 9: Mexico Maple Water Industry Revenue (Million) Forecast, by Application 2019 & 2032
- Table 10: Global Maple Water Industry Revenue Million Forecast, by Country 2019 & 2032
- Table 11: Germany Maple Water Industry Revenue (Million) Forecast, by Application 2019 & 2032
- Table 12: United Kingdom Maple Water Industry Revenue (Million) Forecast, by Application 2019 & 2032
- Table 13: France Maple Water Industry Revenue (Million) Forecast, by Application 2019 & 2032
- Table 14: Spain Maple Water Industry Revenue (Million) Forecast, by Application 2019 & 2032
- Table 15: Italy Maple Water Industry Revenue (Million) Forecast, by Application 2019 & 2032
- Table 16: Spain Maple Water Industry Revenue (Million) Forecast, by Application 2019 & 2032
- Table 17: Belgium Maple Water Industry Revenue (Million) Forecast, by Application 2019 & 2032
- Table 18: Netherland Maple Water Industry Revenue (Million) Forecast, by Application 2019 & 2032
- Table 19: Nordics Maple Water Industry Revenue (Million) Forecast, by Application 2019 & 2032
- Table 20: Rest of Europe Maple Water Industry Revenue (Million) Forecast, by Application 2019 & 2032
- Table 21: Global Maple Water Industry Revenue Million Forecast, by Country 2019 & 2032
- Table 22: China Maple Water Industry Revenue (Million) Forecast, by Application 2019 & 2032
- Table 23: Japan Maple Water Industry Revenue (Million) Forecast, by Application 2019 & 2032
- Table 24: India Maple Water Industry Revenue (Million) Forecast, by Application 2019 & 2032
- Table 25: South Korea Maple Water Industry Revenue (Million) Forecast, by Application 2019 & 2032
- Table 26: Southeast Asia Maple Water Industry Revenue (Million) Forecast, by Application 2019 & 2032
- Table 27: Australia Maple Water Industry Revenue (Million) Forecast, by Application 2019 & 2032
- Table 28: Indonesia Maple Water Industry Revenue (Million) Forecast, by Application 2019 & 2032
- Table 29: Phillipes Maple Water Industry Revenue (Million) Forecast, by Application 2019 & 2032
- Table 30: Singapore Maple Water Industry Revenue (Million) Forecast, by Application 2019 & 2032
- Table 31: Thailandc Maple Water Industry Revenue (Million) Forecast, by Application 2019 & 2032
- Table 32: Rest of Asia Pacific Maple Water Industry Revenue (Million) Forecast, by Application 2019 & 2032
- Table 33: Global Maple Water Industry Revenue Million Forecast, by Country 2019 & 2032
- Table 34: Brazil Maple Water Industry Revenue (Million) Forecast, by Application 2019 & 2032
- Table 35: Argentina Maple Water Industry Revenue (Million) Forecast, by Application 2019 & 2032
- Table 36: Peru Maple Water Industry Revenue (Million) Forecast, by Application 2019 & 2032
- Table 37: Chile Maple Water Industry Revenue (Million) Forecast, by Application 2019 & 2032
- Table 38: Colombia Maple Water Industry Revenue (Million) Forecast, by Application 2019 & 2032
- Table 39: Ecuador Maple Water Industry Revenue (Million) Forecast, by Application 2019 & 2032
- Table 40: Venezuela Maple Water Industry Revenue (Million) Forecast, by Application 2019 & 2032
- Table 41: Rest of South America Maple Water Industry Revenue (Million) Forecast, by Application 2019 & 2032
- Table 42: Global Maple Water Industry Revenue Million Forecast, by Country 2019 & 2032
- Table 43: United States Maple Water Industry Revenue (Million) Forecast, by Application 2019 & 2032
- Table 44: Canada Maple Water Industry Revenue (Million) Forecast, by Application 2019 & 2032
- Table 45: Mexico Maple Water Industry Revenue (Million) Forecast, by Application 2019 & 2032
- Table 46: Global Maple Water Industry Revenue Million Forecast, by Country 2019 & 2032
- Table 47: United Arab Emirates Maple Water Industry Revenue (Million) Forecast, by Application 2019 & 2032
- Table 48: Saudi Arabia Maple Water Industry Revenue (Million) Forecast, by Application 2019 & 2032
- Table 49: South Africa Maple Water Industry Revenue (Million) Forecast, by Application 2019 & 2032
- Table 50: Rest of Middle East and Africa Maple Water Industry Revenue (Million) Forecast, by Application 2019 & 2032
- Table 51: Global Maple Water Industry Revenue Million Forecast, by Product Type 2019 & 2032
- Table 52: Global Maple Water Industry Revenue Million Forecast, by Packaging Type 2019 & 2032
- Table 53: Global Maple Water Industry Revenue Million Forecast, by Distribution Channel 2019 & 2032
- Table 54: Global Maple Water Industry Revenue Million Forecast, by Country 2019 & 2032
- Table 55: United States Maple Water Industry Revenue (Million) Forecast, by Application 2019 & 2032
- Table 56: Canada Maple Water Industry Revenue (Million) Forecast, by Application 2019 & 2032
- Table 57: Mexico Maple Water Industry Revenue (Million) Forecast, by Application 2019 & 2032
- Table 58: Rest of North America Maple Water Industry Revenue (Million) Forecast, by Application 2019 & 2032
- Table 59: Global Maple Water Industry Revenue Million Forecast, by Product Type 2019 & 2032
- Table 60: Global Maple Water Industry Revenue Million Forecast, by Packaging Type 2019 & 2032
- Table 61: Global Maple Water Industry Revenue Million Forecast, by Distribution Channel 2019 & 2032
- Table 62: Global Maple Water Industry Revenue Million Forecast, by Country 2019 & 2032
- Table 63: Germany Maple Water Industry Revenue (Million) Forecast, by Application 2019 & 2032
- Table 64: United Kingdom Maple Water Industry Revenue (Million) Forecast, by Application 2019 & 2032
- Table 65: France Maple Water Industry Revenue (Million) Forecast, by Application 2019 & 2032
- Table 66: Italy Maple Water Industry Revenue (Million) Forecast, by Application 2019 & 2032
- Table 67: Spain Maple Water Industry Revenue (Million) Forecast, by Application 2019 & 2032
- Table 68: Rest of Europe Maple Water Industry Revenue (Million) Forecast, by Application 2019 & 2032
- Table 69: Global Maple Water Industry Revenue Million Forecast, by Product Type 2019 & 2032
- Table 70: Global Maple Water Industry Revenue Million Forecast, by Packaging Type 2019 & 2032
- Table 71: Global Maple Water Industry Revenue Million Forecast, by Distribution Channel 2019 & 2032
- Table 72: Global Maple Water Industry Revenue Million Forecast, by Country 2019 & 2032
- Table 73: China Maple Water Industry Revenue (Million) Forecast, by Application 2019 & 2032
- Table 74: India Maple Water Industry Revenue (Million) Forecast, by Application 2019 & 2032
- Table 75: Australia Maple Water Industry Revenue (Million) Forecast, by Application 2019 & 2032
- Table 76: Japan Maple Water Industry Revenue (Million) Forecast, by Application 2019 & 2032
- Table 77: Global Maple Water Industry Revenue Million Forecast, by Product Type 2019 & 2032
- Table 78: Global Maple Water Industry Revenue Million Forecast, by Packaging Type 2019 & 2032
- Table 79: Global Maple Water Industry Revenue Million Forecast, by Distribution Channel 2019 & 2032
- Table 80: Global Maple Water Industry Revenue Million Forecast, by Country 2019 & 2032
- Table 81: South America Maple Water Industry Revenue (Million) Forecast, by Application 2019 & 2032
- Table 82: Middle East and Africa Maple Water Industry Revenue (Million) Forecast, by Application 2019 & 2032
Frequently Asked Questions
1. What is the projected Compound Annual Growth Rate (CAGR) of the Maple Water Industry?
The projected CAGR is approximately 30.75%.
2. Which companies are prominent players in the Maple Water Industry?
Key companies in the market include Smith & Salmon Inc (Sap! Beverages), Loblaws Companies Limited (President's Choice), MapleMama Beverages LLC, Maple, Drink Simple, Lower Valley Beverage Co(sapsucker)*List Not Exhaustive, Kiki Maple Water, Feronia Forests LLC (Vertical Water), Pure Maple Water Company Ltd, Asarasi.
3. What are the main segments of the Maple Water Industry?
The market segments include Product Type, Packaging Type, Distribution Channel.
4. Can you provide details about the market size?
The market size is estimated to be USD 0.46 Million as of 2022.
5. What are some drivers contributing to market growth?
Popularization of Adventure Sports and Expedition; Suitability of the Freeze-Dried Technique for Heat Sensitive Food Products.
6. What are the notable trends driving market growth?
Value-added Hydration is Evolving Consumer Preferences in the Maple Water Market.
7. Are there any restraints impacting market growth?
High Cost Associated with the Freeze-Drying Technology.
8. Can you provide examples of recent developments in the market?
N/A
9. What pricing options are available for accessing the report?
Pricing options include single-user, multi-user, and enterprise licenses priced at USD 4750, USD 5250, and USD 8750 respectively.
10. Is the market size provided in terms of value or volume?
The market size is provided in terms of value, measured in Million.
11. Are there any specific market keywords associated with the report?
Yes, the market keyword associated with the report is "Maple Water Industry," which aids in identifying and referencing the specific market segment covered.
12. How do I determine which pricing option suits my needs best?
The pricing options vary based on user requirements and access needs. Individual users may opt for single-user licenses, while businesses requiring broader access may choose multi-user or enterprise licenses for cost-effective access to the report.
13. Are there any additional resources or data provided in the Maple Water Industry report?
While the report offers comprehensive insights, it's advisable to review the specific contents or supplementary materials provided to ascertain if additional resources or data are available.
14. How can I stay updated on further developments or reports in the Maple Water Industry?
To stay informed about further developments, trends, and reports in the Maple Water Industry, consider subscribing to industry newsletters, following relevant companies and organizations, or regularly checking reputable industry news sources and publications.
Methodology
Step 1 - Identification of Relevant Samples Size from Population Database


Step 2 - Approaches for Defining Global Market Size (Value, Volume* & Price*)

Note*: In applicable scenarios
Step 3 - Data Sources
Primary Research
- Web Analytics
- Survey Reports
- Research Institute
- Latest Research Reports
- Opinion Leaders
Secondary Research
- Annual Reports
- White Paper
- Latest Press Release
- Industry Association
- Paid Database
- Investor Presentations

Step 4 - Data Triangulation
Involves using different sources of information in order to increase the validity of a study
These sources are likely to be stakeholders in a program - participants, other researchers, program staff, other community members, and so on.
Then we put all data in single framework & apply various statistical tools to find out the dynamic on the market.
During the analysis stage, feedback from the stakeholder groups would be compared to determine areas of agreement as well as areas of divergence
