

Key Insights
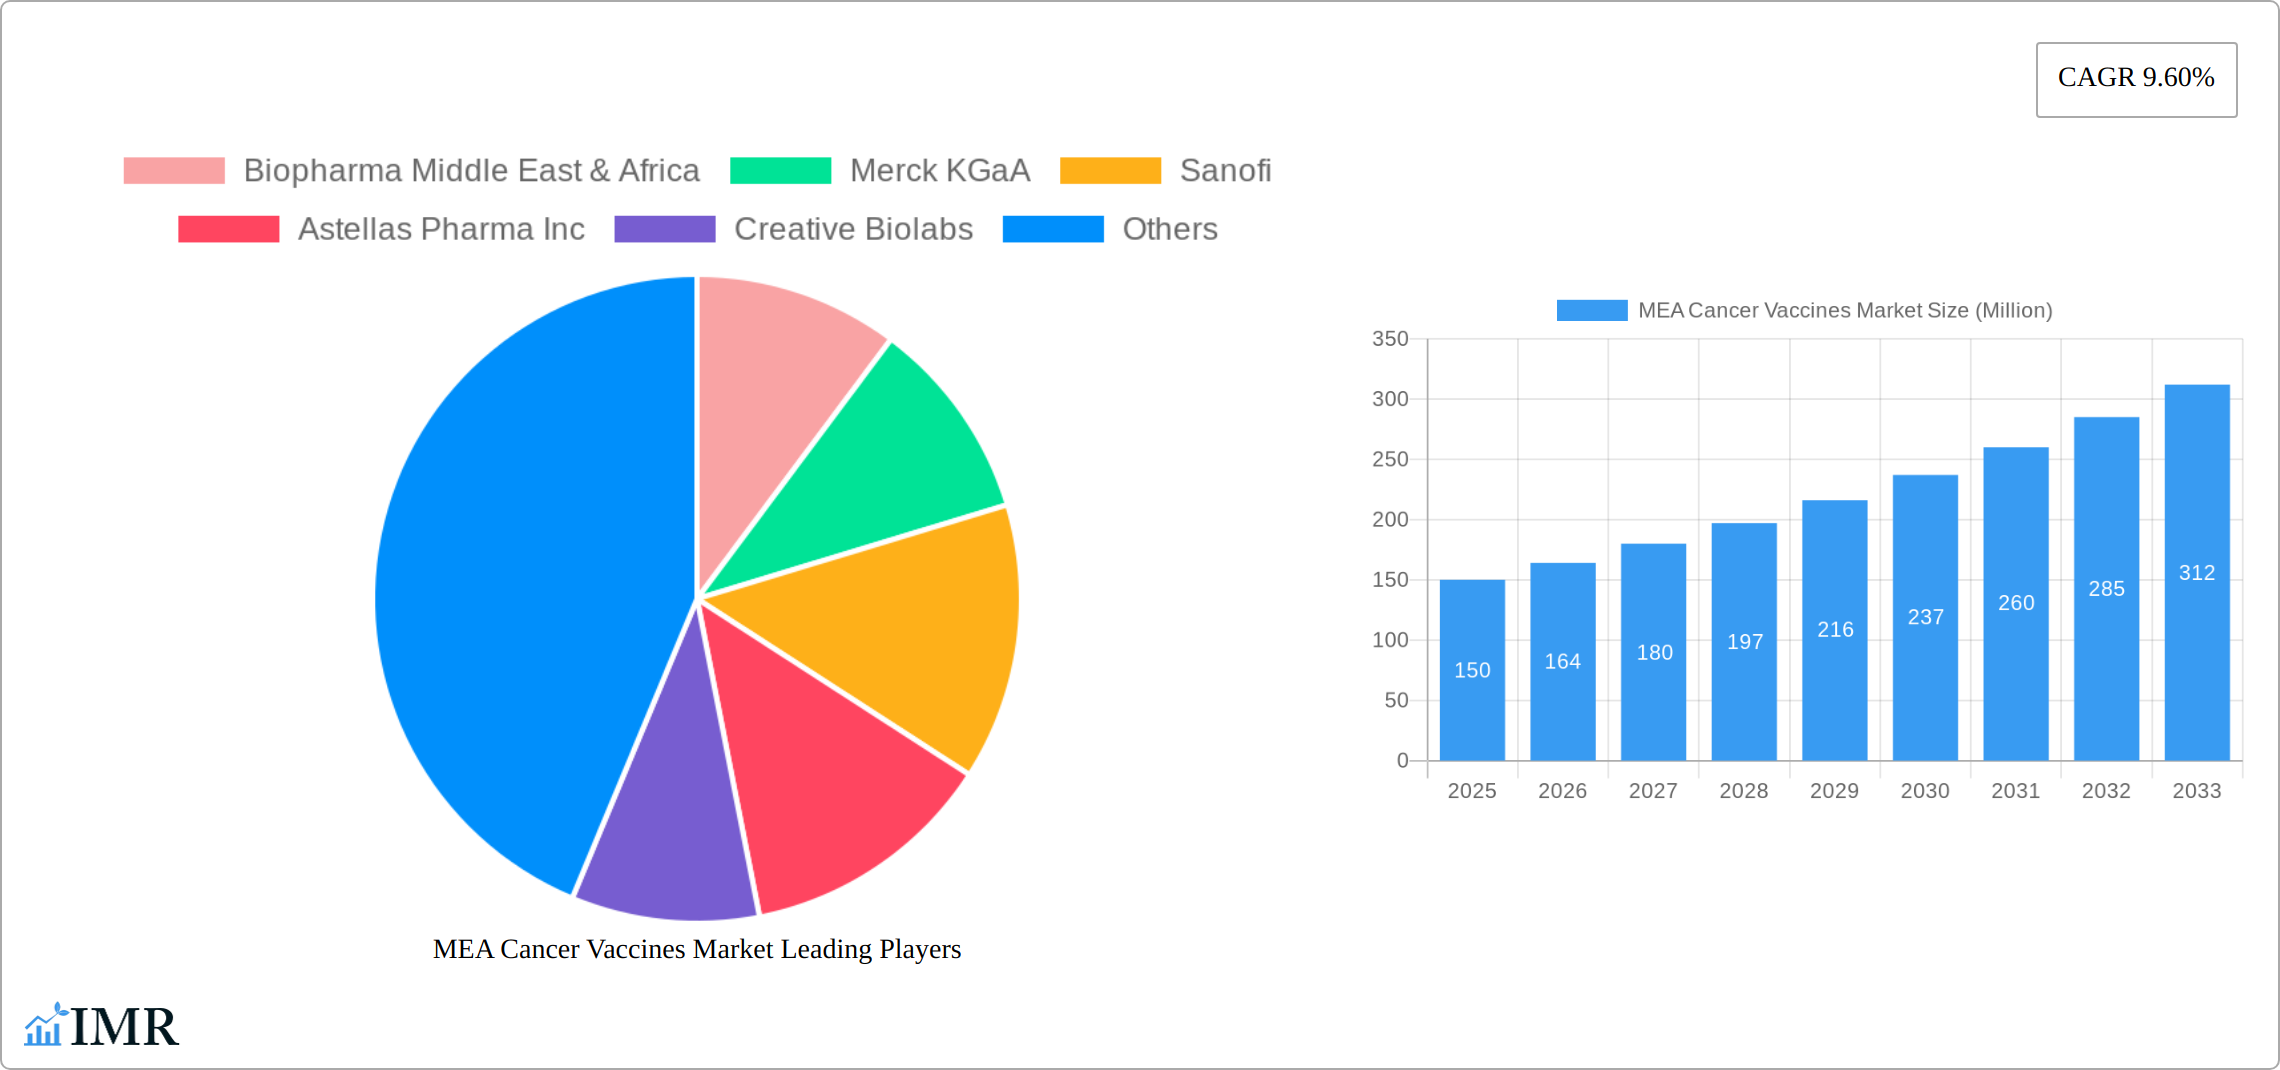
The Middle East & Africa (MEA) cancer vaccines market is experiencing robust growth, projected to expand significantly from 2025 to 2033. A Compound Annual Growth Rate (CAGR) of 9.60% indicates a considerable increase in market value driven by several key factors. Rising cancer incidence rates across the MEA region, coupled with increasing awareness of preventative measures and advancements in cancer vaccine technology, are fueling market expansion. The demand for both therapeutic and preventive vaccines is on the rise, with prostate and cervical cancer vaccines representing major application segments. Technological advancements, such as recombinant and viral vector vaccines, are contributing to improved efficacy and safety profiles, further boosting market growth. However, high treatment costs, limited healthcare infrastructure in certain areas, and regulatory hurdles may pose challenges to market penetration. The entry of major pharmaceutical players such as Merck KGaA, Sanofi, and AstraZeneca PLC underscores the market's potential and attractiveness. Furthermore, the growing adoption of innovative treatment methods and rising disposable incomes in certain MEA countries are anticipated to support the expansion of this market.
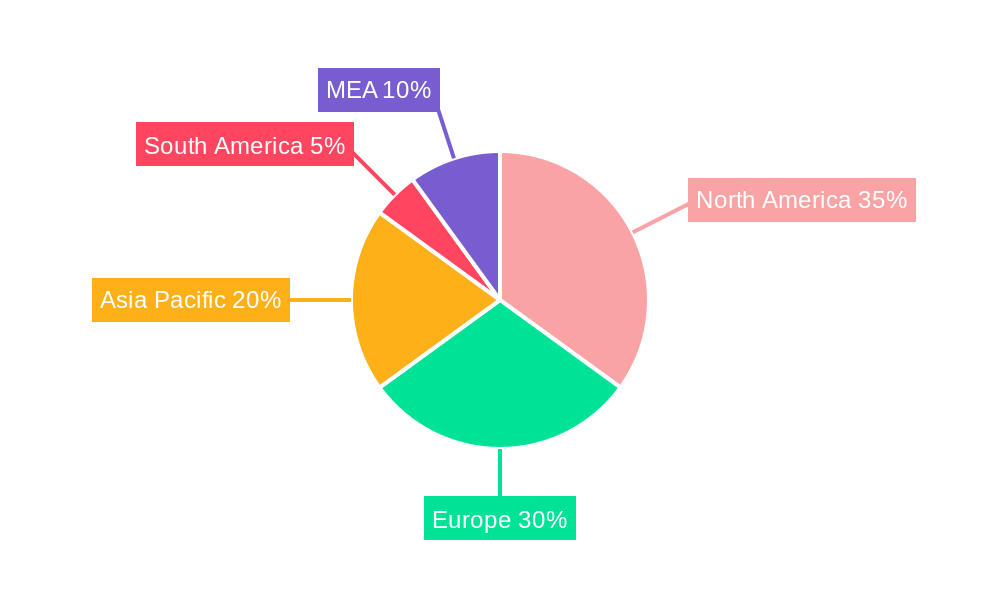
The market segmentation reveals promising opportunities. Recombinant cancer vaccines are gaining traction due to their precision and reduced side effects. The therapeutic vaccine segment is experiencing substantial growth, driven by the increasing need for effective treatment options. Within applications, prostate and cervical cancer vaccines hold significant market share, reflecting the prevalence of these cancers in the region. While North America and Europe currently hold larger market shares globally, the MEA region is exhibiting strong growth potential owing to its increasing population, rising healthcare expenditure, and targeted investments in oncology research and infrastructure development. This growth is likely to be propelled by the ongoing efforts to enhance healthcare access and affordability in several MEA nations, leading to greater utilization of cancer vaccines.
MEA Cancer Vaccines Market: A Comprehensive Market Report (2019-2033)
This comprehensive report provides a detailed analysis of the Middle East and Africa (MEA) cancer vaccines market, offering invaluable insights for industry professionals, investors, and strategic decision-makers. The report covers the period from 2019 to 2033, with a focus on the forecast period from 2025 to 2033, using 2025 as the base year. The market is segmented by technology (Recombinant Cancer Vaccines, Whole-cell Cancer Vaccines, Viral Vector and DNA Cancer Vaccines, Other Technologies), treatment method (Preventive Vaccine, Therapeutic Vaccine), and application (Prostate Cancer, Cervical Cancer, Other Applications). Key players analyzed include Biopharma Middle East & Africa, Merck KGaA, Sanofi, Astellas Pharma Inc, Creative Biolabs, AstraZeneca PLC, Pfizer, GSK, Bristol-Myers Squibb, and Dendreon. The report's value is presented in million units.
MEA Cancer Vaccines Market Dynamics & Structure
The MEA cancer vaccines market is characterized by moderate concentration, with a few major players dominating the landscape. Technological innovation, particularly in mRNA vaccines and personalized therapies, is a key driver, while regulatory approvals and reimbursement policies significantly influence market access. Competitive substitutes, such as traditional chemotherapies and immunotherapies, pose a challenge. The end-user demographic is primarily driven by the increasing prevalence of cancer, particularly in specific regions and age groups within the MEA region. M&A activity is expected to remain moderately active, driven by companies seeking to expand their product portfolios and geographical reach.
- Market Concentration: Moderately concentrated, with the top 5 players holding approximately xx% market share in 2025 (estimated).
- Technological Innovation: mRNA vaccine technology and personalized cancer vaccines are significant innovation drivers. Barriers include high R&D costs and complex regulatory pathways.
- Regulatory Frameworks: Vary across MEA countries, impacting market entry and product approval timelines. Harmonization efforts are underway but remain at an early stage.
- Competitive Substitutes: Traditional cancer treatments (chemotherapy, radiotherapy) remain significant competitors.
- End-User Demographics: Growing prevalence of cancer, particularly prostate and cervical cancer, fuels market demand. Ageing populations contribute significantly to growth.
- M&A Trends: xx M&A deals were observed between 2019 and 2024, with an anticipated increase in activity during the forecast period.
MEA Cancer Vaccines Market Growth Trends & Insights
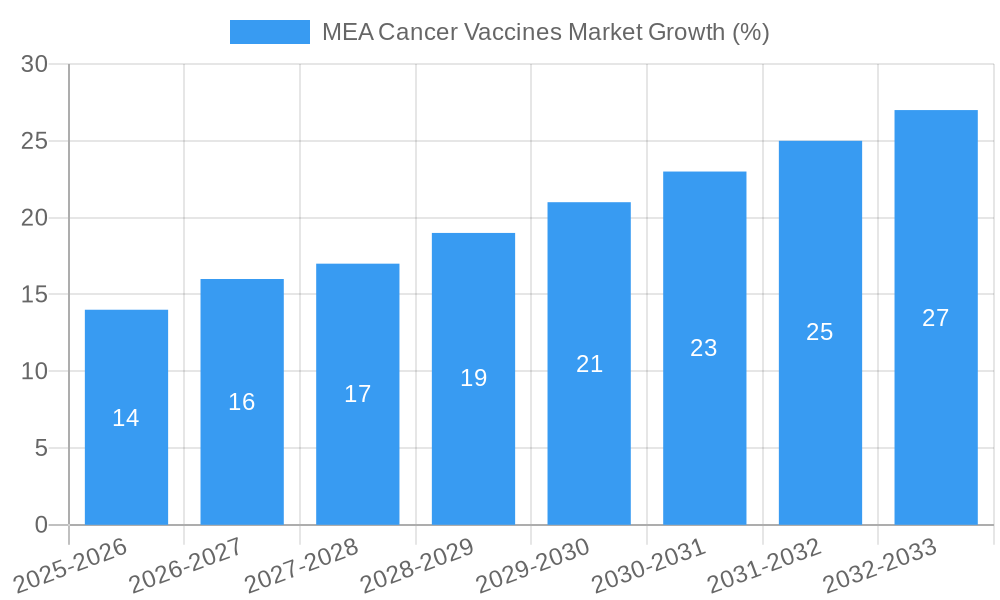
The MEA cancer vaccines market is projected to experience significant growth during the forecast period (2025-2033). Driven by increasing cancer incidence, rising healthcare expenditure, and growing awareness of cancer prevention and treatment, the market is expected to witness a CAGR of xx% during this period. Market penetration of cancer vaccines remains relatively low, providing substantial room for expansion. Technological advancements, particularly in personalized medicine, are accelerating adoption rates. Consumer behavior is shifting towards greater demand for targeted and effective therapies, including cancer vaccines.
Dominant Regions, Countries, or Segments in MEA Cancer Vaccines Market
While data on specific country-level dominance is not readily available, South Africa and other nations with higher healthcare spending and cancer prevalence are expected to lead the MEA region. The Therapeutic Vaccine segment is projected to hold a larger market share due to the greater demand for treatments for existing cancers. Within technology segments, Recombinant Cancer Vaccines and Viral Vector and DNA Cancer Vaccines are anticipated to show strong growth due to advancements in technology and ongoing clinical trials. Prostate Cancer and Cervical Cancer are currently the leading application segments given the high incidence rates in the region.
- Key Drivers: Increasing healthcare expenditure, rising cancer incidence, and government initiatives aimed at improving healthcare infrastructure. Improved access to diagnostic tools enhances early detection and treatment, increasing demand.
- Dominance Factors: Higher cancer prevalence rates, advanced healthcare infrastructure, and government support for cancer research are crucial factors in regional market dominance.
MEA Cancer Vaccines Market Product Landscape
The MEA cancer vaccines market features a diverse range of products, including recombinant, whole-cell, viral vector, and DNA vaccines. Recent innovations focus on personalized vaccines tailored to individual cancer mutations, improving efficacy and minimizing side effects. These advancements enhance the unique selling proposition (USP) of cancer vaccines compared to traditional treatments by offering targeted therapies. Ongoing research in this field promises even more sophisticated vaccines with improved safety and efficacy profiles.
Key Drivers, Barriers & Challenges in MEA Cancer Vaccines Market
Key Drivers: Increasing cancer incidence rates, government initiatives supporting cancer research and treatment, rising healthcare expenditure, and technological advancements in vaccine development are driving market growth. The Cancer Moonshot initiative in 2022 further emphasized this commitment to cancer treatment and prevention within Africa.
Challenges: High research and development costs, complex regulatory hurdles for approvals, limited healthcare infrastructure in certain regions, and the availability of affordable alternative treatments pose significant challenges. Supply chain issues can also impact the accessibility of these vaccines, especially in remote areas.
Emerging Opportunities in MEA Cancer Vaccines Market
Emerging opportunities include the expansion of cancer vaccine usage in underserved areas, the development of cost-effective vaccines, and the growing adoption of personalized medicine approaches. Focus on preventive vaccines offers a substantial opportunity to reduce future cancer incidence. Furthermore, exploring partnerships with regional healthcare providers can significantly increase market penetration.
Growth Accelerators in the MEA Cancer Vaccines Market Industry
Strategic collaborations between pharmaceutical companies and research institutions are crucial catalysts for accelerating growth. Technological breakthroughs, such as mRNA technology and improved vaccine delivery methods, are key drivers. Expansion of market access through government initiatives and affordable pricing strategies can significantly enhance market potential.
Key Players Shaping the MEA Cancer Vaccines Market Market
- Biopharma Middle East & Africa
- Merck KGaA (Merck KGaA)
- Sanofi (Sanofi)
- Astellas Pharma Inc (Astellas Pharma Inc)
- Creative Biolabs
- AstraZeneca PLC (AstraZeneca PLC)
- Pfizer (Pfizer)
- GSK (GSK)
- Bristol-Myers Squibb (Bristol-Myers Squibb)
- Dendreon
Notable Milestones in MEA Cancer Vaccines Market Sector
- December 2022: The Cancer Moonshot initiative announced over USD 300 million in funding to improve cancer outcomes in Africa. This signifies a significant boost for cancer research and vaccine development in the region.
- April 2022: Dante Labs partnered with the Abu Dhabi Stem Cells Center to develop mRNA cancer vaccines, showcasing the growing interest in personalized oncology treatments.
In-Depth MEA Cancer Vaccines Market Market Outlook
The MEA cancer vaccines market holds substantial future potential, driven by continuous technological advancements, increased investments in research and development, and growing awareness of cancer prevention and treatment. Strategic partnerships and collaborations, coupled with improved market access and affordability, will be key factors in driving long-term growth. The focus on personalized and preventive vaccines will further shape the market landscape in the coming years.
MEA Cancer Vaccines Market Segmentation
-
1. Technology
- 1.1. Recombinant Cancer Vaccines
- 1.2. Whole-cell Cancer Vaccines
- 1.3. Viral Vector and DNA Cancer Vaccines
- 1.4. Other Technologies
-
2. Treatment Method
- 2.1. Preventive Vaccine
- 2.2. Therapeutic Vaccine
-
3. Application
- 3.1. Prostate Cancer
- 3.2. Cervical Cancer
- 3.3. Other Applications
-
4. Geography
- 4.1. GCC
- 4.2. South Africa
- 4.3. Rest of Middle East and Africa
MEA Cancer Vaccines Market Segmentation By Geography
- 1. GCC
- 2. South Africa
- 3. Rest of Middle East and Africa
MEA Cancer Vaccines Market REPORT HIGHLIGHTS
| Aspects | Details |
|---|---|
| Study Period | 2019-2033 |
| Base Year | 2024 |
| Estimated Year | 2025 |
| Forecast Period | 2025-2033 |
| Historical Period | 2019-2024 |
| Growth Rate | CAGR of 9.60% from 2019-2033 |
| Segmentation |
|
Table of Contents
- 1. Introduction
- 1.1. Research Scope
- 1.2. Market Segmentation
- 1.3. Research Methodology
- 1.4. Definitions and Assumptions
- 2. Executive Summary
- 2.1. Introduction
- 3. Market Dynamics
- 3.1. Introduction
- 3.2. Market Drivers
- 3.2.1. Increasing Number of Cancer Cases; Rise in Research and Developments in Cancer Vaccines
- 3.3. Market Restrains
- 3.3.1. Presence of Alternative Therapies
- 3.4. Market Trends
- 3.4.1. Cervical Cancer Segment is Expected to Witness a Significant Growth in the Market Over the Forecast Period
- 4. Market Factor Analysis
- 4.1. Porters Five Forces
- 4.2. Supply/Value Chain
- 4.3. PESTEL analysis
- 4.4. Market Entropy
- 4.5. Patent/Trademark Analysis
- 5. Global MEA Cancer Vaccines Market Analysis, Insights and Forecast, 2019-2031
- 5.1. Market Analysis, Insights and Forecast - by Technology
- 5.1.1. Recombinant Cancer Vaccines
- 5.1.2. Whole-cell Cancer Vaccines
- 5.1.3. Viral Vector and DNA Cancer Vaccines
- 5.1.4. Other Technologies
- 5.2. Market Analysis, Insights and Forecast - by Treatment Method
- 5.2.1. Preventive Vaccine
- 5.2.2. Therapeutic Vaccine
- 5.3. Market Analysis, Insights and Forecast - by Application
- 5.3.1. Prostate Cancer
- 5.3.2. Cervical Cancer
- 5.3.3. Other Applications
- 5.4. Market Analysis, Insights and Forecast - by Geography
- 5.4.1. GCC
- 5.4.2. South Africa
- 5.4.3. Rest of Middle East and Africa
- 5.5. Market Analysis, Insights and Forecast - by Region
- 5.5.1. GCC
- 5.5.2. South Africa
- 5.5.3. Rest of Middle East and Africa
- 5.1. Market Analysis, Insights and Forecast - by Technology
- 6. GCC MEA Cancer Vaccines Market Analysis, Insights and Forecast, 2019-2031
- 6.1. Market Analysis, Insights and Forecast - by Technology
- 6.1.1. Recombinant Cancer Vaccines
- 6.1.2. Whole-cell Cancer Vaccines
- 6.1.3. Viral Vector and DNA Cancer Vaccines
- 6.1.4. Other Technologies
- 6.2. Market Analysis, Insights and Forecast - by Treatment Method
- 6.2.1. Preventive Vaccine
- 6.2.2. Therapeutic Vaccine
- 6.3. Market Analysis, Insights and Forecast - by Application
- 6.3.1. Prostate Cancer
- 6.3.2. Cervical Cancer
- 6.3.3. Other Applications
- 6.4. Market Analysis, Insights and Forecast - by Geography
- 6.4.1. GCC
- 6.4.2. South Africa
- 6.4.3. Rest of Middle East and Africa
- 6.1. Market Analysis, Insights and Forecast - by Technology
- 7. South Africa MEA Cancer Vaccines Market Analysis, Insights and Forecast, 2019-2031
- 7.1. Market Analysis, Insights and Forecast - by Technology
- 7.1.1. Recombinant Cancer Vaccines
- 7.1.2. Whole-cell Cancer Vaccines
- 7.1.3. Viral Vector and DNA Cancer Vaccines
- 7.1.4. Other Technologies
- 7.2. Market Analysis, Insights and Forecast - by Treatment Method
- 7.2.1. Preventive Vaccine
- 7.2.2. Therapeutic Vaccine
- 7.3. Market Analysis, Insights and Forecast - by Application
- 7.3.1. Prostate Cancer
- 7.3.2. Cervical Cancer
- 7.3.3. Other Applications
- 7.4. Market Analysis, Insights and Forecast - by Geography
- 7.4.1. GCC
- 7.4.2. South Africa
- 7.4.3. Rest of Middle East and Africa
- 7.1. Market Analysis, Insights and Forecast - by Technology
- 8. Rest of Middle East and Africa MEA Cancer Vaccines Market Analysis, Insights and Forecast, 2019-2031
- 8.1. Market Analysis, Insights and Forecast - by Technology
- 8.1.1. Recombinant Cancer Vaccines
- 8.1.2. Whole-cell Cancer Vaccines
- 8.1.3. Viral Vector and DNA Cancer Vaccines
- 8.1.4. Other Technologies
- 8.2. Market Analysis, Insights and Forecast - by Treatment Method
- 8.2.1. Preventive Vaccine
- 8.2.2. Therapeutic Vaccine
- 8.3. Market Analysis, Insights and Forecast - by Application
- 8.3.1. Prostate Cancer
- 8.3.2. Cervical Cancer
- 8.3.3. Other Applications
- 8.4. Market Analysis, Insights and Forecast - by Geography
- 8.4.1. GCC
- 8.4.2. South Africa
- 8.4.3. Rest of Middle East and Africa
- 8.1. Market Analysis, Insights and Forecast - by Technology
- 9. North America MEA Cancer Vaccines Market Analysis, Insights and Forecast, 2019-2031
- 9.1. Market Analysis, Insights and Forecast - By Country/Sub-region
- 9.1.1. undefined
- 10. Europe MEA Cancer Vaccines Market Analysis, Insights and Forecast, 2019-2031
- 10.1. Market Analysis, Insights and Forecast - By Country/Sub-region
- 10.1.1. undefined
- 11. Asia Pacific MEA Cancer Vaccines Market Analysis, Insights and Forecast, 2019-2031
- 11.1. Market Analysis, Insights and Forecast - By Country/Sub-region
- 11.1.1. undefined
- 12. South America MEA Cancer Vaccines Market Analysis, Insights and Forecast, 2019-2031
- 12.1. Market Analysis, Insights and Forecast - By Country/Sub-region
- 12.1.1. undefined
- 13. North America MEA Cancer Vaccines Market Analysis, Insights and Forecast, 2019-2031
- 13.1. Market Analysis, Insights and Forecast - By Country/Sub-region
- 13.1.1. undefined
- 14. MEA MEA Cancer Vaccines Market Analysis, Insights and Forecast, 2019-2031
- 14.1. Market Analysis, Insights and Forecast - By Country/Sub-region
- 14.1.1. undefined
- 15. Competitive Analysis
- 15.1. Global Market Share Analysis 2024
- 15.2. Company Profiles
- 15.2.1 Biopharma Middle East & Africa
- 15.2.1.1. Overview
- 15.2.1.2. Products
- 15.2.1.3. SWOT Analysis
- 15.2.1.4. Recent Developments
- 15.2.1.5. Financials (Based on Availability)
- 15.2.2 Merck KGaA
- 15.2.2.1. Overview
- 15.2.2.2. Products
- 15.2.2.3. SWOT Analysis
- 15.2.2.4. Recent Developments
- 15.2.2.5. Financials (Based on Availability)
- 15.2.3 Sanofi
- 15.2.3.1. Overview
- 15.2.3.2. Products
- 15.2.3.3. SWOT Analysis
- 15.2.3.4. Recent Developments
- 15.2.3.5. Financials (Based on Availability)
- 15.2.4 Astellas Pharma Inc
- 15.2.4.1. Overview
- 15.2.4.2. Products
- 15.2.4.3. SWOT Analysis
- 15.2.4.4. Recent Developments
- 15.2.4.5. Financials (Based on Availability)
- 15.2.5 Creative Biolabs
- 15.2.5.1. Overview
- 15.2.5.2. Products
- 15.2.5.3. SWOT Analysis
- 15.2.5.4. Recent Developments
- 15.2.5.5. Financials (Based on Availability)
- 15.2.6 AstraZeneca PLC
- 15.2.6.1. Overview
- 15.2.6.2. Products
- 15.2.6.3. SWOT Analysis
- 15.2.6.4. Recent Developments
- 15.2.6.5. Financials (Based on Availability)
- 15.2.7 Pfizer
- 15.2.7.1. Overview
- 15.2.7.2. Products
- 15.2.7.3. SWOT Analysis
- 15.2.7.4. Recent Developments
- 15.2.7.5. Financials (Based on Availability)
- 15.2.8 GSK
- 15.2.8.1. Overview
- 15.2.8.2. Products
- 15.2.8.3. SWOT Analysis
- 15.2.8.4. Recent Developments
- 15.2.8.5. Financials (Based on Availability)
- 15.2.9 Bristol-Myers Squibb
- 15.2.9.1. Overview
- 15.2.9.2. Products
- 15.2.9.3. SWOT Analysis
- 15.2.9.4. Recent Developments
- 15.2.9.5. Financials (Based on Availability)
- 15.2.10 Dendreon
- 15.2.10.1. Overview
- 15.2.10.2. Products
- 15.2.10.3. SWOT Analysis
- 15.2.10.4. Recent Developments
- 15.2.10.5. Financials (Based on Availability)
- 15.2.1 Biopharma Middle East & Africa
List of Figures
- Figure 1: Global MEA Cancer Vaccines Market Revenue Breakdown (Million, %) by Region 2024 & 2032
- Figure 2: Global MEA Cancer Vaccines Market Volume Breakdown (K Unit, %) by Region 2024 & 2032
- Figure 3: North America MEA Cancer Vaccines Market Revenue (Million), by Country 2024 & 2032
- Figure 4: North America MEA Cancer Vaccines Market Volume (K Unit), by Country 2024 & 2032
- Figure 5: North America MEA Cancer Vaccines Market Revenue Share (%), by Country 2024 & 2032
- Figure 6: North America MEA Cancer Vaccines Market Volume Share (%), by Country 2024 & 2032
- Figure 7: Europe MEA Cancer Vaccines Market Revenue (Million), by Country 2024 & 2032
- Figure 8: Europe MEA Cancer Vaccines Market Volume (K Unit), by Country 2024 & 2032
- Figure 9: Europe MEA Cancer Vaccines Market Revenue Share (%), by Country 2024 & 2032
- Figure 10: Europe MEA Cancer Vaccines Market Volume Share (%), by Country 2024 & 2032
- Figure 11: Asia Pacific MEA Cancer Vaccines Market Revenue (Million), by Country 2024 & 2032
- Figure 12: Asia Pacific MEA Cancer Vaccines Market Volume (K Unit), by Country 2024 & 2032
- Figure 13: Asia Pacific MEA Cancer Vaccines Market Revenue Share (%), by Country 2024 & 2032
- Figure 14: Asia Pacific MEA Cancer Vaccines Market Volume Share (%), by Country 2024 & 2032
- Figure 15: South America MEA Cancer Vaccines Market Revenue (Million), by Country 2024 & 2032
- Figure 16: South America MEA Cancer Vaccines Market Volume (K Unit), by Country 2024 & 2032
- Figure 17: South America MEA Cancer Vaccines Market Revenue Share (%), by Country 2024 & 2032
- Figure 18: South America MEA Cancer Vaccines Market Volume Share (%), by Country 2024 & 2032
- Figure 19: North America MEA Cancer Vaccines Market Revenue (Million), by Country 2024 & 2032
- Figure 20: North America MEA Cancer Vaccines Market Volume (K Unit), by Country 2024 & 2032
- Figure 21: North America MEA Cancer Vaccines Market Revenue Share (%), by Country 2024 & 2032
- Figure 22: North America MEA Cancer Vaccines Market Volume Share (%), by Country 2024 & 2032
- Figure 23: MEA MEA Cancer Vaccines Market Revenue (Million), by Country 2024 & 2032
- Figure 24: MEA MEA Cancer Vaccines Market Volume (K Unit), by Country 2024 & 2032
- Figure 25: MEA MEA Cancer Vaccines Market Revenue Share (%), by Country 2024 & 2032
- Figure 26: MEA MEA Cancer Vaccines Market Volume Share (%), by Country 2024 & 2032
- Figure 27: GCC MEA Cancer Vaccines Market Revenue (Million), by Technology 2024 & 2032
- Figure 28: GCC MEA Cancer Vaccines Market Volume (K Unit), by Technology 2024 & 2032
- Figure 29: GCC MEA Cancer Vaccines Market Revenue Share (%), by Technology 2024 & 2032
- Figure 30: GCC MEA Cancer Vaccines Market Volume Share (%), by Technology 2024 & 2032
- Figure 31: GCC MEA Cancer Vaccines Market Revenue (Million), by Treatment Method 2024 & 2032
- Figure 32: GCC MEA Cancer Vaccines Market Volume (K Unit), by Treatment Method 2024 & 2032
- Figure 33: GCC MEA Cancer Vaccines Market Revenue Share (%), by Treatment Method 2024 & 2032
- Figure 34: GCC MEA Cancer Vaccines Market Volume Share (%), by Treatment Method 2024 & 2032
- Figure 35: GCC MEA Cancer Vaccines Market Revenue (Million), by Application 2024 & 2032
- Figure 36: GCC MEA Cancer Vaccines Market Volume (K Unit), by Application 2024 & 2032
- Figure 37: GCC MEA Cancer Vaccines Market Revenue Share (%), by Application 2024 & 2032
- Figure 38: GCC MEA Cancer Vaccines Market Volume Share (%), by Application 2024 & 2032
- Figure 39: GCC MEA Cancer Vaccines Market Revenue (Million), by Geography 2024 & 2032
- Figure 40: GCC MEA Cancer Vaccines Market Volume (K Unit), by Geography 2024 & 2032
- Figure 41: GCC MEA Cancer Vaccines Market Revenue Share (%), by Geography 2024 & 2032
- Figure 42: GCC MEA Cancer Vaccines Market Volume Share (%), by Geography 2024 & 2032
- Figure 43: GCC MEA Cancer Vaccines Market Revenue (Million), by Country 2024 & 2032
- Figure 44: GCC MEA Cancer Vaccines Market Volume (K Unit), by Country 2024 & 2032
- Figure 45: GCC MEA Cancer Vaccines Market Revenue Share (%), by Country 2024 & 2032
- Figure 46: GCC MEA Cancer Vaccines Market Volume Share (%), by Country 2024 & 2032
- Figure 47: South Africa MEA Cancer Vaccines Market Revenue (Million), by Technology 2024 & 2032
- Figure 48: South Africa MEA Cancer Vaccines Market Volume (K Unit), by Technology 2024 & 2032
- Figure 49: South Africa MEA Cancer Vaccines Market Revenue Share (%), by Technology 2024 & 2032
- Figure 50: South Africa MEA Cancer Vaccines Market Volume Share (%), by Technology 2024 & 2032
- Figure 51: South Africa MEA Cancer Vaccines Market Revenue (Million), by Treatment Method 2024 & 2032
- Figure 52: South Africa MEA Cancer Vaccines Market Volume (K Unit), by Treatment Method 2024 & 2032
- Figure 53: South Africa MEA Cancer Vaccines Market Revenue Share (%), by Treatment Method 2024 & 2032
- Figure 54: South Africa MEA Cancer Vaccines Market Volume Share (%), by Treatment Method 2024 & 2032
- Figure 55: South Africa MEA Cancer Vaccines Market Revenue (Million), by Application 2024 & 2032
- Figure 56: South Africa MEA Cancer Vaccines Market Volume (K Unit), by Application 2024 & 2032
- Figure 57: South Africa MEA Cancer Vaccines Market Revenue Share (%), by Application 2024 & 2032
- Figure 58: South Africa MEA Cancer Vaccines Market Volume Share (%), by Application 2024 & 2032
- Figure 59: South Africa MEA Cancer Vaccines Market Revenue (Million), by Geography 2024 & 2032
- Figure 60: South Africa MEA Cancer Vaccines Market Volume (K Unit), by Geography 2024 & 2032
- Figure 61: South Africa MEA Cancer Vaccines Market Revenue Share (%), by Geography 2024 & 2032
- Figure 62: South Africa MEA Cancer Vaccines Market Volume Share (%), by Geography 2024 & 2032
- Figure 63: South Africa MEA Cancer Vaccines Market Revenue (Million), by Country 2024 & 2032
- Figure 64: South Africa MEA Cancer Vaccines Market Volume (K Unit), by Country 2024 & 2032
- Figure 65: South Africa MEA Cancer Vaccines Market Revenue Share (%), by Country 2024 & 2032
- Figure 66: South Africa MEA Cancer Vaccines Market Volume Share (%), by Country 2024 & 2032
- Figure 67: Rest of Middle East and Africa MEA Cancer Vaccines Market Revenue (Million), by Technology 2024 & 2032
- Figure 68: Rest of Middle East and Africa MEA Cancer Vaccines Market Volume (K Unit), by Technology 2024 & 2032
- Figure 69: Rest of Middle East and Africa MEA Cancer Vaccines Market Revenue Share (%), by Technology 2024 & 2032
- Figure 70: Rest of Middle East and Africa MEA Cancer Vaccines Market Volume Share (%), by Technology 2024 & 2032
- Figure 71: Rest of Middle East and Africa MEA Cancer Vaccines Market Revenue (Million), by Treatment Method 2024 & 2032
- Figure 72: Rest of Middle East and Africa MEA Cancer Vaccines Market Volume (K Unit), by Treatment Method 2024 & 2032
- Figure 73: Rest of Middle East and Africa MEA Cancer Vaccines Market Revenue Share (%), by Treatment Method 2024 & 2032
- Figure 74: Rest of Middle East and Africa MEA Cancer Vaccines Market Volume Share (%), by Treatment Method 2024 & 2032
- Figure 75: Rest of Middle East and Africa MEA Cancer Vaccines Market Revenue (Million), by Application 2024 & 2032
- Figure 76: Rest of Middle East and Africa MEA Cancer Vaccines Market Volume (K Unit), by Application 2024 & 2032
- Figure 77: Rest of Middle East and Africa MEA Cancer Vaccines Market Revenue Share (%), by Application 2024 & 2032
- Figure 78: Rest of Middle East and Africa MEA Cancer Vaccines Market Volume Share (%), by Application 2024 & 2032
- Figure 79: Rest of Middle East and Africa MEA Cancer Vaccines Market Revenue (Million), by Geography 2024 & 2032
- Figure 80: Rest of Middle East and Africa MEA Cancer Vaccines Market Volume (K Unit), by Geography 2024 & 2032
- Figure 81: Rest of Middle East and Africa MEA Cancer Vaccines Market Revenue Share (%), by Geography 2024 & 2032
- Figure 82: Rest of Middle East and Africa MEA Cancer Vaccines Market Volume Share (%), by Geography 2024 & 2032
- Figure 83: Rest of Middle East and Africa MEA Cancer Vaccines Market Revenue (Million), by Country 2024 & 2032
- Figure 84: Rest of Middle East and Africa MEA Cancer Vaccines Market Volume (K Unit), by Country 2024 & 2032
- Figure 85: Rest of Middle East and Africa MEA Cancer Vaccines Market Revenue Share (%), by Country 2024 & 2032
- Figure 86: Rest of Middle East and Africa MEA Cancer Vaccines Market Volume Share (%), by Country 2024 & 2032
List of Tables
- Table 1: Global MEA Cancer Vaccines Market Revenue Million Forecast, by Region 2019 & 2032
- Table 2: Global MEA Cancer Vaccines Market Volume K Unit Forecast, by Region 2019 & 2032
- Table 3: Global MEA Cancer Vaccines Market Revenue Million Forecast, by Technology 2019 & 2032
- Table 4: Global MEA Cancer Vaccines Market Volume K Unit Forecast, by Technology 2019 & 2032
- Table 5: Global MEA Cancer Vaccines Market Revenue Million Forecast, by Treatment Method 2019 & 2032
- Table 6: Global MEA Cancer Vaccines Market Volume K Unit Forecast, by Treatment Method 2019 & 2032
- Table 7: Global MEA Cancer Vaccines Market Revenue Million Forecast, by Application 2019 & 2032
- Table 8: Global MEA Cancer Vaccines Market Volume K Unit Forecast, by Application 2019 & 2032
- Table 9: Global MEA Cancer Vaccines Market Revenue Million Forecast, by Geography 2019 & 2032
- Table 10: Global MEA Cancer Vaccines Market Volume K Unit Forecast, by Geography 2019 & 2032
- Table 11: Global MEA Cancer Vaccines Market Revenue Million Forecast, by Region 2019 & 2032
- Table 12: Global MEA Cancer Vaccines Market Volume K Unit Forecast, by Region 2019 & 2032
- Table 13: Global MEA Cancer Vaccines Market Revenue Million Forecast, by Country 2019 & 2032
- Table 14: Global MEA Cancer Vaccines Market Volume K Unit Forecast, by Country 2019 & 2032
- Table 15: Global MEA Cancer Vaccines Market Revenue Million Forecast, by Country 2019 & 2032
- Table 16: Global MEA Cancer Vaccines Market Volume K Unit Forecast, by Country 2019 & 2032
- Table 17: Global MEA Cancer Vaccines Market Revenue Million Forecast, by Country 2019 & 2032
- Table 18: Global MEA Cancer Vaccines Market Volume K Unit Forecast, by Country 2019 & 2032
- Table 19: Global MEA Cancer Vaccines Market Revenue Million Forecast, by Country 2019 & 2032
- Table 20: Global MEA Cancer Vaccines Market Volume K Unit Forecast, by Country 2019 & 2032
- Table 21: Global MEA Cancer Vaccines Market Revenue Million Forecast, by Country 2019 & 2032
- Table 22: Global MEA Cancer Vaccines Market Volume K Unit Forecast, by Country 2019 & 2032
- Table 23: Global MEA Cancer Vaccines Market Revenue Million Forecast, by Country 2019 & 2032
- Table 24: Global MEA Cancer Vaccines Market Volume K Unit Forecast, by Country 2019 & 2032
- Table 25: Global MEA Cancer Vaccines Market Revenue Million Forecast, by Technology 2019 & 2032
- Table 26: Global MEA Cancer Vaccines Market Volume K Unit Forecast, by Technology 2019 & 2032
- Table 27: Global MEA Cancer Vaccines Market Revenue Million Forecast, by Treatment Method 2019 & 2032
- Table 28: Global MEA Cancer Vaccines Market Volume K Unit Forecast, by Treatment Method 2019 & 2032
- Table 29: Global MEA Cancer Vaccines Market Revenue Million Forecast, by Application 2019 & 2032
- Table 30: Global MEA Cancer Vaccines Market Volume K Unit Forecast, by Application 2019 & 2032
- Table 31: Global MEA Cancer Vaccines Market Revenue Million Forecast, by Geography 2019 & 2032
- Table 32: Global MEA Cancer Vaccines Market Volume K Unit Forecast, by Geography 2019 & 2032
- Table 33: Global MEA Cancer Vaccines Market Revenue Million Forecast, by Country 2019 & 2032
- Table 34: Global MEA Cancer Vaccines Market Volume K Unit Forecast, by Country 2019 & 2032
- Table 35: Global MEA Cancer Vaccines Market Revenue Million Forecast, by Technology 2019 & 2032
- Table 36: Global MEA Cancer Vaccines Market Volume K Unit Forecast, by Technology 2019 & 2032
- Table 37: Global MEA Cancer Vaccines Market Revenue Million Forecast, by Treatment Method 2019 & 2032
- Table 38: Global MEA Cancer Vaccines Market Volume K Unit Forecast, by Treatment Method 2019 & 2032
- Table 39: Global MEA Cancer Vaccines Market Revenue Million Forecast, by Application 2019 & 2032
- Table 40: Global MEA Cancer Vaccines Market Volume K Unit Forecast, by Application 2019 & 2032
- Table 41: Global MEA Cancer Vaccines Market Revenue Million Forecast, by Geography 2019 & 2032
- Table 42: Global MEA Cancer Vaccines Market Volume K Unit Forecast, by Geography 2019 & 2032
- Table 43: Global MEA Cancer Vaccines Market Revenue Million Forecast, by Country 2019 & 2032
- Table 44: Global MEA Cancer Vaccines Market Volume K Unit Forecast, by Country 2019 & 2032
- Table 45: Global MEA Cancer Vaccines Market Revenue Million Forecast, by Technology 2019 & 2032
- Table 46: Global MEA Cancer Vaccines Market Volume K Unit Forecast, by Technology 2019 & 2032
- Table 47: Global MEA Cancer Vaccines Market Revenue Million Forecast, by Treatment Method 2019 & 2032
- Table 48: Global MEA Cancer Vaccines Market Volume K Unit Forecast, by Treatment Method 2019 & 2032
- Table 49: Global MEA Cancer Vaccines Market Revenue Million Forecast, by Application 2019 & 2032
- Table 50: Global MEA Cancer Vaccines Market Volume K Unit Forecast, by Application 2019 & 2032
- Table 51: Global MEA Cancer Vaccines Market Revenue Million Forecast, by Geography 2019 & 2032
- Table 52: Global MEA Cancer Vaccines Market Volume K Unit Forecast, by Geography 2019 & 2032
- Table 53: Global MEA Cancer Vaccines Market Revenue Million Forecast, by Country 2019 & 2032
- Table 54: Global MEA Cancer Vaccines Market Volume K Unit Forecast, by Country 2019 & 2032
Frequently Asked Questions
1. What is the projected Compound Annual Growth Rate (CAGR) of the MEA Cancer Vaccines Market?
The projected CAGR is approximately 9.60%.
2. Which companies are prominent players in the MEA Cancer Vaccines Market?
Key companies in the market include Biopharma Middle East & Africa, Merck KGaA, Sanofi, Astellas Pharma Inc, Creative Biolabs, AstraZeneca PLC, Pfizer, GSK, Bristol-Myers Squibb, Dendreon.
3. What are the main segments of the MEA Cancer Vaccines Market?
The market segments include Technology, Treatment Method, Application, Geography.
4. Can you provide details about the market size?
The market size is estimated to be USD XX Million as of 2022.
5. What are some drivers contributing to market growth?
Increasing Number of Cancer Cases; Rise in Research and Developments in Cancer Vaccines.
6. What are the notable trends driving market growth?
Cervical Cancer Segment is Expected to Witness a Significant Growth in the Market Over the Forecast Period.
7. Are there any restraints impacting market growth?
Presence of Alternative Therapies.
8. Can you provide examples of recent developments in the market?
December 2022: Cancer Moonshot publicized new actions aimed at reducing the cancer burden in Africa as part of the United States-Africa Leaders Summit. The Cancer Moonshot highlights bold deliverables and new announcements from U.S. departments and agencies and the private sector of over USD 300 million to drastically improve cancer outcomes in Africa.
9. What pricing options are available for accessing the report?
Pricing options include single-user, multi-user, and enterprise licenses priced at USD 4750, USD 5250, and USD 8750 respectively.
10. Is the market size provided in terms of value or volume?
The market size is provided in terms of value, measured in Million and volume, measured in K Unit.
11. Are there any specific market keywords associated with the report?
Yes, the market keyword associated with the report is "MEA Cancer Vaccines Market," which aids in identifying and referencing the specific market segment covered.
12. How do I determine which pricing option suits my needs best?
The pricing options vary based on user requirements and access needs. Individual users may opt for single-user licenses, while businesses requiring broader access may choose multi-user or enterprise licenses for cost-effective access to the report.
13. Are there any additional resources or data provided in the MEA Cancer Vaccines Market report?
While the report offers comprehensive insights, it's advisable to review the specific contents or supplementary materials provided to ascertain if additional resources or data are available.
14. How can I stay updated on further developments or reports in the MEA Cancer Vaccines Market?
To stay informed about further developments, trends, and reports in the MEA Cancer Vaccines Market, consider subscribing to industry newsletters, following relevant companies and organizations, or regularly checking reputable industry news sources and publications.
Methodology
Step 1 - Identification of Relevant Samples Size from Population Database


Step 2 - Approaches for Defining Global Market Size (Value, Volume* & Price*)

Note*: In applicable scenarios
Step 3 - Data Sources
Primary Research
- Web Analytics
- Survey Reports
- Research Institute
- Latest Research Reports
- Opinion Leaders
Secondary Research
- Annual Reports
- White Paper
- Latest Press Release
- Industry Association
- Paid Database
- Investor Presentations

Step 4 - Data Triangulation
Involves using different sources of information in order to increase the validity of a study
These sources are likely to be stakeholders in a program - participants, other researchers, program staff, other community members, and so on.
Then we put all data in single framework & apply various statistical tools to find out the dynamic on the market.
During the analysis stage, feedback from the stakeholder groups would be compared to determine areas of agreement as well as areas of divergence
