

Key Insights
The Middle East and Africa (MEA) Demand Response Management Systems (DRMS) market is experiencing robust growth, driven by increasing electricity demand, rising energy costs, and a commitment to grid stability and sustainability. The region's diverse energy mix, including significant reliance on fossil fuels, necessitates efficient energy management solutions. Government initiatives promoting renewable energy integration and smart grid technologies are further fueling market expansion. The adoption of Automated Demand Response (ADR) systems is particularly noteworthy, offering greater efficiency and control compared to Conventional Demand Response (CDR). This shift towards automation is being propelled by advancements in IoT, AI, and big data analytics, allowing for real-time grid optimization and proactive demand management. While the initial investment in DRMS can be significant, the long-term cost savings achieved through reduced peak demand charges and improved energy efficiency make it a compelling proposition for utilities and large consumers. Furthermore, increasing awareness of the environmental benefits associated with demand-side management is contributing to the overall market growth.
Looking forward, the MEA DRMS market is poised for sustained growth throughout the forecast period (2025-2033). Factors like population growth, urbanization, and industrial expansion will continue to increase electricity consumption, creating a strong demand for DRMS solutions. However, challenges remain, including infrastructure limitations in some parts of the region and the need for increased digital literacy and technical expertise to effectively implement and manage these advanced systems. Nevertheless, the overall outlook for the MEA DRMS market is positive, with significant opportunities for market players specializing in both conventional and automated solutions. The focus will likely be on developing tailored solutions that address the specific challenges and opportunities presented by the unique energy landscape of each MEA country. Key players are likely to leverage partnerships and strategic collaborations to expand their market reach and accelerate adoption.
MEA Demand Response Management Systems Industry: Market Report 2019-2033
This comprehensive report provides an in-depth analysis of the Middle East and Africa (MEA) Demand Response Management Systems market, offering invaluable insights for industry professionals, investors, and strategic decision-makers. Spanning the period from 2019 to 2033, with a focus on 2025, this report meticulously examines market dynamics, growth trends, key players, and future opportunities within this rapidly evolving sector. The report segments the market by Type: Conventional Demand Response and Automated Demand Response, providing granular analysis for each. The total market size is projected to reach xx Million by 2033.
Parent Market: Energy Management Systems Child Market: Demand Response Management Systems
MEA Demand Response Management Systems Industry Market Dynamics & Structure
This section analyzes the MEA Demand Response Management Systems market structure, encompassing market concentration, technological innovation, regulatory landscapes, competitive substitutes, end-user demographics, and mergers & acquisitions (M&A) activity. The market exhibits a moderately concentrated structure with a few major players holding significant market share. However, the emergence of innovative technologies and new entrants is increasing competition.
- Market Concentration: The top 5 players account for approximately xx% of the market share in 2025.
- Technological Innovation: Advancements in AI, IoT, and cloud computing are driving innovation, leading to more efficient and sophisticated demand response systems.
- Regulatory Frameworks: Government initiatives and policies promoting energy efficiency and sustainability are key drivers of market growth. Stringent regulations regarding carbon emissions are also influencing adoption rates.
- Competitive Substitutes: Traditional energy management approaches pose a competitive challenge, although the increasing cost-effectiveness of demand response systems is shifting the balance.
- End-User Demographics: The industrial and commercial sectors represent the largest end-user segments, driven by the need to optimize energy costs and reduce carbon footprints. Government initiatives are also driving adoption within the public sector.
- M&A Trends: The past five years have witnessed xx M&A deals in the MEA region, indicating a consolidating market landscape.
MEA Demand Response Management Systems Industry Growth Trends & Insights
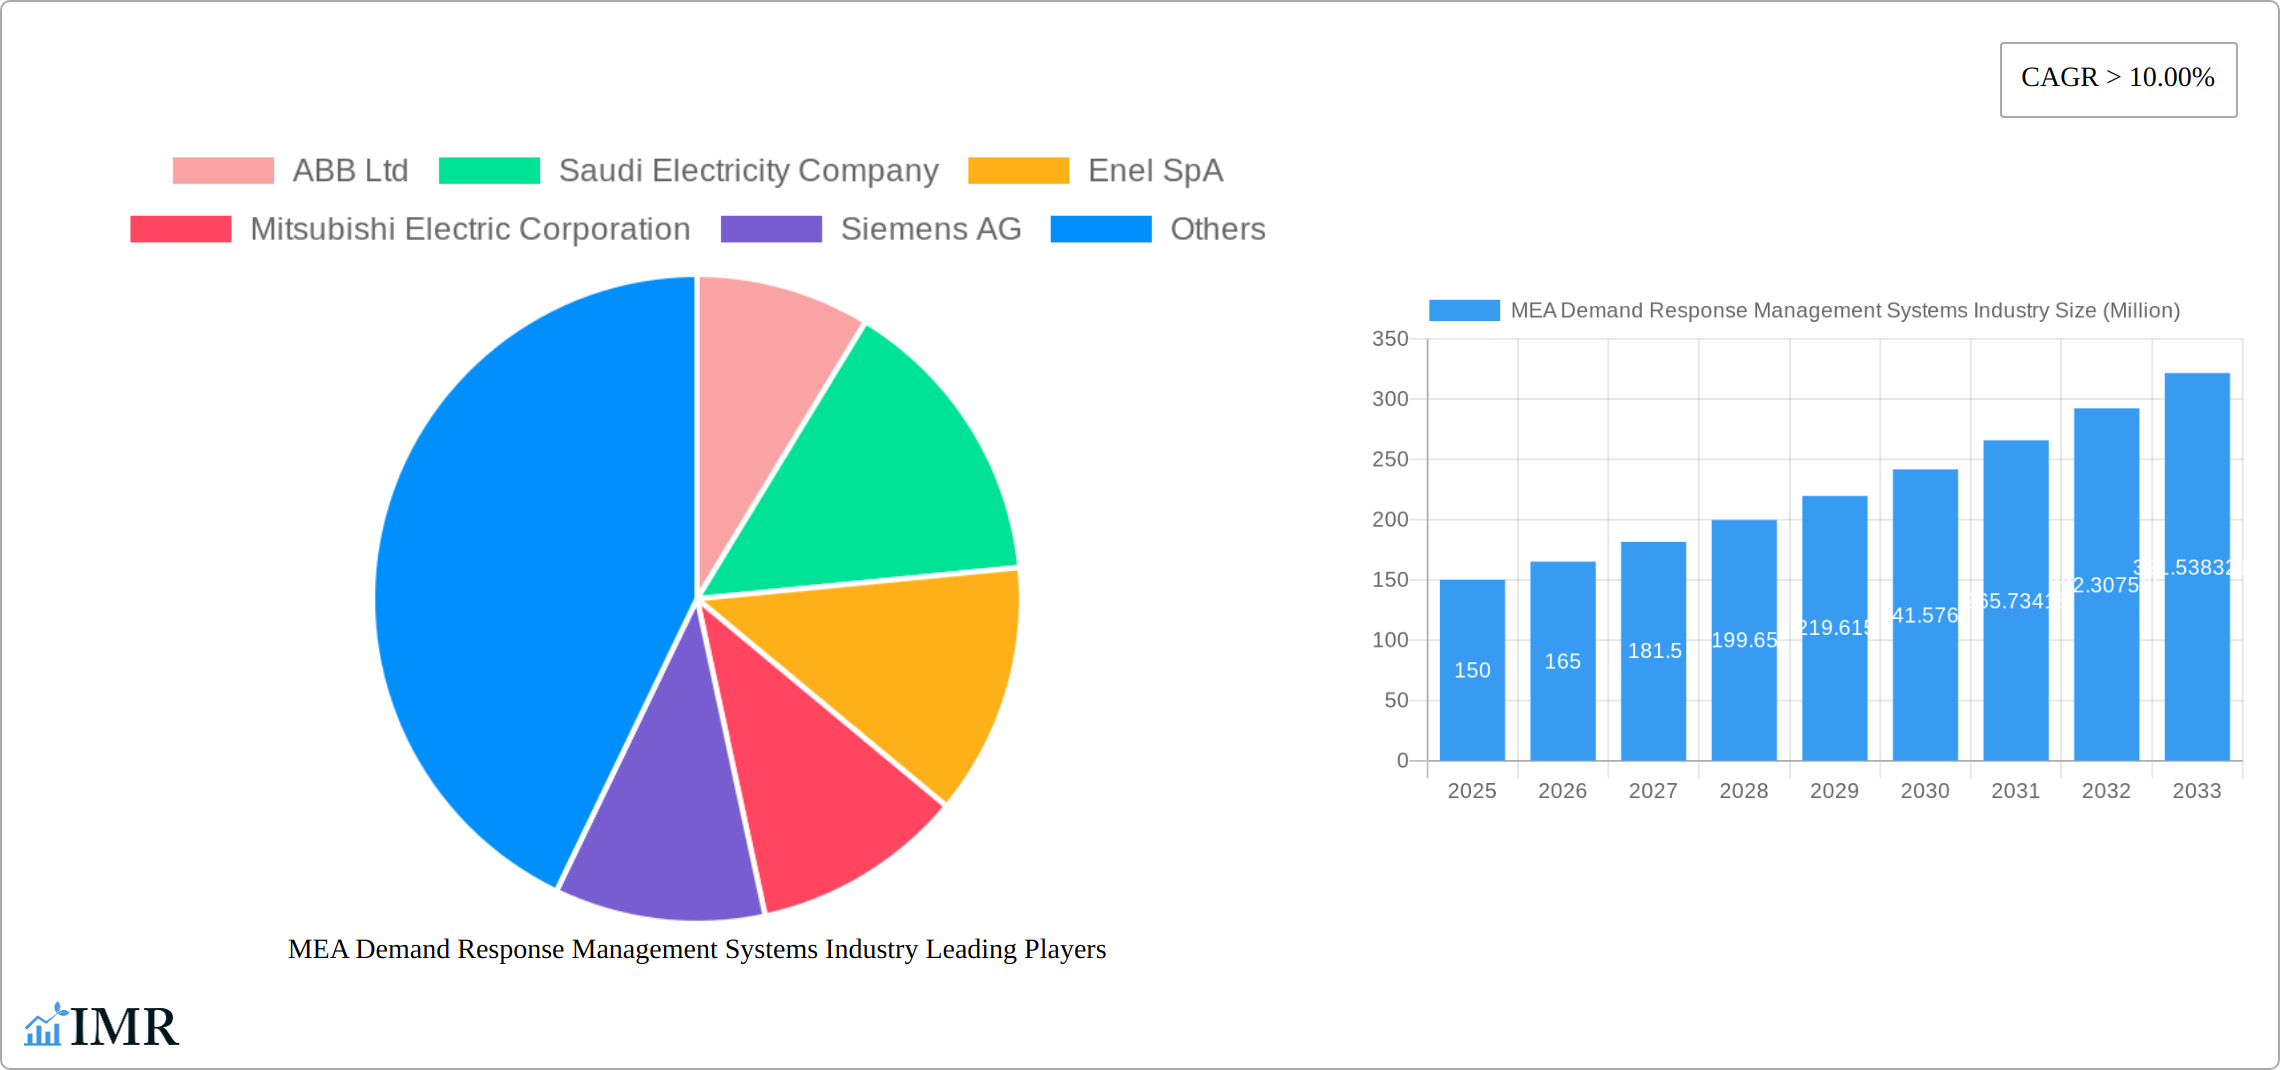
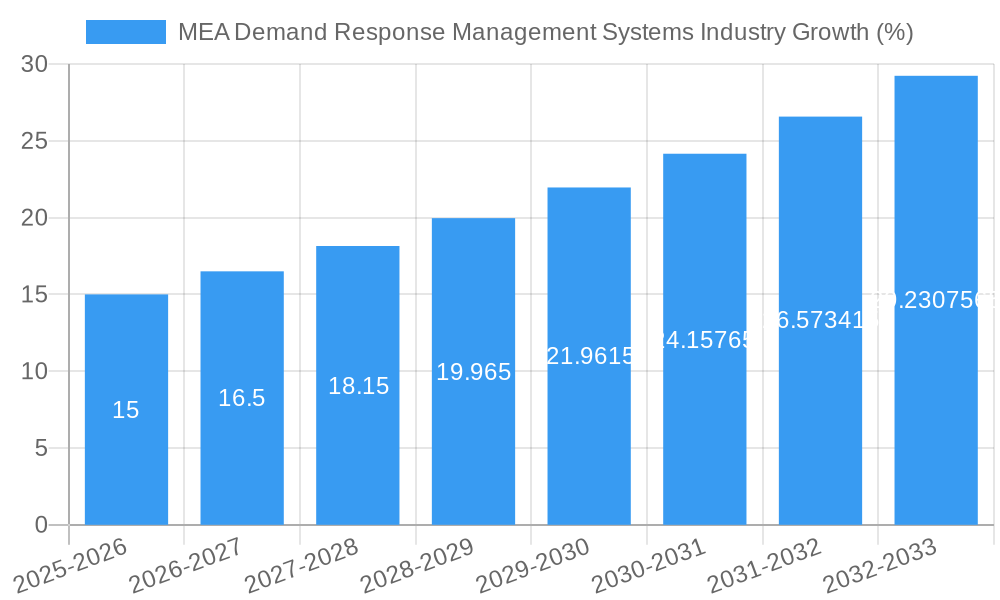
The MEA Demand Response Management Systems market has experienced substantial growth during the historical period (2019-2024), primarily driven by increasing energy costs, rising environmental concerns, and supportive government policies. The market size is estimated to be xx Million in 2025. The forecast period (2025-2033) anticipates continued growth at a Compound Annual Growth Rate (CAGR) of xx%, driven by factors such as rising energy demand, increasing adoption of smart grids, and growing awareness of energy efficiency. Market penetration is projected to increase from xx% in 2025 to xx% by 2033. The transition to renewable energy sources is also fueling demand for sophisticated demand response systems to manage fluctuating energy supplies.
Dominant Regions, Countries, or Segments in MEA Demand Response Management Systems Industry
The UAE and Saudi Arabia represent the dominant markets within the MEA region, owing to their substantial investments in energy infrastructure and supportive regulatory frameworks. The industrial sector, followed by the commercial sector, are the leading segments driving market growth.
- Key Drivers in UAE & Saudi Arabia:
- Significant investments in smart grid infrastructure.
- Government initiatives promoting energy efficiency.
- High energy consumption rates in industrial and commercial sectors.
- Automated Demand Response (ADR) Segment Dominance: ADR systems are witnessing rapid growth due to their ability to automatically adjust energy consumption based on real-time grid conditions, leading to improved efficiency and cost savings.
MEA Demand Response Management Systems Industry Product Landscape
The MEA Demand Response Management Systems (DRMS) industry is experiencing a rapid transformation. DRMS are evolving beyond basic load shedding, becoming sophisticated, AI-powered platforms that integrate real-time data analytics, predictive modeling, and automated control. These advanced systems incorporate features such as remote monitoring, fault detection, and predictive maintenance, enhancing efficiency and reliability. Their core value proposition lies in optimizing energy consumption, reducing operational costs, and bolstering grid stability. The integration of cutting-edge technologies like IoT, AI, machine learning, and cloud computing is continuously enhancing system performance and functionality, paving the way for more intelligent and responsive energy management solutions across the region.
Key Drivers, Barriers & Challenges in MEA Demand Response Management Systems Industry
Key Drivers: The MEA DRMS market is propelled by several factors. Rising energy costs, particularly volatile fossil fuel prices, are driving the need for cost-effective energy solutions. Stringent environmental regulations aimed at reducing carbon emissions are pushing for energy efficiency improvements. Government initiatives promoting renewable energy integration and incentivizing energy efficiency programs are creating a favorable regulatory environment. Moreover, the critical need for grid modernization and enhanced reliability to support increasing energy demand and intermittent renewable sources is a primary driver for DRMS adoption.
Key Challenges: Despite the significant growth potential, the MEA DRMS market faces challenges. High upfront capital expenditure for system implementation can be a deterrent for some organizations. Lack of widespread awareness among end-users about the benefits of DRMS and a perceived complexity in implementation can hinder adoption. Complex regulatory landscapes and varying standards across different MEA countries add to the complexity. The need for a skilled workforce to operate and maintain these systems, especially those with expertise in AI and data analytics, presents a significant hurdle. Furthermore, ongoing supply chain disruptions and the ever-present threat of cybersecurity attacks are key factors impacting market growth and stability.
Emerging Opportunities in MEA Demand Response Management Systems Industry
Untapped potential exists within smaller economies of the MEA region, where government incentives can accelerate adoption. Emerging technologies like blockchain can enhance security and transparency, while integration with other smart city technologies present exciting opportunities. Innovative business models like energy-as-a-service (EaaS) are gaining traction.
Growth Accelerators in the MEA Demand Response Management Systems Industry
Several factors are poised to accelerate growth within the MEA DRMS sector. Technological advancements, particularly in AI, machine learning, and IoT, are enabling the development of more efficient and intelligent DRMS solutions. Strategic partnerships between energy providers, technology companies, and end-users are fostering wider market acceptance and driving innovation. Government-led initiatives focused on improving energy infrastructure, promoting energy efficiency, and establishing supportive regulatory frameworks are crucial for sustained long-term growth. The increasing focus on smart city initiatives and the growing adoption of renewable energy sources also contribute to the expanding market opportunities for DRMS.
Key Players Shaping the MEA Demand Response Management Systems Market
- ABB Ltd
- Saudi Electricity Company
- Enel SpA
- Mitsubishi Electric Corporation
- Siemens AG
- Alstom SA
- Eaton Corporation PLC
- Schneider Electric
- General Electric Company
Notable Milestones in MEA Demand Response Management Systems Industry Sector
- Nov 2022: The Abu Dhabi Department of Economic Development (ADDED) launched ETIP 2.0, a program incentivizing industrial energy efficiency. This initiative significantly boosted demand for DRMS within the industrial sector.
- Apr 2022: The UAE Ministry of Energy and Infrastructure launched a comprehensive database to monitor energy consumption in government buildings. This transparency initiative is driving efficiency improvements and increased adoption of DRMS within the public sector.
- [Add other relevant milestones with dates and brief descriptions]
In-Depth MEA Demand Response Management Systems Industry Market Outlook
The MEA Demand Response Management Systems market is projected to experience robust growth throughout the forecast period. This growth trajectory is fueled by a confluence of factors: the increasing affordability of DRMS technology, supportive government policies and regulatory frameworks, rising energy costs, and a growing awareness of the importance of energy efficiency. Strategic partnerships that foster collaboration and knowledge sharing between stakeholders will be vital in driving market penetration. Expansion into untapped markets within the MEA region, particularly within the industrial and commercial sectors, presents significant growth opportunities. The long-term success of the MEA DRMS market is intrinsically linked to the successful integration of these systems into broader smart grid initiatives and their widespread adoption across diverse end-user segments, including residential, commercial, and industrial applications.
MEA Demand Response Management Systems Industry Segmentation
-
1. Type
- 1.1. Conventional Demand Response
- 1.2. Automated Demand Response
-
2. Geography
- 2.1. United Arab Emirates
- 2.2. Saudi Arabian
- 2.3. South Africa
- 2.4. Res of Middle-East and Africa
MEA Demand Response Management Systems Industry Segmentation By Geography
- 1. United Arab Emirates
- 2. Saudi Arabian
- 3. South Africa
- 4. Res of Middle East and Africa
MEA Demand Response Management Systems Industry REPORT HIGHLIGHTS
| Aspects | Details |
|---|---|
| Study Period | 2019-2033 |
| Base Year | 2024 |
| Estimated Year | 2025 |
| Forecast Period | 2025-2033 |
| Historical Period | 2019-2024 |
| Growth Rate | CAGR of > 10.00% from 2019-2033 |
| Segmentation |
|
Table of Contents
- 1. Introduction
- 1.1. Research Scope
- 1.2. Market Segmentation
- 1.3. Research Methodology
- 1.4. Definitions and Assumptions
- 2. Executive Summary
- 2.1. Introduction
- 3. Market Dynamics
- 3.1. Introduction
- 3.2. Market Drivers
- 3.2.1. 4.; Need for Efficient Energy Management Systems4.; Growing Penetration of Renewable Energy Sources
- 3.3. Market Restrains
- 3.3.1. 4.; Privacy Concerns on the Industrial Demand Response Management Systems
- 3.4. Market Trends
- 3.4.1. Automated Demand Response System to Grow at the Fastest Rate
- 4. Market Factor Analysis
- 4.1. Porters Five Forces
- 4.2. Supply/Value Chain
- 4.3. PESTEL analysis
- 4.4. Market Entropy
- 4.5. Patent/Trademark Analysis
- 5. Global MEA Demand Response Management Systems Industry Analysis, Insights and Forecast, 2019-2031
- 5.1. Market Analysis, Insights and Forecast - by Type
- 5.1.1. Conventional Demand Response
- 5.1.2. Automated Demand Response
- 5.2. Market Analysis, Insights and Forecast - by Geography
- 5.2.1. United Arab Emirates
- 5.2.2. Saudi Arabian
- 5.2.3. South Africa
- 5.2.4. Res of Middle-East and Africa
- 5.3. Market Analysis, Insights and Forecast - by Region
- 5.3.1. United Arab Emirates
- 5.3.2. Saudi Arabian
- 5.3.3. South Africa
- 5.3.4. Res of Middle East and Africa
- 5.1. Market Analysis, Insights and Forecast - by Type
- 6. United Arab Emirates MEA Demand Response Management Systems Industry Analysis, Insights and Forecast, 2019-2031
- 6.1. Market Analysis, Insights and Forecast - by Type
- 6.1.1. Conventional Demand Response
- 6.1.2. Automated Demand Response
- 6.2. Market Analysis, Insights and Forecast - by Geography
- 6.2.1. United Arab Emirates
- 6.2.2. Saudi Arabian
- 6.2.3. South Africa
- 6.2.4. Res of Middle-East and Africa
- 6.1. Market Analysis, Insights and Forecast - by Type
- 7. Saudi Arabian MEA Demand Response Management Systems Industry Analysis, Insights and Forecast, 2019-2031
- 7.1. Market Analysis, Insights and Forecast - by Type
- 7.1.1. Conventional Demand Response
- 7.1.2. Automated Demand Response
- 7.2. Market Analysis, Insights and Forecast - by Geography
- 7.2.1. United Arab Emirates
- 7.2.2. Saudi Arabian
- 7.2.3. South Africa
- 7.2.4. Res of Middle-East and Africa
- 7.1. Market Analysis, Insights and Forecast - by Type
- 8. South Africa MEA Demand Response Management Systems Industry Analysis, Insights and Forecast, 2019-2031
- 8.1. Market Analysis, Insights and Forecast - by Type
- 8.1.1. Conventional Demand Response
- 8.1.2. Automated Demand Response
- 8.2. Market Analysis, Insights and Forecast - by Geography
- 8.2.1. United Arab Emirates
- 8.2.2. Saudi Arabian
- 8.2.3. South Africa
- 8.2.4. Res of Middle-East and Africa
- 8.1. Market Analysis, Insights and Forecast - by Type
- 9. Res of Middle East and Africa MEA Demand Response Management Systems Industry Analysis, Insights and Forecast, 2019-2031
- 9.1. Market Analysis, Insights and Forecast - by Type
- 9.1.1. Conventional Demand Response
- 9.1.2. Automated Demand Response
- 9.2. Market Analysis, Insights and Forecast - by Geography
- 9.2.1. United Arab Emirates
- 9.2.2. Saudi Arabian
- 9.2.3. South Africa
- 9.2.4. Res of Middle-East and Africa
- 9.1. Market Analysis, Insights and Forecast - by Type
- 10. North America MEA Demand Response Management Systems Industry Analysis, Insights and Forecast, 2019-2031
- 10.1. Market Analysis, Insights and Forecast - By Country/Sub-region
- 10.1.1 United States
- 10.1.2 Canada
- 10.1.3 Mexico
- 11. Europe MEA Demand Response Management Systems Industry Analysis, Insights and Forecast, 2019-2031
- 11.1. Market Analysis, Insights and Forecast - By Country/Sub-region
- 11.1.1 Germany
- 11.1.2 United Kingdom
- 11.1.3 France
- 11.1.4 Spain
- 11.1.5 Italy
- 11.1.6 Spain
- 11.1.7 Belgium
- 11.1.8 Netherland
- 11.1.9 Nordics
- 11.1.10 Rest of Europe
- 12. Asia Pacific MEA Demand Response Management Systems Industry Analysis, Insights and Forecast, 2019-2031
- 12.1. Market Analysis, Insights and Forecast - By Country/Sub-region
- 12.1.1 China
- 12.1.2 Japan
- 12.1.3 India
- 12.1.4 South Korea
- 12.1.5 Southeast Asia
- 12.1.6 Australia
- 12.1.7 Indonesia
- 12.1.8 Phillipes
- 12.1.9 Singapore
- 12.1.10 Thailandc
- 12.1.11 Rest of Asia Pacific
- 13. South America MEA Demand Response Management Systems Industry Analysis, Insights and Forecast, 2019-2031
- 13.1. Market Analysis, Insights and Forecast - By Country/Sub-region
- 13.1.1 Brazil
- 13.1.2 Argentina
- 13.1.3 Peru
- 13.1.4 Chile
- 13.1.5 Colombia
- 13.1.6 Ecuador
- 13.1.7 Venezuela
- 13.1.8 Rest of South America
- 14. MEA MEA Demand Response Management Systems Industry Analysis, Insights and Forecast, 2019-2031
- 14.1. Market Analysis, Insights and Forecast - By Country/Sub-region
- 14.1.1 United Arab Emirates
- 14.1.2 Saudi Arabia
- 14.1.3 South Africa
- 14.1.4 Rest of Middle East and Africa
- 15. Competitive Analysis
- 15.1. Global Market Share Analysis 2024
- 15.2. Company Profiles
- 15.2.1 ABB Ltd
- 15.2.1.1. Overview
- 15.2.1.2. Products
- 15.2.1.3. SWOT Analysis
- 15.2.1.4. Recent Developments
- 15.2.1.5. Financials (Based on Availability)
- 15.2.2 Saudi Electricity Company
- 15.2.2.1. Overview
- 15.2.2.2. Products
- 15.2.2.3. SWOT Analysis
- 15.2.2.4. Recent Developments
- 15.2.2.5. Financials (Based on Availability)
- 15.2.3 Enel SpA
- 15.2.3.1. Overview
- 15.2.3.2. Products
- 15.2.3.3. SWOT Analysis
- 15.2.3.4. Recent Developments
- 15.2.3.5. Financials (Based on Availability)
- 15.2.4 Mitsubishi Electric Corporation
- 15.2.4.1. Overview
- 15.2.4.2. Products
- 15.2.4.3. SWOT Analysis
- 15.2.4.4. Recent Developments
- 15.2.4.5. Financials (Based on Availability)
- 15.2.5 Siemens AG
- 15.2.5.1. Overview
- 15.2.5.2. Products
- 15.2.5.3. SWOT Analysis
- 15.2.5.4. Recent Developments
- 15.2.5.5. Financials (Based on Availability)
- 15.2.6 Alstom SA
- 15.2.6.1. Overview
- 15.2.6.2. Products
- 15.2.6.3. SWOT Analysis
- 15.2.6.4. Recent Developments
- 15.2.6.5. Financials (Based on Availability)
- 15.2.7 Eaton Corporation PLC
- 15.2.7.1. Overview
- 15.2.7.2. Products
- 15.2.7.3. SWOT Analysis
- 15.2.7.4. Recent Developments
- 15.2.7.5. Financials (Based on Availability)
- 15.2.8 Schneider Electric
- 15.2.8.1. Overview
- 15.2.8.2. Products
- 15.2.8.3. SWOT Analysis
- 15.2.8.4. Recent Developments
- 15.2.8.5. Financials (Based on Availability)
- 15.2.9 General Electric Company
- 15.2.9.1. Overview
- 15.2.9.2. Products
- 15.2.9.3. SWOT Analysis
- 15.2.9.4. Recent Developments
- 15.2.9.5. Financials (Based on Availability)
- 15.2.1 ABB Ltd
List of Figures
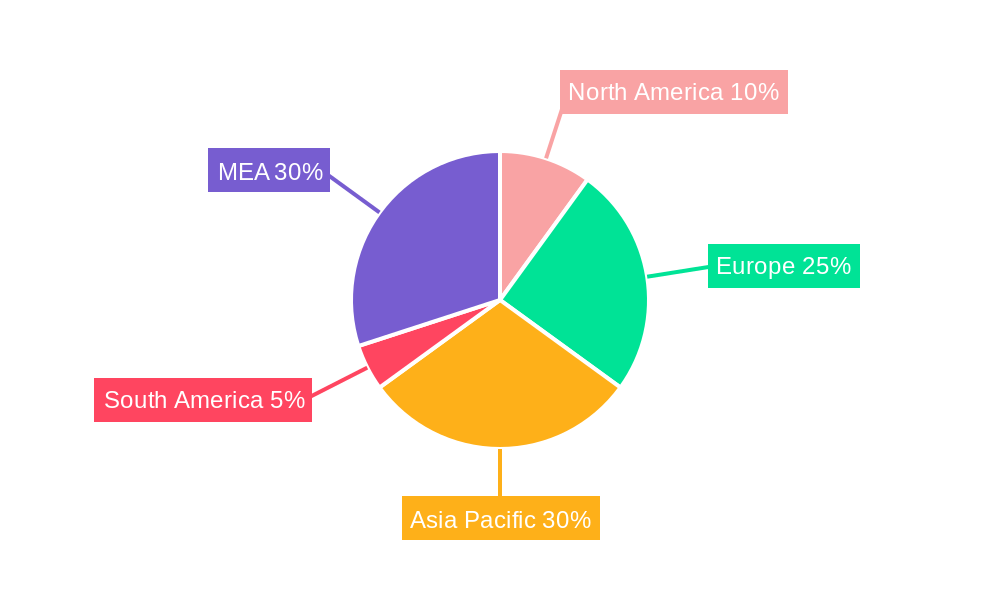
- Figure 1: Global MEA Demand Response Management Systems Industry Revenue Breakdown (Million, %) by Region 2024 & 2032
- Figure 2: North America MEA Demand Response Management Systems Industry Revenue (Million), by Country 2024 & 2032
- Figure 3: North America MEA Demand Response Management Systems Industry Revenue Share (%), by Country 2024 & 2032
- Figure 4: Europe MEA Demand Response Management Systems Industry Revenue (Million), by Country 2024 & 2032
- Figure 5: Europe MEA Demand Response Management Systems Industry Revenue Share (%), by Country 2024 & 2032
- Figure 6: Asia Pacific MEA Demand Response Management Systems Industry Revenue (Million), by Country 2024 & 2032
- Figure 7: Asia Pacific MEA Demand Response Management Systems Industry Revenue Share (%), by Country 2024 & 2032
- Figure 8: South America MEA Demand Response Management Systems Industry Revenue (Million), by Country 2024 & 2032
- Figure 9: South America MEA Demand Response Management Systems Industry Revenue Share (%), by Country 2024 & 2032
- Figure 10: MEA MEA Demand Response Management Systems Industry Revenue (Million), by Country 2024 & 2032
- Figure 11: MEA MEA Demand Response Management Systems Industry Revenue Share (%), by Country 2024 & 2032
- Figure 12: United Arab Emirates MEA Demand Response Management Systems Industry Revenue (Million), by Type 2024 & 2032
- Figure 13: United Arab Emirates MEA Demand Response Management Systems Industry Revenue Share (%), by Type 2024 & 2032
- Figure 14: United Arab Emirates MEA Demand Response Management Systems Industry Revenue (Million), by Geography 2024 & 2032
- Figure 15: United Arab Emirates MEA Demand Response Management Systems Industry Revenue Share (%), by Geography 2024 & 2032
- Figure 16: United Arab Emirates MEA Demand Response Management Systems Industry Revenue (Million), by Country 2024 & 2032
- Figure 17: United Arab Emirates MEA Demand Response Management Systems Industry Revenue Share (%), by Country 2024 & 2032
- Figure 18: Saudi Arabian MEA Demand Response Management Systems Industry Revenue (Million), by Type 2024 & 2032
- Figure 19: Saudi Arabian MEA Demand Response Management Systems Industry Revenue Share (%), by Type 2024 & 2032
- Figure 20: Saudi Arabian MEA Demand Response Management Systems Industry Revenue (Million), by Geography 2024 & 2032
- Figure 21: Saudi Arabian MEA Demand Response Management Systems Industry Revenue Share (%), by Geography 2024 & 2032
- Figure 22: Saudi Arabian MEA Demand Response Management Systems Industry Revenue (Million), by Country 2024 & 2032
- Figure 23: Saudi Arabian MEA Demand Response Management Systems Industry Revenue Share (%), by Country 2024 & 2032
- Figure 24: South Africa MEA Demand Response Management Systems Industry Revenue (Million), by Type 2024 & 2032
- Figure 25: South Africa MEA Demand Response Management Systems Industry Revenue Share (%), by Type 2024 & 2032
- Figure 26: South Africa MEA Demand Response Management Systems Industry Revenue (Million), by Geography 2024 & 2032
- Figure 27: South Africa MEA Demand Response Management Systems Industry Revenue Share (%), by Geography 2024 & 2032
- Figure 28: South Africa MEA Demand Response Management Systems Industry Revenue (Million), by Country 2024 & 2032
- Figure 29: South Africa MEA Demand Response Management Systems Industry Revenue Share (%), by Country 2024 & 2032
- Figure 30: Res of Middle East and Africa MEA Demand Response Management Systems Industry Revenue (Million), by Type 2024 & 2032
- Figure 31: Res of Middle East and Africa MEA Demand Response Management Systems Industry Revenue Share (%), by Type 2024 & 2032
- Figure 32: Res of Middle East and Africa MEA Demand Response Management Systems Industry Revenue (Million), by Geography 2024 & 2032
- Figure 33: Res of Middle East and Africa MEA Demand Response Management Systems Industry Revenue Share (%), by Geography 2024 & 2032
- Figure 34: Res of Middle East and Africa MEA Demand Response Management Systems Industry Revenue (Million), by Country 2024 & 2032
- Figure 35: Res of Middle East and Africa MEA Demand Response Management Systems Industry Revenue Share (%), by Country 2024 & 2032
List of Tables
- Table 1: Global MEA Demand Response Management Systems Industry Revenue Million Forecast, by Region 2019 & 2032
- Table 2: Global MEA Demand Response Management Systems Industry Revenue Million Forecast, by Type 2019 & 2032
- Table 3: Global MEA Demand Response Management Systems Industry Revenue Million Forecast, by Geography 2019 & 2032
- Table 4: Global MEA Demand Response Management Systems Industry Revenue Million Forecast, by Region 2019 & 2032
- Table 5: Global MEA Demand Response Management Systems Industry Revenue Million Forecast, by Country 2019 & 2032
- Table 6: United States MEA Demand Response Management Systems Industry Revenue (Million) Forecast, by Application 2019 & 2032
- Table 7: Canada MEA Demand Response Management Systems Industry Revenue (Million) Forecast, by Application 2019 & 2032
- Table 8: Mexico MEA Demand Response Management Systems Industry Revenue (Million) Forecast, by Application 2019 & 2032
- Table 9: Global MEA Demand Response Management Systems Industry Revenue Million Forecast, by Country 2019 & 2032
- Table 10: Germany MEA Demand Response Management Systems Industry Revenue (Million) Forecast, by Application 2019 & 2032
- Table 11: United Kingdom MEA Demand Response Management Systems Industry Revenue (Million) Forecast, by Application 2019 & 2032
- Table 12: France MEA Demand Response Management Systems Industry Revenue (Million) Forecast, by Application 2019 & 2032
- Table 13: Spain MEA Demand Response Management Systems Industry Revenue (Million) Forecast, by Application 2019 & 2032
- Table 14: Italy MEA Demand Response Management Systems Industry Revenue (Million) Forecast, by Application 2019 & 2032
- Table 15: Spain MEA Demand Response Management Systems Industry Revenue (Million) Forecast, by Application 2019 & 2032
- Table 16: Belgium MEA Demand Response Management Systems Industry Revenue (Million) Forecast, by Application 2019 & 2032
- Table 17: Netherland MEA Demand Response Management Systems Industry Revenue (Million) Forecast, by Application 2019 & 2032
- Table 18: Nordics MEA Demand Response Management Systems Industry Revenue (Million) Forecast, by Application 2019 & 2032
- Table 19: Rest of Europe MEA Demand Response Management Systems Industry Revenue (Million) Forecast, by Application 2019 & 2032
- Table 20: Global MEA Demand Response Management Systems Industry Revenue Million Forecast, by Country 2019 & 2032
- Table 21: China MEA Demand Response Management Systems Industry Revenue (Million) Forecast, by Application 2019 & 2032
- Table 22: Japan MEA Demand Response Management Systems Industry Revenue (Million) Forecast, by Application 2019 & 2032
- Table 23: India MEA Demand Response Management Systems Industry Revenue (Million) Forecast, by Application 2019 & 2032
- Table 24: South Korea MEA Demand Response Management Systems Industry Revenue (Million) Forecast, by Application 2019 & 2032
- Table 25: Southeast Asia MEA Demand Response Management Systems Industry Revenue (Million) Forecast, by Application 2019 & 2032
- Table 26: Australia MEA Demand Response Management Systems Industry Revenue (Million) Forecast, by Application 2019 & 2032
- Table 27: Indonesia MEA Demand Response Management Systems Industry Revenue (Million) Forecast, by Application 2019 & 2032
- Table 28: Phillipes MEA Demand Response Management Systems Industry Revenue (Million) Forecast, by Application 2019 & 2032
- Table 29: Singapore MEA Demand Response Management Systems Industry Revenue (Million) Forecast, by Application 2019 & 2032
- Table 30: Thailandc MEA Demand Response Management Systems Industry Revenue (Million) Forecast, by Application 2019 & 2032
- Table 31: Rest of Asia Pacific MEA Demand Response Management Systems Industry Revenue (Million) Forecast, by Application 2019 & 2032
- Table 32: Global MEA Demand Response Management Systems Industry Revenue Million Forecast, by Country 2019 & 2032
- Table 33: Brazil MEA Demand Response Management Systems Industry Revenue (Million) Forecast, by Application 2019 & 2032
- Table 34: Argentina MEA Demand Response Management Systems Industry Revenue (Million) Forecast, by Application 2019 & 2032
- Table 35: Peru MEA Demand Response Management Systems Industry Revenue (Million) Forecast, by Application 2019 & 2032
- Table 36: Chile MEA Demand Response Management Systems Industry Revenue (Million) Forecast, by Application 2019 & 2032
- Table 37: Colombia MEA Demand Response Management Systems Industry Revenue (Million) Forecast, by Application 2019 & 2032
- Table 38: Ecuador MEA Demand Response Management Systems Industry Revenue (Million) Forecast, by Application 2019 & 2032
- Table 39: Venezuela MEA Demand Response Management Systems Industry Revenue (Million) Forecast, by Application 2019 & 2032
- Table 40: Rest of South America MEA Demand Response Management Systems Industry Revenue (Million) Forecast, by Application 2019 & 2032
- Table 41: Global MEA Demand Response Management Systems Industry Revenue Million Forecast, by Country 2019 & 2032
- Table 42: United Arab Emirates MEA Demand Response Management Systems Industry Revenue (Million) Forecast, by Application 2019 & 2032
- Table 43: Saudi Arabia MEA Demand Response Management Systems Industry Revenue (Million) Forecast, by Application 2019 & 2032
- Table 44: South Africa MEA Demand Response Management Systems Industry Revenue (Million) Forecast, by Application 2019 & 2032
- Table 45: Rest of Middle East and Africa MEA Demand Response Management Systems Industry Revenue (Million) Forecast, by Application 2019 & 2032
- Table 46: Global MEA Demand Response Management Systems Industry Revenue Million Forecast, by Type 2019 & 2032
- Table 47: Global MEA Demand Response Management Systems Industry Revenue Million Forecast, by Geography 2019 & 2032
- Table 48: Global MEA Demand Response Management Systems Industry Revenue Million Forecast, by Country 2019 & 2032
- Table 49: Global MEA Demand Response Management Systems Industry Revenue Million Forecast, by Type 2019 & 2032
- Table 50: Global MEA Demand Response Management Systems Industry Revenue Million Forecast, by Geography 2019 & 2032
- Table 51: Global MEA Demand Response Management Systems Industry Revenue Million Forecast, by Country 2019 & 2032
- Table 52: Global MEA Demand Response Management Systems Industry Revenue Million Forecast, by Type 2019 & 2032
- Table 53: Global MEA Demand Response Management Systems Industry Revenue Million Forecast, by Geography 2019 & 2032
- Table 54: Global MEA Demand Response Management Systems Industry Revenue Million Forecast, by Country 2019 & 2032
- Table 55: Global MEA Demand Response Management Systems Industry Revenue Million Forecast, by Type 2019 & 2032
- Table 56: Global MEA Demand Response Management Systems Industry Revenue Million Forecast, by Geography 2019 & 2032
- Table 57: Global MEA Demand Response Management Systems Industry Revenue Million Forecast, by Country 2019 & 2032
Frequently Asked Questions
1. What is the projected Compound Annual Growth Rate (CAGR) of the MEA Demand Response Management Systems Industry?
The projected CAGR is approximately > 10.00%.
2. Which companies are prominent players in the MEA Demand Response Management Systems Industry?
Key companies in the market include ABB Ltd, Saudi Electricity Company, Enel SpA, Mitsubishi Electric Corporation, Siemens AG, Alstom SA, Eaton Corporation PLC, Schneider Electric, General Electric Company.
3. What are the main segments of the MEA Demand Response Management Systems Industry?
The market segments include Type, Geography.
4. Can you provide details about the market size?
The market size is estimated to be USD XX Million as of 2022.
5. What are some drivers contributing to market growth?
4.; Need for Efficient Energy Management Systems4.; Growing Penetration of Renewable Energy Sources.
6. What are the notable trends driving market growth?
Automated Demand Response System to Grow at the Fastest Rate.
7. Are there any restraints impacting market growth?
4.; Privacy Concerns on the Industrial Demand Response Management Systems.
8. Can you provide examples of recent developments in the market?
Nov 2022: The Abu Dhabi Department of Economic Development (ADDED) expanded the Energy Tariff Incentive Programme (ETIP 2.0) by offering preferential rates for gas and electricity to the industrial sector based on eligibility criteria that include economic impact, Emiratisation rate, and energy management efficiency.
9. What pricing options are available for accessing the report?
Pricing options include single-user, multi-user, and enterprise licenses priced at USD 4750, USD 5250, and USD 8750 respectively.
10. Is the market size provided in terms of value or volume?
The market size is provided in terms of value, measured in Million.
11. Are there any specific market keywords associated with the report?
Yes, the market keyword associated with the report is "MEA Demand Response Management Systems Industry," which aids in identifying and referencing the specific market segment covered.
12. How do I determine which pricing option suits my needs best?
The pricing options vary based on user requirements and access needs. Individual users may opt for single-user licenses, while businesses requiring broader access may choose multi-user or enterprise licenses for cost-effective access to the report.
13. Are there any additional resources or data provided in the MEA Demand Response Management Systems Industry report?
While the report offers comprehensive insights, it's advisable to review the specific contents or supplementary materials provided to ascertain if additional resources or data are available.
14. How can I stay updated on further developments or reports in the MEA Demand Response Management Systems Industry?
To stay informed about further developments, trends, and reports in the MEA Demand Response Management Systems Industry, consider subscribing to industry newsletters, following relevant companies and organizations, or regularly checking reputable industry news sources and publications.
Methodology
Step 1 - Identification of Relevant Samples Size from Population Database


Step 2 - Approaches for Defining Global Market Size (Value, Volume* & Price*)

Note*: In applicable scenarios
Step 3 - Data Sources
Primary Research
- Web Analytics
- Survey Reports
- Research Institute
- Latest Research Reports
- Opinion Leaders
Secondary Research
- Annual Reports
- White Paper
- Latest Press Release
- Industry Association
- Paid Database
- Investor Presentations

Step 4 - Data Triangulation
Involves using different sources of information in order to increase the validity of a study
These sources are likely to be stakeholders in a program - participants, other researchers, program staff, other community members, and so on.
Then we put all data in single framework & apply various statistical tools to find out the dynamic on the market.
During the analysis stage, feedback from the stakeholder groups would be compared to determine areas of agreement as well as areas of divergence
