

Key Insights
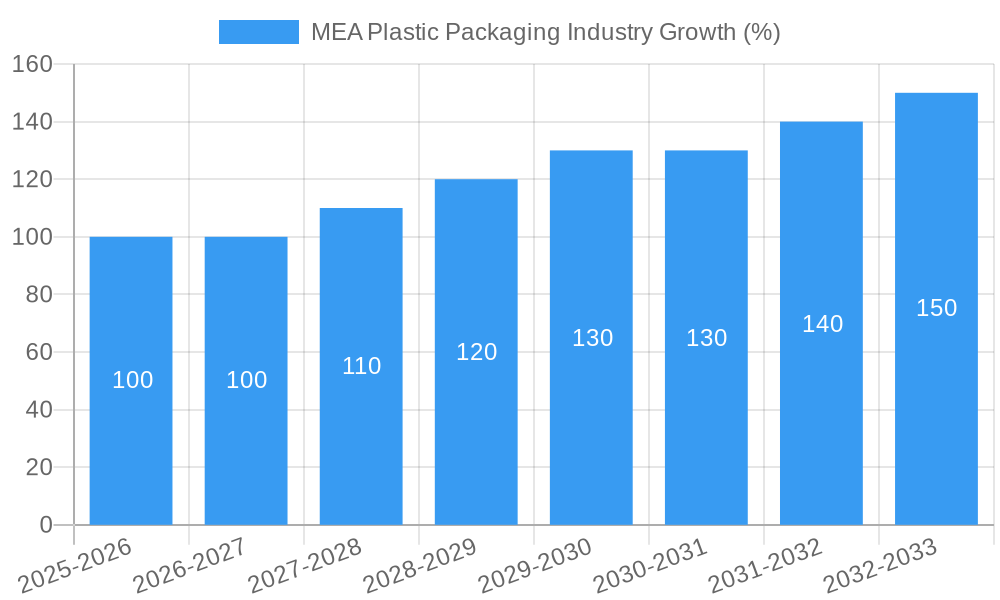
The MEA plastic packaging market, exhibiting a robust CAGR of 6.54%, presents significant growth opportunities. Driven by expanding food and beverage sectors, a burgeoning healthcare industry, and a rising population necessitating increased packaging solutions, the market is projected to experience substantial expansion throughout the forecast period (2025-2033). The increasing demand for convenience and preservation, coupled with the cost-effectiveness of plastic packaging, fuels this growth. Key segments like rigid packaging and materials such as polyethylene (PE) and polyethylene terephthalate (PET) are experiencing particularly strong demand. While the market faces challenges such as environmental concerns related to plastic waste and fluctuating raw material prices, innovative solutions like lightweight packaging and increased recycling initiatives are mitigating these restraints. Leading players like SABIC and Napco Group are leveraging technological advancements and strategic partnerships to capitalize on market opportunities and enhance their market share. Furthermore, the diversification of end-user industries, including cosmetics and personal care, contributes to the overall market dynamism. The region's economic growth and infrastructural development also provide a supportive environment for the expansion of the plastic packaging sector.
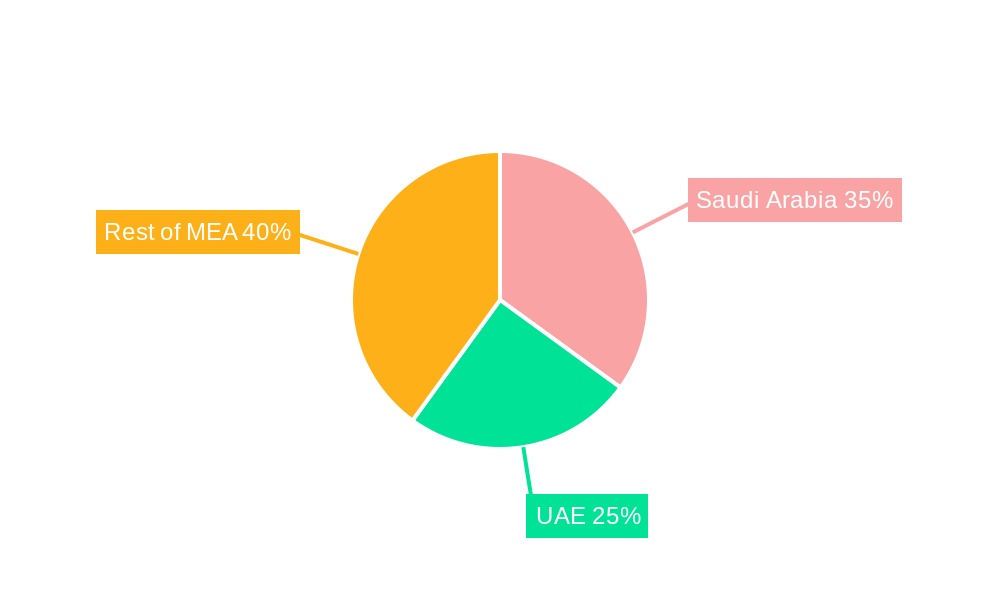
The MEA plastic packaging market's segmentation reveals further insights. The "Food" and "Beverage" end-user industries are the dominant market drivers, followed closely by the "Healthcare and Pharmaceutical" sector. Bottles and Jars, along with Tubs, Cups, Bowls, and Trays, constitute the leading product segments. The preference for rigid packaging over flexible packaging is evident, although the flexible segment demonstrates promising growth potential. Regional variations exist, with Saudi Arabia and the UAE being significant contributors to the overall market size. This necessitates a localized approach to address specific regional demands and regulatory landscapes. Future growth will rely on sustained economic growth, increasing consumer spending, and a concerted effort to address environmental concerns through sustainable packaging solutions and improved waste management strategies. The market is anticipated to showcase sustained growth trajectory fueled by factors that reinforce the dominance of plastic packaging in various industry applications.

MEA Plastic Packaging Industry: A Comprehensive Market Report (2019-2033)
This comprehensive report provides an in-depth analysis of the Middle East and Africa (MEA) plastic packaging industry, offering invaluable insights for industry professionals, investors, and strategic decision-makers. With a focus on market dynamics, growth trends, and key players, this report covers the period from 2019 to 2033, using 2025 as the base year. The report segments the market by product type, packaging type, material, and end-user industry, delivering a granular understanding of this dynamic sector. The report is structured to provide clear and concise information, facilitating easy navigation and data extraction. Market values are presented in million units.
MEA Plastic Packaging Industry Market Dynamics & Structure
The MEA plastic packaging market is characterized by a moderately concentrated landscape with several large players and numerous smaller regional companies competing for market share. Technological innovation, particularly in sustainable and recyclable materials, is a key driver, alongside evolving regulatory frameworks focused on waste reduction and environmental protection. The increasing demand from the food and beverage, healthcare, and consumer goods sectors fuels market growth, while the availability of cost-effective substitutes like paper and biodegradable alternatives poses a challenge. Mergers and acquisitions (M&A) activity is moderate, with larger companies seeking to consolidate their position and expand their product portfolios.
- Market Concentration: Moderately concentrated, with a few dominant players holding xx% of the market share in 2024.
- Technological Innovation: Focus on lightweighting, improved barrier properties, and sustainable materials. Barriers include high R&D costs and lack of access to advanced technologies in some regions.
- Regulatory Frameworks: Increasing regulations on plastic waste management and recycling are driving innovation in sustainable packaging solutions.
- Competitive Product Substitutes: Paper-based and biodegradable packaging materials represent growing competition.
- End-User Demographics: Growing middle class and rising disposable incomes across the region are driving demand.
- M&A Trends: Moderate M&A activity with a focus on strategic acquisitions to broaden product offerings and geographic reach. Approximately xx M&A deals were recorded between 2019 and 2024.
MEA Plastic Packaging Industry Growth Trends & Insights
The MEA plastic packaging market experienced significant growth during the historical period (2019-2024), driven by factors such as increasing consumption, urbanization, and economic expansion. This growth trend is expected to continue during the forecast period (2025-2033), albeit at a slightly moderated rate. The adoption of advanced packaging technologies, such as active and intelligent packaging, is gaining traction, while the rise of e-commerce fuels demand for protective packaging solutions. Consumer behavior is shifting towards sustainable and eco-friendly options, creating opportunities for companies offering recyclable and biodegradable packaging. The market is anticipated to achieve a CAGR of xx% from 2025 to 2033, reaching a market value of xx million units by 2033. Market penetration of sustainable packaging materials is expected to increase from xx% in 2024 to xx% by 2033.
Dominant Regions, Countries, or Segments in MEA Plastic Packaging Industry
The GCC countries (Saudi Arabia, UAE, etc.) currently dominate the MEA plastic packaging market, driven by robust economic growth, significant investments in infrastructure, and a burgeoning food and beverage sector. Within the product segments, bottles and jars represent the largest share, followed by pouches and flexible packaging. Polyethylene (PE) and Polyethylene Terephthalate (PET) are the dominant materials, reflecting their versatility and cost-effectiveness. The food and beverage industry remains the largest end-user, followed by the healthcare and personal care sectors.
- Key Drivers:
- Strong economic growth in GCC countries.
- Expanding food and beverage, healthcare, and consumer goods sectors.
- Growing urbanization and population.
- Favorable government policies supporting industrial development.
- Dominant Segments: Bottles & Jars (xx% market share), followed by Flexible Packaging (xx%) and PE/PET materials (xx% combined market share). The Food and Beverage sector accounts for xx% of end-user consumption.
MEA Plastic Packaging Industry Product Landscape
The MEA plastic packaging industry showcases a diverse product landscape, encompassing a wide range of packaging solutions tailored to specific applications and end-user needs. Product innovations focus on improved barrier properties, lightweighting to reduce material costs and environmental impact, and enhanced convenience features for consumers. Technological advancements include the incorporation of smart packaging technologies that provide real-time product information and track freshness, and increased use of recycled and renewable materials. Unique selling propositions include enhanced sustainability features, increased durability, improved aesthetics, and enhanced functionality.
Key Drivers, Barriers & Challenges in MEA Plastic Packaging Industry
Key Drivers: Growing consumer demand, rising disposable incomes, expanding food and beverage sector, government support for manufacturing and industrial development, and technological advancements driving efficiency and innovation.
Challenges & Restraints: Fluctuations in raw material prices (e.g. crude oil) resulting in cost volatility. Increased government regulations, environmental concerns, and increased waste management costs. Intense competition, particularly from cheaper imports, may impact margins.
Emerging Opportunities in MEA Plastic Packaging Industry
Emerging opportunities lie in the increasing demand for sustainable and eco-friendly packaging solutions, catering to growing consumer awareness of environmental issues. The growing e-commerce sector presents opportunities for protective packaging innovations. Untapped markets in less-developed regions of Africa offer potential for expansion. Innovative applications of plastic packaging, such as active and intelligent packaging, offer further growth potential.
Growth Accelerators in the MEA Plastic Packaging Industry
Long-term growth will be driven by technological advancements in sustainable packaging materials, strategic partnerships among manufacturers and retailers, and government initiatives promoting environmentally friendly practices. Expansion into untapped markets in Africa and increasing adoption of advanced packaging technologies, such as active and intelligent packaging will further drive growth. The focus on circular economy models and investment in recycling infrastructure offer significant opportunities for sustainable growth.
Key Players Shaping the MEA Plastic Packaging Industry Market
- KANR For Plastic Industries
- Al Nawakheth Factory Company
- Arabian Plastics Industrial Company Limited (APICO)
- Napco Group (Napco National)
- SABIC - Saudi Basic Industries Corporation
- Zamil Plastic Industries Co
- Sealed Air Corporation (Sealed Air Saudi Arabia)
- Takween Advanced Industries
- AL-Ghandoura Co Manuf Plastic GhanPlast
- Saudi Arabian Packaging Industry WLL (SAPIN)
- Saudi Plastic Factory Company
- Arnon Plastic Industry Co Ltd
- Plastico SPS
- Coloredsun
- National Plastic Factory LLC
- Packaging Products Company (PPC)
Notable Milestones in MEA Plastic Packaging Industry Sector
- June 2022: SABIC partners with Heinz, Tesco, and Berry on a UK recycling trial, creating certified circular polypropylene (PP) from recycled soft plastic for Heinz Beanz Snap Pots. This highlights the growing focus on sustainable packaging solutions and circular economy initiatives within the industry.
In-Depth MEA Plastic Packaging Industry Market Outlook
The MEA plastic packaging market is poised for continued growth, driven by a combination of factors including rising consumer demand, expanding industrial sectors, and technological advancements. Strategic investments in sustainable and recyclable packaging solutions will be crucial for long-term success. Companies that embrace innovation, adopt sustainable practices, and expand into new markets will be best positioned to capitalize on the significant opportunities presented by this dynamic sector. The focus on a circular economy and efficient waste management will play a key role in shaping the future of the MEA plastic packaging industry.
MEA Plastic Packaging Industry Segmentation
-
1. Packaging Type
-
1.1. Rigid
-
1.1.1. By Material
- 1.1.1.1. Polyethylene (PE)
- 1.1.1.2. Polyethylene Terephthalate (PET)
- 1.1.1.3. Polypropylene (PP)
- 1.1.1.4. Polystyrene (PS) and Expanded Polystyrene (EPS)
- 1.1.1.5. Polyvinyl Chloride (PVC)
-
1.1.2. By End-user Industry
- 1.1.2.1. Food
- 1.1.2.2. Beverage
- 1.1.2.3. Healthcare and Pharmaceutical
- 1.1.2.4. Cosmetics and Personal Care
- 1.1.2.5. Other End-user Industries
-
1.1.1. By Material
-
1.2. Flexible
- 1.2.1. Polyethene (PE)
- 1.2.2. Bi-orientated Polypropylene (BOPP)
- 1.2.3. Cast Polypropylene (CPP)
- 1.2.4. Other Flexible Plastic Packaging Materials
-
1.1. Rigid
-
2. Product
- 2.1. Bottles and Jars
- 2.2. Tubs, Cups, Bowls, and Trays
- 2.3. Intermediate Bulk Containers
- 2.4. Pouches
- 2.5. Other Products
-
3. Geography
- 3.1. United Arab Emirates
- 3.2. Saudi Arabia
- 3.3. Egypt
- 3.4. South Africa
- 3.5. Rest of Middle East and Africa
MEA Plastic Packaging Industry Segmentation By Geography
- 1. United Arab Emirates
- 2. Saudi Arabia
- 3. Egypt
- 4. South Africa
- 5. Rest of Middle East and Africa
MEA Plastic Packaging Industry REPORT HIGHLIGHTS
| Aspects | Details |
|---|---|
| Study Period | 2019-2033 |
| Base Year | 2024 |
| Estimated Year | 2025 |
| Forecast Period | 2025-2033 |
| Historical Period | 2019-2024 |
| Growth Rate | CAGR of 6.54% from 2019-2033 |
| Segmentation |
|
Table of Contents
- 1. Introduction
- 1.1. Research Scope
- 1.2. Market Segmentation
- 1.3. Research Methodology
- 1.4. Definitions and Assumptions
- 2. Executive Summary
- 2.1. Introduction
- 3. Market Dynamics
- 3.1. Introduction
- 3.2. Market Drivers
- 3.2.1. Demand for Oxo-Degradable Plastics
- 3.3. Market Restrains
- 3.3.1. Environmental Concerns Over Recycling and Safe Disposal and Price Volatility of Raw Materials
- 3.4. Market Trends
- 3.4.1. Flexible Packaging is Expected to Witness Significant Growth
- 4. Market Factor Analysis
- 4.1. Porters Five Forces
- 4.2. Supply/Value Chain
- 4.3. PESTEL analysis
- 4.4. Market Entropy
- 4.5. Patent/Trademark Analysis
- 5. Global MEA Plastic Packaging Industry Analysis, Insights and Forecast, 2019-2031
- 5.1. Market Analysis, Insights and Forecast - by Packaging Type
- 5.1.1. Rigid
- 5.1.1.1. By Material
- 5.1.1.1.1. Polyethylene (PE)
- 5.1.1.1.2. Polyethylene Terephthalate (PET)
- 5.1.1.1.3. Polypropylene (PP)
- 5.1.1.1.4. Polystyrene (PS) and Expanded Polystyrene (EPS)
- 5.1.1.1.5. Polyvinyl Chloride (PVC)
- 5.1.1.2. By End-user Industry
- 5.1.1.2.1. Food
- 5.1.1.2.2. Beverage
- 5.1.1.2.3. Healthcare and Pharmaceutical
- 5.1.1.2.4. Cosmetics and Personal Care
- 5.1.1.2.5. Other End-user Industries
- 5.1.1.1. By Material
- 5.1.2. Flexible
- 5.1.2.1. Polyethene (PE)
- 5.1.2.2. Bi-orientated Polypropylene (BOPP)
- 5.1.2.3. Cast Polypropylene (CPP)
- 5.1.2.4. Other Flexible Plastic Packaging Materials
- 5.1.1. Rigid
- 5.2. Market Analysis, Insights and Forecast - by Product
- 5.2.1. Bottles and Jars
- 5.2.2. Tubs, Cups, Bowls, and Trays
- 5.2.3. Intermediate Bulk Containers
- 5.2.4. Pouches
- 5.2.5. Other Products
- 5.3. Market Analysis, Insights and Forecast - by Geography
- 5.3.1. United Arab Emirates
- 5.3.2. Saudi Arabia
- 5.3.3. Egypt
- 5.3.4. South Africa
- 5.3.5. Rest of Middle East and Africa
- 5.4. Market Analysis, Insights and Forecast - by Region
- 5.4.1. United Arab Emirates
- 5.4.2. Saudi Arabia
- 5.4.3. Egypt
- 5.4.4. South Africa
- 5.4.5. Rest of Middle East and Africa
- 5.1. Market Analysis, Insights and Forecast - by Packaging Type
- 6. United Arab Emirates MEA Plastic Packaging Industry Analysis, Insights and Forecast, 2019-2031
- 6.1. Market Analysis, Insights and Forecast - by Packaging Type
- 6.1.1. Rigid
- 6.1.1.1. By Material
- 6.1.1.1.1. Polyethylene (PE)
- 6.1.1.1.2. Polyethylene Terephthalate (PET)
- 6.1.1.1.3. Polypropylene (PP)
- 6.1.1.1.4. Polystyrene (PS) and Expanded Polystyrene (EPS)
- 6.1.1.1.5. Polyvinyl Chloride (PVC)
- 6.1.1.2. By End-user Industry
- 6.1.1.2.1. Food
- 6.1.1.2.2. Beverage
- 6.1.1.2.3. Healthcare and Pharmaceutical
- 6.1.1.2.4. Cosmetics and Personal Care
- 6.1.1.2.5. Other End-user Industries
- 6.1.1.1. By Material
- 6.1.2. Flexible
- 6.1.2.1. Polyethene (PE)
- 6.1.2.2. Bi-orientated Polypropylene (BOPP)
- 6.1.2.3. Cast Polypropylene (CPP)
- 6.1.2.4. Other Flexible Plastic Packaging Materials
- 6.1.1. Rigid
- 6.2. Market Analysis, Insights and Forecast - by Product
- 6.2.1. Bottles and Jars
- 6.2.2. Tubs, Cups, Bowls, and Trays
- 6.2.3. Intermediate Bulk Containers
- 6.2.4. Pouches
- 6.2.5. Other Products
- 6.3. Market Analysis, Insights and Forecast - by Geography
- 6.3.1. United Arab Emirates
- 6.3.2. Saudi Arabia
- 6.3.3. Egypt
- 6.3.4. South Africa
- 6.3.5. Rest of Middle East and Africa
- 6.1. Market Analysis, Insights and Forecast - by Packaging Type
- 7. Saudi Arabia MEA Plastic Packaging Industry Analysis, Insights and Forecast, 2019-2031
- 7.1. Market Analysis, Insights and Forecast - by Packaging Type
- 7.1.1. Rigid
- 7.1.1.1. By Material
- 7.1.1.1.1. Polyethylene (PE)
- 7.1.1.1.2. Polyethylene Terephthalate (PET)
- 7.1.1.1.3. Polypropylene (PP)
- 7.1.1.1.4. Polystyrene (PS) and Expanded Polystyrene (EPS)
- 7.1.1.1.5. Polyvinyl Chloride (PVC)
- 7.1.1.2. By End-user Industry
- 7.1.1.2.1. Food
- 7.1.1.2.2. Beverage
- 7.1.1.2.3. Healthcare and Pharmaceutical
- 7.1.1.2.4. Cosmetics and Personal Care
- 7.1.1.2.5. Other End-user Industries
- 7.1.1.1. By Material
- 7.1.2. Flexible
- 7.1.2.1. Polyethene (PE)
- 7.1.2.2. Bi-orientated Polypropylene (BOPP)
- 7.1.2.3. Cast Polypropylene (CPP)
- 7.1.2.4. Other Flexible Plastic Packaging Materials
- 7.1.1. Rigid
- 7.2. Market Analysis, Insights and Forecast - by Product
- 7.2.1. Bottles and Jars
- 7.2.2. Tubs, Cups, Bowls, and Trays
- 7.2.3. Intermediate Bulk Containers
- 7.2.4. Pouches
- 7.2.5. Other Products
- 7.3. Market Analysis, Insights and Forecast - by Geography
- 7.3.1. United Arab Emirates
- 7.3.2. Saudi Arabia
- 7.3.3. Egypt
- 7.3.4. South Africa
- 7.3.5. Rest of Middle East and Africa
- 7.1. Market Analysis, Insights and Forecast - by Packaging Type
- 8. Egypt MEA Plastic Packaging Industry Analysis, Insights and Forecast, 2019-2031
- 8.1. Market Analysis, Insights and Forecast - by Packaging Type
- 8.1.1. Rigid
- 8.1.1.1. By Material
- 8.1.1.1.1. Polyethylene (PE)
- 8.1.1.1.2. Polyethylene Terephthalate (PET)
- 8.1.1.1.3. Polypropylene (PP)
- 8.1.1.1.4. Polystyrene (PS) and Expanded Polystyrene (EPS)
- 8.1.1.1.5. Polyvinyl Chloride (PVC)
- 8.1.1.2. By End-user Industry
- 8.1.1.2.1. Food
- 8.1.1.2.2. Beverage
- 8.1.1.2.3. Healthcare and Pharmaceutical
- 8.1.1.2.4. Cosmetics and Personal Care
- 8.1.1.2.5. Other End-user Industries
- 8.1.1.1. By Material
- 8.1.2. Flexible
- 8.1.2.1. Polyethene (PE)
- 8.1.2.2. Bi-orientated Polypropylene (BOPP)
- 8.1.2.3. Cast Polypropylene (CPP)
- 8.1.2.4. Other Flexible Plastic Packaging Materials
- 8.1.1. Rigid
- 8.2. Market Analysis, Insights and Forecast - by Product
- 8.2.1. Bottles and Jars
- 8.2.2. Tubs, Cups, Bowls, and Trays
- 8.2.3. Intermediate Bulk Containers
- 8.2.4. Pouches
- 8.2.5. Other Products
- 8.3. Market Analysis, Insights and Forecast - by Geography
- 8.3.1. United Arab Emirates
- 8.3.2. Saudi Arabia
- 8.3.3. Egypt
- 8.3.4. South Africa
- 8.3.5. Rest of Middle East and Africa
- 8.1. Market Analysis, Insights and Forecast - by Packaging Type
- 9. South Africa MEA Plastic Packaging Industry Analysis, Insights and Forecast, 2019-2031
- 9.1. Market Analysis, Insights and Forecast - by Packaging Type
- 9.1.1. Rigid
- 9.1.1.1. By Material
- 9.1.1.1.1. Polyethylene (PE)
- 9.1.1.1.2. Polyethylene Terephthalate (PET)
- 9.1.1.1.3. Polypropylene (PP)
- 9.1.1.1.4. Polystyrene (PS) and Expanded Polystyrene (EPS)
- 9.1.1.1.5. Polyvinyl Chloride (PVC)
- 9.1.1.2. By End-user Industry
- 9.1.1.2.1. Food
- 9.1.1.2.2. Beverage
- 9.1.1.2.3. Healthcare and Pharmaceutical
- 9.1.1.2.4. Cosmetics and Personal Care
- 9.1.1.2.5. Other End-user Industries
- 9.1.1.1. By Material
- 9.1.2. Flexible
- 9.1.2.1. Polyethene (PE)
- 9.1.2.2. Bi-orientated Polypropylene (BOPP)
- 9.1.2.3. Cast Polypropylene (CPP)
- 9.1.2.4. Other Flexible Plastic Packaging Materials
- 9.1.1. Rigid
- 9.2. Market Analysis, Insights and Forecast - by Product
- 9.2.1. Bottles and Jars
- 9.2.2. Tubs, Cups, Bowls, and Trays
- 9.2.3. Intermediate Bulk Containers
- 9.2.4. Pouches
- 9.2.5. Other Products
- 9.3. Market Analysis, Insights and Forecast - by Geography
- 9.3.1. United Arab Emirates
- 9.3.2. Saudi Arabia
- 9.3.3. Egypt
- 9.3.4. South Africa
- 9.3.5. Rest of Middle East and Africa
- 9.1. Market Analysis, Insights and Forecast - by Packaging Type
- 10. Rest of Middle East and Africa MEA Plastic Packaging Industry Analysis, Insights and Forecast, 2019-2031
- 10.1. Market Analysis, Insights and Forecast - by Packaging Type
- 10.1.1. Rigid
- 10.1.1.1. By Material
- 10.1.1.1.1. Polyethylene (PE)
- 10.1.1.1.2. Polyethylene Terephthalate (PET)
- 10.1.1.1.3. Polypropylene (PP)
- 10.1.1.1.4. Polystyrene (PS) and Expanded Polystyrene (EPS)
- 10.1.1.1.5. Polyvinyl Chloride (PVC)
- 10.1.1.2. By End-user Industry
- 10.1.1.2.1. Food
- 10.1.1.2.2. Beverage
- 10.1.1.2.3. Healthcare and Pharmaceutical
- 10.1.1.2.4. Cosmetics and Personal Care
- 10.1.1.2.5. Other End-user Industries
- 10.1.1.1. By Material
- 10.1.2. Flexible
- 10.1.2.1. Polyethene (PE)
- 10.1.2.2. Bi-orientated Polypropylene (BOPP)
- 10.1.2.3. Cast Polypropylene (CPP)
- 10.1.2.4. Other Flexible Plastic Packaging Materials
- 10.1.1. Rigid
- 10.2. Market Analysis, Insights and Forecast - by Product
- 10.2.1. Bottles and Jars
- 10.2.2. Tubs, Cups, Bowls, and Trays
- 10.2.3. Intermediate Bulk Containers
- 10.2.4. Pouches
- 10.2.5. Other Products
- 10.3. Market Analysis, Insights and Forecast - by Geography
- 10.3.1. United Arab Emirates
- 10.3.2. Saudi Arabia
- 10.3.3. Egypt
- 10.3.4. South Africa
- 10.3.5. Rest of Middle East and Africa
- 10.1. Market Analysis, Insights and Forecast - by Packaging Type
- 11. North America MEA Plastic Packaging Industry Analysis, Insights and Forecast, 2019-2031
- 11.1. Market Analysis, Insights and Forecast - By Country/Sub-region
- 11.1.1 United States
- 11.1.2 Canada
- 11.1.3 Mexico
- 12. Europe MEA Plastic Packaging Industry Analysis, Insights and Forecast, 2019-2031
- 12.1. Market Analysis, Insights and Forecast - By Country/Sub-region
- 12.1.1 Germany
- 12.1.2 United Kingdom
- 12.1.3 France
- 12.1.4 Spain
- 12.1.5 Italy
- 12.1.6 Spain
- 12.1.7 Belgium
- 12.1.8 Netherland
- 12.1.9 Nordics
- 12.1.10 Rest of Europe
- 13. Asia Pacific MEA Plastic Packaging Industry Analysis, Insights and Forecast, 2019-2031
- 13.1. Market Analysis, Insights and Forecast - By Country/Sub-region
- 13.1.1 China
- 13.1.2 Japan
- 13.1.3 India
- 13.1.4 South Korea
- 13.1.5 Southeast Asia
- 13.1.6 Australia
- 13.1.7 Indonesia
- 13.1.8 Phillipes
- 13.1.9 Singapore
- 13.1.10 Thailandc
- 13.1.11 Rest of Asia Pacific
- 14. South America MEA Plastic Packaging Industry Analysis, Insights and Forecast, 2019-2031
- 14.1. Market Analysis, Insights and Forecast - By Country/Sub-region
- 14.1.1 Brazil
- 14.1.2 Argentina
- 14.1.3 Peru
- 14.1.4 Chile
- 14.1.5 Colombia
- 14.1.6 Ecuador
- 14.1.7 Venezuela
- 14.1.8 Rest of South America
- 15. North America MEA Plastic Packaging Industry Analysis, Insights and Forecast, 2019-2031
- 15.1. Market Analysis, Insights and Forecast - By Country/Sub-region
- 15.1.1 United States
- 15.1.2 Canada
- 15.1.3 Mexico
- 16. MEA MEA Plastic Packaging Industry Analysis, Insights and Forecast, 2019-2031
- 16.1. Market Analysis, Insights and Forecast - By Country/Sub-region
- 16.1.1 United Arab Emirates
- 16.1.2 Saudi Arabia
- 16.1.3 South Africa
- 16.1.4 Rest of Middle East and Africa
- 17. Competitive Analysis
- 17.1. Global Market Share Analysis 2024
- 17.2. Company Profiles
- 17.2.1 KANR For Plastic Industries
- 17.2.1.1. Overview
- 17.2.1.2. Products
- 17.2.1.3. SWOT Analysis
- 17.2.1.4. Recent Developments
- 17.2.1.5. Financials (Based on Availability)
- 17.2.2 Al Nawakheth Factory Company
- 17.2.2.1. Overview
- 17.2.2.2. Products
- 17.2.2.3. SWOT Analysis
- 17.2.2.4. Recent Developments
- 17.2.2.5. Financials (Based on Availability)
- 17.2.3 Arabian Plastics Industrial Company Limited (APICO)
- 17.2.3.1. Overview
- 17.2.3.2. Products
- 17.2.3.3. SWOT Analysis
- 17.2.3.4. Recent Developments
- 17.2.3.5. Financials (Based on Availability)
- 17.2.4 Napco Group (Napco National)
- 17.2.4.1. Overview
- 17.2.4.2. Products
- 17.2.4.3. SWOT Analysis
- 17.2.4.4. Recent Developments
- 17.2.4.5. Financials (Based on Availability)
- 17.2.5 SABIC - Saudi Basic Industries Corporation
- 17.2.5.1. Overview
- 17.2.5.2. Products
- 17.2.5.3. SWOT Analysis
- 17.2.5.4. Recent Developments
- 17.2.5.5. Financials (Based on Availability)
- 17.2.6 Zamil Plastic Industries Co
- 17.2.6.1. Overview
- 17.2.6.2. Products
- 17.2.6.3. SWOT Analysis
- 17.2.6.4. Recent Developments
- 17.2.6.5. Financials (Based on Availability)
- 17.2.7 Sealed Air Corporation (Sealed Air Saudi Arabia)*List Not Exhaustive
- 17.2.7.1. Overview
- 17.2.7.2. Products
- 17.2.7.3. SWOT Analysis
- 17.2.7.4. Recent Developments
- 17.2.7.5. Financials (Based on Availability)
- 17.2.8 Takween Advanced Industries
- 17.2.8.1. Overview
- 17.2.8.2. Products
- 17.2.8.3. SWOT Analysis
- 17.2.8.4. Recent Developments
- 17.2.8.5. Financials (Based on Availability)
- 17.2.9 AL-Ghandoura Co Manuf Plastic GhanPlast)
- 17.2.9.1. Overview
- 17.2.9.2. Products
- 17.2.9.3. SWOT Analysis
- 17.2.9.4. Recent Developments
- 17.2.9.5. Financials (Based on Availability)
- 17.2.10 Saudi Arabian Packaging Industry WLL (SAPIN)
- 17.2.10.1. Overview
- 17.2.10.2. Products
- 17.2.10.3. SWOT Analysis
- 17.2.10.4. Recent Developments
- 17.2.10.5. Financials (Based on Availability)
- 17.2.11 Saudi Plastic Factory Company
- 17.2.11.1. Overview
- 17.2.11.2. Products
- 17.2.11.3. SWOT Analysis
- 17.2.11.4. Recent Developments
- 17.2.11.5. Financials (Based on Availability)
- 17.2.12 Arnon Plastic Industry Co Ltd
- 17.2.12.1. Overview
- 17.2.12.2. Products
- 17.2.12.3. SWOT Analysis
- 17.2.12.4. Recent Developments
- 17.2.12.5. Financials (Based on Availability)
- 17.2.13 Plastico SPS
- 17.2.13.1. Overview
- 17.2.13.2. Products
- 17.2.13.3. SWOT Analysis
- 17.2.13.4. Recent Developments
- 17.2.13.5. Financials (Based on Availability)
- 17.2.14 Coloredsun
- 17.2.14.1. Overview
- 17.2.14.2. Products
- 17.2.14.3. SWOT Analysis
- 17.2.14.4. Recent Developments
- 17.2.14.5. Financials (Based on Availability)
- 17.2.15 National Plastic Factory LLC
- 17.2.15.1. Overview
- 17.2.15.2. Products
- 17.2.15.3. SWOT Analysis
- 17.2.15.4. Recent Developments
- 17.2.15.5. Financials (Based on Availability)
- 17.2.16 Packaging Products Company (PPC)
- 17.2.16.1. Overview
- 17.2.16.2. Products
- 17.2.16.3. SWOT Analysis
- 17.2.16.4. Recent Developments
- 17.2.16.5. Financials (Based on Availability)
- 17.2.1 KANR For Plastic Industries
List of Figures
- Figure 1: Global MEA Plastic Packaging Industry Revenue Breakdown (Million, %) by Region 2024 & 2032
- Figure 2: North America MEA Plastic Packaging Industry Revenue (Million), by Country 2024 & 2032
- Figure 3: North America MEA Plastic Packaging Industry Revenue Share (%), by Country 2024 & 2032
- Figure 4: Europe MEA Plastic Packaging Industry Revenue (Million), by Country 2024 & 2032
- Figure 5: Europe MEA Plastic Packaging Industry Revenue Share (%), by Country 2024 & 2032
- Figure 6: Asia Pacific MEA Plastic Packaging Industry Revenue (Million), by Country 2024 & 2032
- Figure 7: Asia Pacific MEA Plastic Packaging Industry Revenue Share (%), by Country 2024 & 2032
- Figure 8: South America MEA Plastic Packaging Industry Revenue (Million), by Country 2024 & 2032
- Figure 9: South America MEA Plastic Packaging Industry Revenue Share (%), by Country 2024 & 2032
- Figure 10: North America MEA Plastic Packaging Industry Revenue (Million), by Country 2024 & 2032
- Figure 11: North America MEA Plastic Packaging Industry Revenue Share (%), by Country 2024 & 2032
- Figure 12: MEA MEA Plastic Packaging Industry Revenue (Million), by Country 2024 & 2032
- Figure 13: MEA MEA Plastic Packaging Industry Revenue Share (%), by Country 2024 & 2032
- Figure 14: United Arab Emirates MEA Plastic Packaging Industry Revenue (Million), by Packaging Type 2024 & 2032
- Figure 15: United Arab Emirates MEA Plastic Packaging Industry Revenue Share (%), by Packaging Type 2024 & 2032
- Figure 16: United Arab Emirates MEA Plastic Packaging Industry Revenue (Million), by Product 2024 & 2032
- Figure 17: United Arab Emirates MEA Plastic Packaging Industry Revenue Share (%), by Product 2024 & 2032
- Figure 18: United Arab Emirates MEA Plastic Packaging Industry Revenue (Million), by Geography 2024 & 2032
- Figure 19: United Arab Emirates MEA Plastic Packaging Industry Revenue Share (%), by Geography 2024 & 2032
- Figure 20: United Arab Emirates MEA Plastic Packaging Industry Revenue (Million), by Country 2024 & 2032
- Figure 21: United Arab Emirates MEA Plastic Packaging Industry Revenue Share (%), by Country 2024 & 2032
- Figure 22: Saudi Arabia MEA Plastic Packaging Industry Revenue (Million), by Packaging Type 2024 & 2032
- Figure 23: Saudi Arabia MEA Plastic Packaging Industry Revenue Share (%), by Packaging Type 2024 & 2032
- Figure 24: Saudi Arabia MEA Plastic Packaging Industry Revenue (Million), by Product 2024 & 2032
- Figure 25: Saudi Arabia MEA Plastic Packaging Industry Revenue Share (%), by Product 2024 & 2032
- Figure 26: Saudi Arabia MEA Plastic Packaging Industry Revenue (Million), by Geography 2024 & 2032
- Figure 27: Saudi Arabia MEA Plastic Packaging Industry Revenue Share (%), by Geography 2024 & 2032
- Figure 28: Saudi Arabia MEA Plastic Packaging Industry Revenue (Million), by Country 2024 & 2032
- Figure 29: Saudi Arabia MEA Plastic Packaging Industry Revenue Share (%), by Country 2024 & 2032
- Figure 30: Egypt MEA Plastic Packaging Industry Revenue (Million), by Packaging Type 2024 & 2032
- Figure 31: Egypt MEA Plastic Packaging Industry Revenue Share (%), by Packaging Type 2024 & 2032
- Figure 32: Egypt MEA Plastic Packaging Industry Revenue (Million), by Product 2024 & 2032
- Figure 33: Egypt MEA Plastic Packaging Industry Revenue Share (%), by Product 2024 & 2032
- Figure 34: Egypt MEA Plastic Packaging Industry Revenue (Million), by Geography 2024 & 2032
- Figure 35: Egypt MEA Plastic Packaging Industry Revenue Share (%), by Geography 2024 & 2032
- Figure 36: Egypt MEA Plastic Packaging Industry Revenue (Million), by Country 2024 & 2032
- Figure 37: Egypt MEA Plastic Packaging Industry Revenue Share (%), by Country 2024 & 2032
- Figure 38: South Africa MEA Plastic Packaging Industry Revenue (Million), by Packaging Type 2024 & 2032
- Figure 39: South Africa MEA Plastic Packaging Industry Revenue Share (%), by Packaging Type 2024 & 2032
- Figure 40: South Africa MEA Plastic Packaging Industry Revenue (Million), by Product 2024 & 2032
- Figure 41: South Africa MEA Plastic Packaging Industry Revenue Share (%), by Product 2024 & 2032
- Figure 42: South Africa MEA Plastic Packaging Industry Revenue (Million), by Geography 2024 & 2032
- Figure 43: South Africa MEA Plastic Packaging Industry Revenue Share (%), by Geography 2024 & 2032
- Figure 44: South Africa MEA Plastic Packaging Industry Revenue (Million), by Country 2024 & 2032
- Figure 45: South Africa MEA Plastic Packaging Industry Revenue Share (%), by Country 2024 & 2032
- Figure 46: Rest of Middle East and Africa MEA Plastic Packaging Industry Revenue (Million), by Packaging Type 2024 & 2032
- Figure 47: Rest of Middle East and Africa MEA Plastic Packaging Industry Revenue Share (%), by Packaging Type 2024 & 2032
- Figure 48: Rest of Middle East and Africa MEA Plastic Packaging Industry Revenue (Million), by Product 2024 & 2032
- Figure 49: Rest of Middle East and Africa MEA Plastic Packaging Industry Revenue Share (%), by Product 2024 & 2032
- Figure 50: Rest of Middle East and Africa MEA Plastic Packaging Industry Revenue (Million), by Geography 2024 & 2032
- Figure 51: Rest of Middle East and Africa MEA Plastic Packaging Industry Revenue Share (%), by Geography 2024 & 2032
- Figure 52: Rest of Middle East and Africa MEA Plastic Packaging Industry Revenue (Million), by Country 2024 & 2032
- Figure 53: Rest of Middle East and Africa MEA Plastic Packaging Industry Revenue Share (%), by Country 2024 & 2032
List of Tables
- Table 1: Global MEA Plastic Packaging Industry Revenue Million Forecast, by Region 2019 & 2032
- Table 2: Global MEA Plastic Packaging Industry Revenue Million Forecast, by Packaging Type 2019 & 2032
- Table 3: Global MEA Plastic Packaging Industry Revenue Million Forecast, by Product 2019 & 2032
- Table 4: Global MEA Plastic Packaging Industry Revenue Million Forecast, by Geography 2019 & 2032
- Table 5: Global MEA Plastic Packaging Industry Revenue Million Forecast, by Region 2019 & 2032
- Table 6: Global MEA Plastic Packaging Industry Revenue Million Forecast, by Country 2019 & 2032
- Table 7: United States MEA Plastic Packaging Industry Revenue (Million) Forecast, by Application 2019 & 2032
- Table 8: Canada MEA Plastic Packaging Industry Revenue (Million) Forecast, by Application 2019 & 2032
- Table 9: Mexico MEA Plastic Packaging Industry Revenue (Million) Forecast, by Application 2019 & 2032
- Table 10: Global MEA Plastic Packaging Industry Revenue Million Forecast, by Country 2019 & 2032
- Table 11: Germany MEA Plastic Packaging Industry Revenue (Million) Forecast, by Application 2019 & 2032
- Table 12: United Kingdom MEA Plastic Packaging Industry Revenue (Million) Forecast, by Application 2019 & 2032
- Table 13: France MEA Plastic Packaging Industry Revenue (Million) Forecast, by Application 2019 & 2032
- Table 14: Spain MEA Plastic Packaging Industry Revenue (Million) Forecast, by Application 2019 & 2032
- Table 15: Italy MEA Plastic Packaging Industry Revenue (Million) Forecast, by Application 2019 & 2032
- Table 16: Spain MEA Plastic Packaging Industry Revenue (Million) Forecast, by Application 2019 & 2032
- Table 17: Belgium MEA Plastic Packaging Industry Revenue (Million) Forecast, by Application 2019 & 2032
- Table 18: Netherland MEA Plastic Packaging Industry Revenue (Million) Forecast, by Application 2019 & 2032
- Table 19: Nordics MEA Plastic Packaging Industry Revenue (Million) Forecast, by Application 2019 & 2032
- Table 20: Rest of Europe MEA Plastic Packaging Industry Revenue (Million) Forecast, by Application 2019 & 2032
- Table 21: Global MEA Plastic Packaging Industry Revenue Million Forecast, by Country 2019 & 2032
- Table 22: China MEA Plastic Packaging Industry Revenue (Million) Forecast, by Application 2019 & 2032
- Table 23: Japan MEA Plastic Packaging Industry Revenue (Million) Forecast, by Application 2019 & 2032
- Table 24: India MEA Plastic Packaging Industry Revenue (Million) Forecast, by Application 2019 & 2032
- Table 25: South Korea MEA Plastic Packaging Industry Revenue (Million) Forecast, by Application 2019 & 2032
- Table 26: Southeast Asia MEA Plastic Packaging Industry Revenue (Million) Forecast, by Application 2019 & 2032
- Table 27: Australia MEA Plastic Packaging Industry Revenue (Million) Forecast, by Application 2019 & 2032
- Table 28: Indonesia MEA Plastic Packaging Industry Revenue (Million) Forecast, by Application 2019 & 2032
- Table 29: Phillipes MEA Plastic Packaging Industry Revenue (Million) Forecast, by Application 2019 & 2032
- Table 30: Singapore MEA Plastic Packaging Industry Revenue (Million) Forecast, by Application 2019 & 2032
- Table 31: Thailandc MEA Plastic Packaging Industry Revenue (Million) Forecast, by Application 2019 & 2032
- Table 32: Rest of Asia Pacific MEA Plastic Packaging Industry Revenue (Million) Forecast, by Application 2019 & 2032
- Table 33: Global MEA Plastic Packaging Industry Revenue Million Forecast, by Country 2019 & 2032
- Table 34: Brazil MEA Plastic Packaging Industry Revenue (Million) Forecast, by Application 2019 & 2032
- Table 35: Argentina MEA Plastic Packaging Industry Revenue (Million) Forecast, by Application 2019 & 2032
- Table 36: Peru MEA Plastic Packaging Industry Revenue (Million) Forecast, by Application 2019 & 2032
- Table 37: Chile MEA Plastic Packaging Industry Revenue (Million) Forecast, by Application 2019 & 2032
- Table 38: Colombia MEA Plastic Packaging Industry Revenue (Million) Forecast, by Application 2019 & 2032
- Table 39: Ecuador MEA Plastic Packaging Industry Revenue (Million) Forecast, by Application 2019 & 2032
- Table 40: Venezuela MEA Plastic Packaging Industry Revenue (Million) Forecast, by Application 2019 & 2032
- Table 41: Rest of South America MEA Plastic Packaging Industry Revenue (Million) Forecast, by Application 2019 & 2032
- Table 42: Global MEA Plastic Packaging Industry Revenue Million Forecast, by Country 2019 & 2032
- Table 43: United States MEA Plastic Packaging Industry Revenue (Million) Forecast, by Application 2019 & 2032
- Table 44: Canada MEA Plastic Packaging Industry Revenue (Million) Forecast, by Application 2019 & 2032
- Table 45: Mexico MEA Plastic Packaging Industry Revenue (Million) Forecast, by Application 2019 & 2032
- Table 46: Global MEA Plastic Packaging Industry Revenue Million Forecast, by Country 2019 & 2032
- Table 47: United Arab Emirates MEA Plastic Packaging Industry Revenue (Million) Forecast, by Application 2019 & 2032
- Table 48: Saudi Arabia MEA Plastic Packaging Industry Revenue (Million) Forecast, by Application 2019 & 2032
- Table 49: South Africa MEA Plastic Packaging Industry Revenue (Million) Forecast, by Application 2019 & 2032
- Table 50: Rest of Middle East and Africa MEA Plastic Packaging Industry Revenue (Million) Forecast, by Application 2019 & 2032
- Table 51: Global MEA Plastic Packaging Industry Revenue Million Forecast, by Packaging Type 2019 & 2032
- Table 52: Global MEA Plastic Packaging Industry Revenue Million Forecast, by Product 2019 & 2032
- Table 53: Global MEA Plastic Packaging Industry Revenue Million Forecast, by Geography 2019 & 2032
- Table 54: Global MEA Plastic Packaging Industry Revenue Million Forecast, by Country 2019 & 2032
- Table 55: Global MEA Plastic Packaging Industry Revenue Million Forecast, by Packaging Type 2019 & 2032
- Table 56: Global MEA Plastic Packaging Industry Revenue Million Forecast, by Product 2019 & 2032
- Table 57: Global MEA Plastic Packaging Industry Revenue Million Forecast, by Geography 2019 & 2032
- Table 58: Global MEA Plastic Packaging Industry Revenue Million Forecast, by Country 2019 & 2032
- Table 59: Global MEA Plastic Packaging Industry Revenue Million Forecast, by Packaging Type 2019 & 2032
- Table 60: Global MEA Plastic Packaging Industry Revenue Million Forecast, by Product 2019 & 2032
- Table 61: Global MEA Plastic Packaging Industry Revenue Million Forecast, by Geography 2019 & 2032
- Table 62: Global MEA Plastic Packaging Industry Revenue Million Forecast, by Country 2019 & 2032
- Table 63: Global MEA Plastic Packaging Industry Revenue Million Forecast, by Packaging Type 2019 & 2032
- Table 64: Global MEA Plastic Packaging Industry Revenue Million Forecast, by Product 2019 & 2032
- Table 65: Global MEA Plastic Packaging Industry Revenue Million Forecast, by Geography 2019 & 2032
- Table 66: Global MEA Plastic Packaging Industry Revenue Million Forecast, by Country 2019 & 2032
- Table 67: Global MEA Plastic Packaging Industry Revenue Million Forecast, by Packaging Type 2019 & 2032
- Table 68: Global MEA Plastic Packaging Industry Revenue Million Forecast, by Product 2019 & 2032
- Table 69: Global MEA Plastic Packaging Industry Revenue Million Forecast, by Geography 2019 & 2032
- Table 70: Global MEA Plastic Packaging Industry Revenue Million Forecast, by Country 2019 & 2032
Frequently Asked Questions
1. What is the projected Compound Annual Growth Rate (CAGR) of the MEA Plastic Packaging Industry?
The projected CAGR is approximately 6.54%.
2. Which companies are prominent players in the MEA Plastic Packaging Industry?
Key companies in the market include KANR For Plastic Industries, Al Nawakheth Factory Company, Arabian Plastics Industrial Company Limited (APICO), Napco Group (Napco National), SABIC - Saudi Basic Industries Corporation, Zamil Plastic Industries Co, Sealed Air Corporation (Sealed Air Saudi Arabia)*List Not Exhaustive, Takween Advanced Industries, AL-Ghandoura Co Manuf Plastic GhanPlast), Saudi Arabian Packaging Industry WLL (SAPIN), Saudi Plastic Factory Company, Arnon Plastic Industry Co Ltd, Plastico SPS, Coloredsun, National Plastic Factory LLC, Packaging Products Company (PPC).
3. What are the main segments of the MEA Plastic Packaging Industry?
The market segments include Packaging Type, Product, Geography.
4. Can you provide details about the market size?
The market size is estimated to be USD XX Million as of 2022.
5. What are some drivers contributing to market growth?
Demand for Oxo-Degradable Plastics.
6. What are the notable trends driving market growth?
Flexible Packaging is Expected to Witness Significant Growth.
7. Are there any restraints impacting market growth?
Environmental Concerns Over Recycling and Safe Disposal and Price Volatility of Raw Materials.
8. Can you provide examples of recent developments in the market?
June 2022: Sabic, a global leader in the chemical industry, joined forces with Heinz, Tesco, and Berry in an innovative recycling trial in the United Kingdom designed to close the loop on soft plastic food packaging. Flexible plastic packaging collected from Tesco stores has been used to produce certified circular polypropylene (PP) from Sabic's Trucircle portfolio for microwavable Heinz Beanz Snap Pots, made from 39% recycled soft plastic. Consumers are encouraged to return the soft plastic packaging to collection points at Tesco stores.
9. What pricing options are available for accessing the report?
Pricing options include single-user, multi-user, and enterprise licenses priced at USD 4750, USD 5250, and USD 8750 respectively.
10. Is the market size provided in terms of value or volume?
The market size is provided in terms of value, measured in Million.
11. Are there any specific market keywords associated with the report?
Yes, the market keyword associated with the report is "MEA Plastic Packaging Industry," which aids in identifying and referencing the specific market segment covered.
12. How do I determine which pricing option suits my needs best?
The pricing options vary based on user requirements and access needs. Individual users may opt for single-user licenses, while businesses requiring broader access may choose multi-user or enterprise licenses for cost-effective access to the report.
13. Are there any additional resources or data provided in the MEA Plastic Packaging Industry report?
While the report offers comprehensive insights, it's advisable to review the specific contents or supplementary materials provided to ascertain if additional resources or data are available.
14. How can I stay updated on further developments or reports in the MEA Plastic Packaging Industry?
To stay informed about further developments, trends, and reports in the MEA Plastic Packaging Industry, consider subscribing to industry newsletters, following relevant companies and organizations, or regularly checking reputable industry news sources and publications.
Methodology
Step 1 - Identification of Relevant Samples Size from Population Database


Step 2 - Approaches for Defining Global Market Size (Value, Volume* & Price*)

Note*: In applicable scenarios
Step 3 - Data Sources
Primary Research
- Web Analytics
- Survey Reports
- Research Institute
- Latest Research Reports
- Opinion Leaders
Secondary Research
- Annual Reports
- White Paper
- Latest Press Release
- Industry Association
- Paid Database
- Investor Presentations

Step 4 - Data Triangulation
Involves using different sources of information in order to increase the validity of a study
These sources are likely to be stakeholders in a program - participants, other researchers, program staff, other community members, and so on.
Then we put all data in single framework & apply various statistical tools to find out the dynamic on the market.
During the analysis stage, feedback from the stakeholder groups would be compared to determine areas of agreement as well as areas of divergence
