

Key Insights
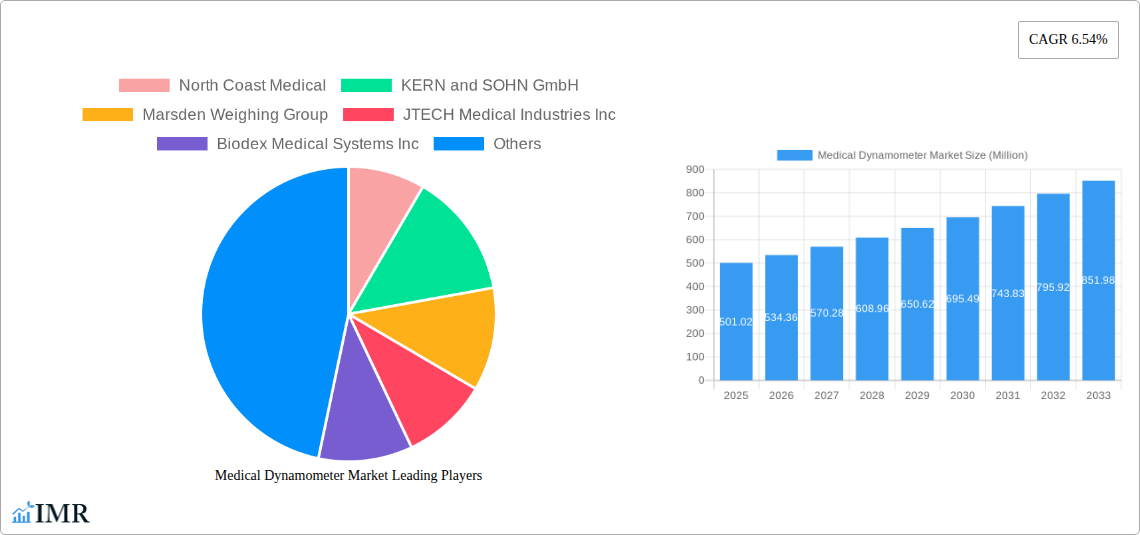
The global medical dynamometer market, valued at $501.02 million in 2025, is projected to experience robust growth, driven by a compound annual growth rate (CAGR) of 6.54% from 2025 to 2033. This expansion is fueled by several key factors. The increasing prevalence of musculoskeletal disorders, neurological conditions, and cardiovascular diseases necessitates frequent and accurate assessments of muscle strength and function, driving demand for dynamometers across hospitals, clinics, and rehabilitation centers. Furthermore, advancements in dynamometer technology, including the development of portable and user-friendly devices, are contributing to market growth. The rising adoption of these devices in sports medicine and athletic training further enhances market potential. Different product types, such as hand, chest, push-pull, and squeeze dynamometers, cater to specific diagnostic and therapeutic needs, creating diverse market segments. Geographically, North America and Europe currently hold significant market shares due to established healthcare infrastructure and high healthcare expenditure. However, the Asia-Pacific region is anticipated to witness substantial growth in the coming years due to rising healthcare awareness and increasing disposable incomes. The market is also experiencing a shift towards digital dynamometers that offer features like data logging and analysis, which are driving adoption among healthcare professionals.
Despite the promising growth trajectory, the market faces some challenges. High initial investment costs associated with advanced dynamometer technology can be a barrier for smaller clinics and healthcare providers. Additionally, the market is competitive, with several established and emerging players vying for market share. To maintain growth, companies must focus on developing innovative products, expanding their distribution networks, and fostering strategic collaborations. Regulatory approvals and stringent quality standards can also affect market entry and expansion. However, ongoing technological advancements in dynamometry and the increasing focus on personalized medicine are expected to create ample opportunities for market players. The market's future depends on continued innovation, strategic partnerships, and effective market penetration strategies, particularly in emerging economies.
This comprehensive report provides an in-depth analysis of the Medical Dynamometer Market, encompassing market dynamics, growth trends, regional analysis, product landscape, key players, and future outlook. The study covers the period from 2019 to 2033, with 2025 as the base year and a forecast period of 2025-2033. The market is segmented by usage (Hospitals/Clinics, Rehabilitation Centers, Others), product (Chest Dynamometer, Hand Dynamometer, Push Pull Dynamometer, Squeeze Dynamometer, Other Devices), and application (Orthopedic, Neurology, Cardiology, Medical Trauma, Others). The report's insights are invaluable for industry professionals, investors, and strategic decision-makers seeking to understand and capitalize on opportunities within this dynamic market. The total market size is estimated at xx Million units in 2025.
Medical Dynamometer Market Dynamics & Structure
The Medical Dynamometer Market is characterized by a moderately concentrated landscape, with several key players holding significant market share. Technological innovation, particularly in digital dynamometers and integrated systems, is a primary growth driver. Stringent regulatory frameworks governing medical devices influence market entry and product development. The market witnesses competition from substitute products, including alternative assessment methods for muscle strength. End-user demographics, such as the aging population and increasing prevalence of chronic diseases, significantly impact market demand. Mergers and acquisitions (M&A) activity has been moderate, with strategic partnerships shaping the competitive dynamics.
- Market Concentration: Moderately concentrated, with the top 5 players holding approximately xx% of the market share in 2025.
- Technological Innovation: Focus on digital dynamometers, wireless connectivity, and data analysis capabilities.
- Regulatory Framework: Compliance with FDA, CE, and other relevant regulatory standards is crucial.
- Competitive Substitutes: Alternative assessment methods, such as manual muscle testing, pose some competitive pressure.
- End-User Demographics: Aging population and increasing prevalence of neurological and orthopedic conditions drive demand.
- M&A Activity: xx M&A deals recorded between 2019 and 2024, primarily focused on strategic acquisitions to expand product portfolios and geographic reach.
Medical Dynamometer Market Growth Trends & Insights
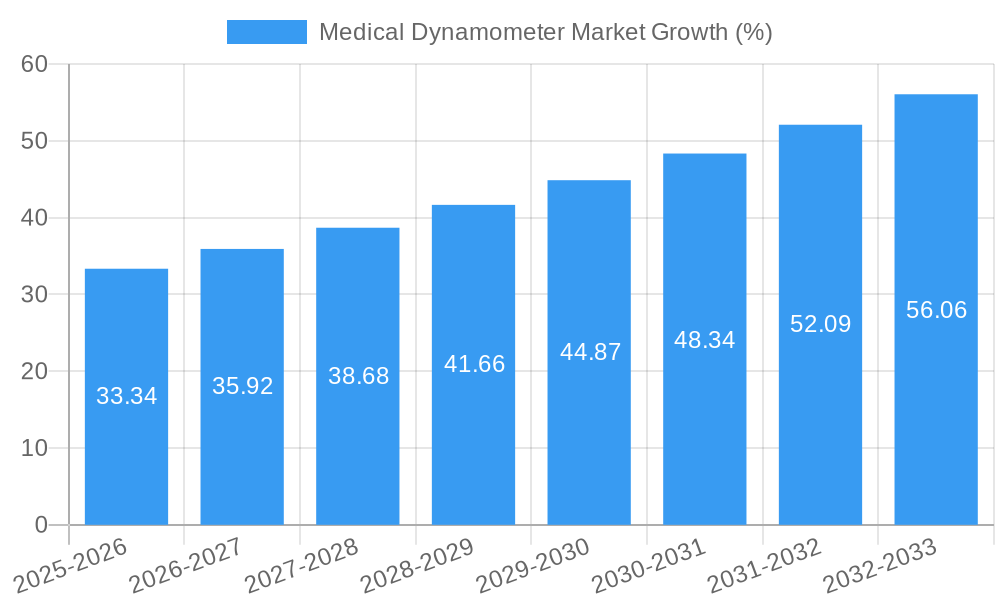
The Medical Dynamometer Market has exhibited steady growth over the historical period (2019-2024), driven by increasing healthcare expenditure, rising prevalence of chronic diseases requiring rehabilitation, and technological advancements leading to improved diagnostic accuracy and patient outcomes. The market is expected to continue this growth trajectory during the forecast period (2025-2033), with a projected Compound Annual Growth Rate (CAGR) of xx%. This growth is fueled by factors such as increasing adoption of minimally invasive procedures, rising geriatric population, and advancements in medical technology. Consumer behavior shifts towards personalized medicine and remote patient monitoring are also contributing factors. Market penetration in developing economies is expected to increase significantly.
- Market Size Evolution: From xx Million units in 2019 to xx Million units in 2024 and projected xx Million units in 2033.
- Adoption Rates: Increasing adoption in rehabilitation centers and hospitals, driven by improved efficacy and ease of use.
- Technological Disruptions: Integration of digital technologies, such as wireless connectivity and data analytics, is transforming the market.
- Consumer Behavior Shifts: Growing preference for convenient, user-friendly, and technologically advanced devices.
Dominant Regions, Countries, or Segments in Medical Dynamometer Market
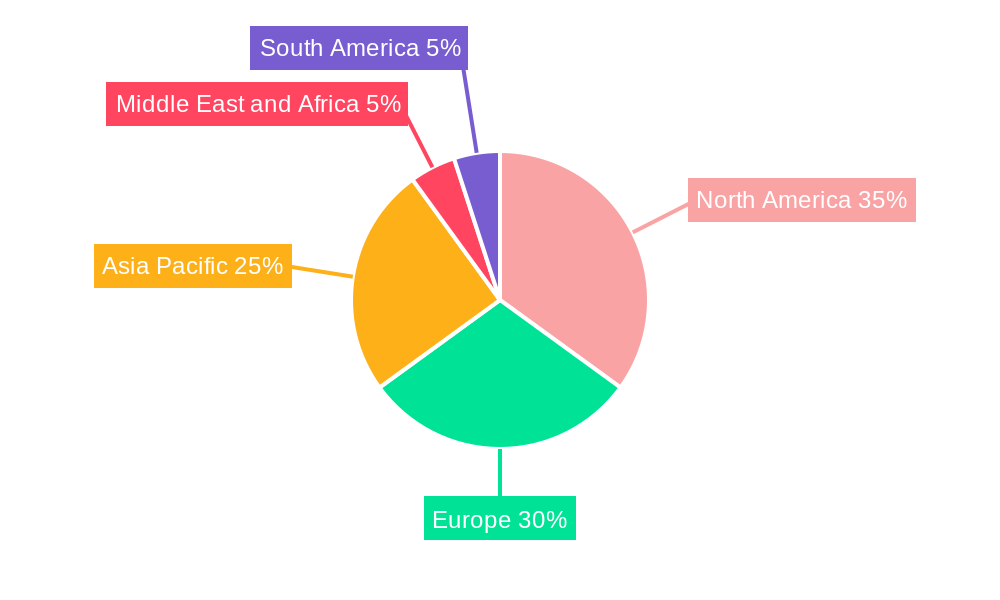
North America currently holds the largest market share in the medical dynamometer market, driven by high healthcare expenditure, advanced healthcare infrastructure, and a significant presence of key players. However, the Asia-Pacific region is projected to experience the fastest growth during the forecast period, fueled by rising healthcare awareness, increasing disposable incomes, and a burgeoning geriatric population. Within the segments, the Hospitals/Clinics segment dominates by usage, while Hand Dynamometers constitute the largest product segment. Orthopedic applications lead in terms of application-based segmentation.
- North America: High market share driven by advanced healthcare infrastructure and significant presence of key players.
- Asia-Pacific: Fastest-growing region driven by rising healthcare awareness and a growing geriatric population.
- Hospitals/Clinics Segment: Largest segment by usage due to high demand for accurate and reliable muscle strength assessment.
- Hand Dynamometers: Largest product segment due to widespread use in various medical assessments and rehabilitation programs.
- Orthopedic Applications: Leading application segment due to the high prevalence of musculoskeletal disorders requiring strength assessment.
Medical Dynamometer Market Product Landscape
Medical dynamometers are evolving from basic analog devices to sophisticated digital instruments offering features like wireless data transfer, integrated software for analysis, and improved accuracy. These advancements enhance the efficiency and effectiveness of muscle strength assessment in diverse clinical settings. Unique selling propositions include ergonomic designs, user-friendly interfaces, and robust data management capabilities. The integration of advanced technologies like Bluetooth connectivity and cloud-based data storage enables remote monitoring and facilitates seamless integration with Electronic Health Records (EHR).
Key Drivers, Barriers & Challenges in Medical Dynamometer Market
Key Drivers:
- Increasing prevalence of chronic diseases requiring rehabilitation.
- Growing demand for accurate and reliable muscle strength assessment.
- Technological advancements leading to improved accuracy and user-friendliness.
- Rising healthcare expenditure and increasing investments in healthcare infrastructure.
Key Challenges:
- High initial cost of advanced digital dynamometers can limit accessibility in resource-constrained settings.
- Stringent regulatory requirements for medical device approval can delay product launches.
- Intense competition among established players and emerging market entrants.
- Supply chain disruptions can impact product availability and pricing. The impact is estimated at xx% reduction in sales during the supply chain crisis of 2022.
Emerging Opportunities in Medical Dynamometer Market
- Expansion into untapped markets in developing economies.
- Development of innovative applications for specific patient populations.
- Integration with telehealth platforms for remote patient monitoring.
- Customization of dynamometers to meet specific clinical needs and patient preferences.
- Growth in the use of wearable sensor technology for continuous muscle strength monitoring.
Growth Accelerators in the Medical Dynamometer Market Industry
Technological breakthroughs, such as the development of more accurate and portable devices, are driving long-term growth. Strategic partnerships between medical device manufacturers and healthcare providers are creating new opportunities for market expansion. The increasing adoption of telemedicine and remote patient monitoring further fuels market growth. Government initiatives promoting healthcare infrastructure development and disease prevention programs are also contributing to the market's expansion.
Key Players Shaping the Medical Dynamometer Market Market
- North Coast Medical
- KERN and SOHN GmbH
- Marsden Weighing Group
- JTECH Medical Industries Inc
- Biodex Medical Systems Inc
- Lafayette Instrument
- Fabrication Enterprises
- Charder Electronic Co Ltd
Notable Milestones in Medical Dynamometer Market Sector
- 2020: Launch of a new wireless hand dynamometer with integrated data analysis software by Biodex Medical Systems Inc.
- 2021: Acquisition of a smaller dynamometer manufacturer by North Coast Medical, expanding its product portfolio.
- 2022: Introduction of a new range of portable chest dynamometers by Charder Electronic Co Ltd.
- 2023: Publication of several clinical studies demonstrating the effectiveness of dynamometers in assessing muscle strength recovery after injury.
In-Depth Medical Dynamometer Market Market Outlook
The Medical Dynamometer Market is poised for continued growth, driven by technological advancements, expanding applications, and increasing healthcare expenditure. Strategic partnerships, market expansion into developing economies, and the integration of dynamometers into telehealth platforms present significant opportunities for future growth. The market is projected to reach xx Million units by 2033, indicating substantial market potential for players who can effectively leverage these trends and adapt to evolving market demands.
Medical Dynamometer Market Segmentation
-
1. Product
- 1.1. Chest Dynamometer
- 1.2. Hand Dynamometer
- 1.3. Push Pull Dynamometer
- 1.4. Squeeze Dynamometer
- 1.5. Other Devices
-
2. Application
- 2.1. Orthopedic
- 2.2. Neurology
- 2.3. Cardiology
- 2.4. Medical Trauma
- 2.5. Others
-
3. Usage
- 3.1. Hospitals/Clinics
- 3.2. Rehabilitation Centers
- 3.3. Others
Medical Dynamometer Market Segmentation By Geography
-
1. North America
- 1.1. United States
- 1.2. Canada
- 1.3. Mexico
-
2. Europe
- 2.1. Germany
- 2.2. United Kingdom
- 2.3. France
- 2.4. Italy
- 2.5. Spain
- 2.6. Rest of Europe
-
3. Asia Pacific
- 3.1. China
- 3.2. Japan
- 3.3. India
- 3.4. Australia
- 3.5. South Korea
- 3.6. Rest of Asia Pacific
-
4. Middle East and Africa
- 4.1. GCC
- 4.2. South Africa
- 4.3. Rest of Middle East and Africa
-
5. South America
- 5.1. Brazil
- 5.2. Argentina
- 5.3. Rest of South America
Medical Dynamometer Market REPORT HIGHLIGHTS
| Aspects | Details |
|---|---|
| Study Period | 2019-2033 |
| Base Year | 2024 |
| Estimated Year | 2025 |
| Forecast Period | 2025-2033 |
| Historical Period | 2019-2024 |
| Growth Rate | CAGR of 6.54% from 2019-2033 |
| Segmentation |
|
Table of Contents
- 1. Introduction
- 1.1. Research Scope
- 1.2. Market Segmentation
- 1.3. Research Methodology
- 1.4. Definitions and Assumptions
- 2. Executive Summary
- 2.1. Introduction
- 3. Market Dynamics
- 3.1. Introduction
- 3.2. Market Drivers
- 3.2.1. ; Rising Incidence of Osteoporosis; Increasing Sport Related Injuries and Disorders
- 3.3. Market Restrains
- 3.3.1. ; High Cost of Devices
- 3.4. Market Trends
- 3.4.1. Hand Dynamometer is Expected to Hold the Largest Market Share in the Medical Dynamometer Market
- 4. Market Factor Analysis
- 4.1. Porters Five Forces
- 4.2. Supply/Value Chain
- 4.3. PESTEL analysis
- 4.4. Market Entropy
- 4.5. Patent/Trademark Analysis
- 5. Global Medical Dynamometer Market Analysis, Insights and Forecast, 2019-2031
- 5.1. Market Analysis, Insights and Forecast - by Product
- 5.1.1. Chest Dynamometer
- 5.1.2. Hand Dynamometer
- 5.1.3. Push Pull Dynamometer
- 5.1.4. Squeeze Dynamometer
- 5.1.5. Other Devices
- 5.2. Market Analysis, Insights and Forecast - by Application
- 5.2.1. Orthopedic
- 5.2.2. Neurology
- 5.2.3. Cardiology
- 5.2.4. Medical Trauma
- 5.2.5. Others
- 5.3. Market Analysis, Insights and Forecast - by Usage
- 5.3.1. Hospitals/Clinics
- 5.3.2. Rehabilitation Centers
- 5.3.3. Others
- 5.4. Market Analysis, Insights and Forecast - by Region
- 5.4.1. North America
- 5.4.2. Europe
- 5.4.3. Asia Pacific
- 5.4.4. Middle East and Africa
- 5.4.5. South America
- 5.1. Market Analysis, Insights and Forecast - by Product
- 6. North America Medical Dynamometer Market Analysis, Insights and Forecast, 2019-2031
- 6.1. Market Analysis, Insights and Forecast - by Product
- 6.1.1. Chest Dynamometer
- 6.1.2. Hand Dynamometer
- 6.1.3. Push Pull Dynamometer
- 6.1.4. Squeeze Dynamometer
- 6.1.5. Other Devices
- 6.2. Market Analysis, Insights and Forecast - by Application
- 6.2.1. Orthopedic
- 6.2.2. Neurology
- 6.2.3. Cardiology
- 6.2.4. Medical Trauma
- 6.2.5. Others
- 6.3. Market Analysis, Insights and Forecast - by Usage
- 6.3.1. Hospitals/Clinics
- 6.3.2. Rehabilitation Centers
- 6.3.3. Others
- 6.1. Market Analysis, Insights and Forecast - by Product
- 7. Europe Medical Dynamometer Market Analysis, Insights and Forecast, 2019-2031
- 7.1. Market Analysis, Insights and Forecast - by Product
- 7.1.1. Chest Dynamometer
- 7.1.2. Hand Dynamometer
- 7.1.3. Push Pull Dynamometer
- 7.1.4. Squeeze Dynamometer
- 7.1.5. Other Devices
- 7.2. Market Analysis, Insights and Forecast - by Application
- 7.2.1. Orthopedic
- 7.2.2. Neurology
- 7.2.3. Cardiology
- 7.2.4. Medical Trauma
- 7.2.5. Others
- 7.3. Market Analysis, Insights and Forecast - by Usage
- 7.3.1. Hospitals/Clinics
- 7.3.2. Rehabilitation Centers
- 7.3.3. Others
- 7.1. Market Analysis, Insights and Forecast - by Product
- 8. Asia Pacific Medical Dynamometer Market Analysis, Insights and Forecast, 2019-2031
- 8.1. Market Analysis, Insights and Forecast - by Product
- 8.1.1. Chest Dynamometer
- 8.1.2. Hand Dynamometer
- 8.1.3. Push Pull Dynamometer
- 8.1.4. Squeeze Dynamometer
- 8.1.5. Other Devices
- 8.2. Market Analysis, Insights and Forecast - by Application
- 8.2.1. Orthopedic
- 8.2.2. Neurology
- 8.2.3. Cardiology
- 8.2.4. Medical Trauma
- 8.2.5. Others
- 8.3. Market Analysis, Insights and Forecast - by Usage
- 8.3.1. Hospitals/Clinics
- 8.3.2. Rehabilitation Centers
- 8.3.3. Others
- 8.1. Market Analysis, Insights and Forecast - by Product
- 9. Middle East and Africa Medical Dynamometer Market Analysis, Insights and Forecast, 2019-2031
- 9.1. Market Analysis, Insights and Forecast - by Product
- 9.1.1. Chest Dynamometer
- 9.1.2. Hand Dynamometer
- 9.1.3. Push Pull Dynamometer
- 9.1.4. Squeeze Dynamometer
- 9.1.5. Other Devices
- 9.2. Market Analysis, Insights and Forecast - by Application
- 9.2.1. Orthopedic
- 9.2.2. Neurology
- 9.2.3. Cardiology
- 9.2.4. Medical Trauma
- 9.2.5. Others
- 9.3. Market Analysis, Insights and Forecast - by Usage
- 9.3.1. Hospitals/Clinics
- 9.3.2. Rehabilitation Centers
- 9.3.3. Others
- 9.1. Market Analysis, Insights and Forecast - by Product
- 10. South America Medical Dynamometer Market Analysis, Insights and Forecast, 2019-2031
- 10.1. Market Analysis, Insights and Forecast - by Product
- 10.1.1. Chest Dynamometer
- 10.1.2. Hand Dynamometer
- 10.1.3. Push Pull Dynamometer
- 10.1.4. Squeeze Dynamometer
- 10.1.5. Other Devices
- 10.2. Market Analysis, Insights and Forecast - by Application
- 10.2.1. Orthopedic
- 10.2.2. Neurology
- 10.2.3. Cardiology
- 10.2.4. Medical Trauma
- 10.2.5. Others
- 10.3. Market Analysis, Insights and Forecast - by Usage
- 10.3.1. Hospitals/Clinics
- 10.3.2. Rehabilitation Centers
- 10.3.3. Others
- 10.1. Market Analysis, Insights and Forecast - by Product
- 11. North America Medical Dynamometer Market Analysis, Insights and Forecast, 2019-2031
- 11.1. Market Analysis, Insights and Forecast - By Country/Sub-region
- 11.1.1 United States
- 11.1.2 Canada
- 11.1.3 Mexico
- 12. Europe Medical Dynamometer Market Analysis, Insights and Forecast, 2019-2031
- 12.1. Market Analysis, Insights and Forecast - By Country/Sub-region
- 12.1.1 Germany
- 12.1.2 United Kingdom
- 12.1.3 France
- 12.1.4 Italy
- 12.1.5 Spain
- 12.1.6 Rest of Europe
- 13. Asia Pacific Medical Dynamometer Market Analysis, Insights and Forecast, 2019-2031
- 13.1. Market Analysis, Insights and Forecast - By Country/Sub-region
- 13.1.1 China
- 13.1.2 Japan
- 13.1.3 India
- 13.1.4 Australia
- 13.1.5 South Korea
- 13.1.6 Rest of Asia Pacific
- 14. Middle East and Africa Medical Dynamometer Market Analysis, Insights and Forecast, 2019-2031
- 14.1. Market Analysis, Insights and Forecast - By Country/Sub-region
- 14.1.1 GCC
- 14.1.2 South Africa
- 14.1.3 Rest of Middle East and Africa
- 15. South America Medical Dynamometer Market Analysis, Insights and Forecast, 2019-2031
- 15.1. Market Analysis, Insights and Forecast - By Country/Sub-region
- 15.1.1 Brazil
- 15.1.2 Argentina
- 15.1.3 Rest of South America
- 16. Competitive Analysis
- 16.1. Global Market Share Analysis 2024
- 16.2. Company Profiles
- 16.2.1 North Coast Medical
- 16.2.1.1. Overview
- 16.2.1.2. Products
- 16.2.1.3. SWOT Analysis
- 16.2.1.4. Recent Developments
- 16.2.1.5. Financials (Based on Availability)
- 16.2.2 KERN and SOHN GmbH
- 16.2.2.1. Overview
- 16.2.2.2. Products
- 16.2.2.3. SWOT Analysis
- 16.2.2.4. Recent Developments
- 16.2.2.5. Financials (Based on Availability)
- 16.2.3 Marsden Weighing Group
- 16.2.3.1. Overview
- 16.2.3.2. Products
- 16.2.3.3. SWOT Analysis
- 16.2.3.4. Recent Developments
- 16.2.3.5. Financials (Based on Availability)
- 16.2.4 JTECH Medical Industries Inc
- 16.2.4.1. Overview
- 16.2.4.2. Products
- 16.2.4.3. SWOT Analysis
- 16.2.4.4. Recent Developments
- 16.2.4.5. Financials (Based on Availability)
- 16.2.5 Biodex Medical Systems Inc
- 16.2.5.1. Overview
- 16.2.5.2. Products
- 16.2.5.3. SWOT Analysis
- 16.2.5.4. Recent Developments
- 16.2.5.5. Financials (Based on Availability)
- 16.2.6 Lafayette Instrument*List Not Exhaustive
- 16.2.6.1. Overview
- 16.2.6.2. Products
- 16.2.6.3. SWOT Analysis
- 16.2.6.4. Recent Developments
- 16.2.6.5. Financials (Based on Availability)
- 16.2.7 Fabrication Enterprises
- 16.2.7.1. Overview
- 16.2.7.2. Products
- 16.2.7.3. SWOT Analysis
- 16.2.7.4. Recent Developments
- 16.2.7.5. Financials (Based on Availability)
- 16.2.8 Charder Electronic Co Ltd
- 16.2.8.1. Overview
- 16.2.8.2. Products
- 16.2.8.3. SWOT Analysis
- 16.2.8.4. Recent Developments
- 16.2.8.5. Financials (Based on Availability)
- 16.2.1 North Coast Medical
List of Figures
- Figure 1: Global Medical Dynamometer Market Revenue Breakdown (Million, %) by Region 2024 & 2032
- Figure 2: North America Medical Dynamometer Market Revenue (Million), by Country 2024 & 2032
- Figure 3: North America Medical Dynamometer Market Revenue Share (%), by Country 2024 & 2032
- Figure 4: Europe Medical Dynamometer Market Revenue (Million), by Country 2024 & 2032
- Figure 5: Europe Medical Dynamometer Market Revenue Share (%), by Country 2024 & 2032
- Figure 6: Asia Pacific Medical Dynamometer Market Revenue (Million), by Country 2024 & 2032
- Figure 7: Asia Pacific Medical Dynamometer Market Revenue Share (%), by Country 2024 & 2032
- Figure 8: Middle East and Africa Medical Dynamometer Market Revenue (Million), by Country 2024 & 2032
- Figure 9: Middle East and Africa Medical Dynamometer Market Revenue Share (%), by Country 2024 & 2032
- Figure 10: South America Medical Dynamometer Market Revenue (Million), by Country 2024 & 2032
- Figure 11: South America Medical Dynamometer Market Revenue Share (%), by Country 2024 & 2032
- Figure 12: North America Medical Dynamometer Market Revenue (Million), by Product 2024 & 2032
- Figure 13: North America Medical Dynamometer Market Revenue Share (%), by Product 2024 & 2032
- Figure 14: North America Medical Dynamometer Market Revenue (Million), by Application 2024 & 2032
- Figure 15: North America Medical Dynamometer Market Revenue Share (%), by Application 2024 & 2032
- Figure 16: North America Medical Dynamometer Market Revenue (Million), by Usage 2024 & 2032
- Figure 17: North America Medical Dynamometer Market Revenue Share (%), by Usage 2024 & 2032
- Figure 18: North America Medical Dynamometer Market Revenue (Million), by Country 2024 & 2032
- Figure 19: North America Medical Dynamometer Market Revenue Share (%), by Country 2024 & 2032
- Figure 20: Europe Medical Dynamometer Market Revenue (Million), by Product 2024 & 2032
- Figure 21: Europe Medical Dynamometer Market Revenue Share (%), by Product 2024 & 2032
- Figure 22: Europe Medical Dynamometer Market Revenue (Million), by Application 2024 & 2032
- Figure 23: Europe Medical Dynamometer Market Revenue Share (%), by Application 2024 & 2032
- Figure 24: Europe Medical Dynamometer Market Revenue (Million), by Usage 2024 & 2032
- Figure 25: Europe Medical Dynamometer Market Revenue Share (%), by Usage 2024 & 2032
- Figure 26: Europe Medical Dynamometer Market Revenue (Million), by Country 2024 & 2032
- Figure 27: Europe Medical Dynamometer Market Revenue Share (%), by Country 2024 & 2032
- Figure 28: Asia Pacific Medical Dynamometer Market Revenue (Million), by Product 2024 & 2032
- Figure 29: Asia Pacific Medical Dynamometer Market Revenue Share (%), by Product 2024 & 2032
- Figure 30: Asia Pacific Medical Dynamometer Market Revenue (Million), by Application 2024 & 2032
- Figure 31: Asia Pacific Medical Dynamometer Market Revenue Share (%), by Application 2024 & 2032
- Figure 32: Asia Pacific Medical Dynamometer Market Revenue (Million), by Usage 2024 & 2032
- Figure 33: Asia Pacific Medical Dynamometer Market Revenue Share (%), by Usage 2024 & 2032
- Figure 34: Asia Pacific Medical Dynamometer Market Revenue (Million), by Country 2024 & 2032
- Figure 35: Asia Pacific Medical Dynamometer Market Revenue Share (%), by Country 2024 & 2032
- Figure 36: Middle East and Africa Medical Dynamometer Market Revenue (Million), by Product 2024 & 2032
- Figure 37: Middle East and Africa Medical Dynamometer Market Revenue Share (%), by Product 2024 & 2032
- Figure 38: Middle East and Africa Medical Dynamometer Market Revenue (Million), by Application 2024 & 2032
- Figure 39: Middle East and Africa Medical Dynamometer Market Revenue Share (%), by Application 2024 & 2032
- Figure 40: Middle East and Africa Medical Dynamometer Market Revenue (Million), by Usage 2024 & 2032
- Figure 41: Middle East and Africa Medical Dynamometer Market Revenue Share (%), by Usage 2024 & 2032
- Figure 42: Middle East and Africa Medical Dynamometer Market Revenue (Million), by Country 2024 & 2032
- Figure 43: Middle East and Africa Medical Dynamometer Market Revenue Share (%), by Country 2024 & 2032
- Figure 44: South America Medical Dynamometer Market Revenue (Million), by Product 2024 & 2032
- Figure 45: South America Medical Dynamometer Market Revenue Share (%), by Product 2024 & 2032
- Figure 46: South America Medical Dynamometer Market Revenue (Million), by Application 2024 & 2032
- Figure 47: South America Medical Dynamometer Market Revenue Share (%), by Application 2024 & 2032
- Figure 48: South America Medical Dynamometer Market Revenue (Million), by Usage 2024 & 2032
- Figure 49: South America Medical Dynamometer Market Revenue Share (%), by Usage 2024 & 2032
- Figure 50: South America Medical Dynamometer Market Revenue (Million), by Country 2024 & 2032
- Figure 51: South America Medical Dynamometer Market Revenue Share (%), by Country 2024 & 2032
List of Tables
- Table 1: Global Medical Dynamometer Market Revenue Million Forecast, by Region 2019 & 2032
- Table 2: Global Medical Dynamometer Market Revenue Million Forecast, by Product 2019 & 2032
- Table 3: Global Medical Dynamometer Market Revenue Million Forecast, by Application 2019 & 2032
- Table 4: Global Medical Dynamometer Market Revenue Million Forecast, by Usage 2019 & 2032
- Table 5: Global Medical Dynamometer Market Revenue Million Forecast, by Region 2019 & 2032
- Table 6: Global Medical Dynamometer Market Revenue Million Forecast, by Country 2019 & 2032
- Table 7: United States Medical Dynamometer Market Revenue (Million) Forecast, by Application 2019 & 2032
- Table 8: Canada Medical Dynamometer Market Revenue (Million) Forecast, by Application 2019 & 2032
- Table 9: Mexico Medical Dynamometer Market Revenue (Million) Forecast, by Application 2019 & 2032
- Table 10: Global Medical Dynamometer Market Revenue Million Forecast, by Country 2019 & 2032
- Table 11: Germany Medical Dynamometer Market Revenue (Million) Forecast, by Application 2019 & 2032
- Table 12: United Kingdom Medical Dynamometer Market Revenue (Million) Forecast, by Application 2019 & 2032
- Table 13: France Medical Dynamometer Market Revenue (Million) Forecast, by Application 2019 & 2032
- Table 14: Italy Medical Dynamometer Market Revenue (Million) Forecast, by Application 2019 & 2032
- Table 15: Spain Medical Dynamometer Market Revenue (Million) Forecast, by Application 2019 & 2032
- Table 16: Rest of Europe Medical Dynamometer Market Revenue (Million) Forecast, by Application 2019 & 2032
- Table 17: Global Medical Dynamometer Market Revenue Million Forecast, by Country 2019 & 2032
- Table 18: China Medical Dynamometer Market Revenue (Million) Forecast, by Application 2019 & 2032
- Table 19: Japan Medical Dynamometer Market Revenue (Million) Forecast, by Application 2019 & 2032
- Table 20: India Medical Dynamometer Market Revenue (Million) Forecast, by Application 2019 & 2032
- Table 21: Australia Medical Dynamometer Market Revenue (Million) Forecast, by Application 2019 & 2032
- Table 22: South Korea Medical Dynamometer Market Revenue (Million) Forecast, by Application 2019 & 2032
- Table 23: Rest of Asia Pacific Medical Dynamometer Market Revenue (Million) Forecast, by Application 2019 & 2032
- Table 24: Global Medical Dynamometer Market Revenue Million Forecast, by Country 2019 & 2032
- Table 25: GCC Medical Dynamometer Market Revenue (Million) Forecast, by Application 2019 & 2032
- Table 26: South Africa Medical Dynamometer Market Revenue (Million) Forecast, by Application 2019 & 2032
- Table 27: Rest of Middle East and Africa Medical Dynamometer Market Revenue (Million) Forecast, by Application 2019 & 2032
- Table 28: Global Medical Dynamometer Market Revenue Million Forecast, by Country 2019 & 2032
- Table 29: Brazil Medical Dynamometer Market Revenue (Million) Forecast, by Application 2019 & 2032
- Table 30: Argentina Medical Dynamometer Market Revenue (Million) Forecast, by Application 2019 & 2032
- Table 31: Rest of South America Medical Dynamometer Market Revenue (Million) Forecast, by Application 2019 & 2032
- Table 32: Global Medical Dynamometer Market Revenue Million Forecast, by Product 2019 & 2032
- Table 33: Global Medical Dynamometer Market Revenue Million Forecast, by Application 2019 & 2032
- Table 34: Global Medical Dynamometer Market Revenue Million Forecast, by Usage 2019 & 2032
- Table 35: Global Medical Dynamometer Market Revenue Million Forecast, by Country 2019 & 2032
- Table 36: United States Medical Dynamometer Market Revenue (Million) Forecast, by Application 2019 & 2032
- Table 37: Canada Medical Dynamometer Market Revenue (Million) Forecast, by Application 2019 & 2032
- Table 38: Mexico Medical Dynamometer Market Revenue (Million) Forecast, by Application 2019 & 2032
- Table 39: Global Medical Dynamometer Market Revenue Million Forecast, by Product 2019 & 2032
- Table 40: Global Medical Dynamometer Market Revenue Million Forecast, by Application 2019 & 2032
- Table 41: Global Medical Dynamometer Market Revenue Million Forecast, by Usage 2019 & 2032
- Table 42: Global Medical Dynamometer Market Revenue Million Forecast, by Country 2019 & 2032
- Table 43: Germany Medical Dynamometer Market Revenue (Million) Forecast, by Application 2019 & 2032
- Table 44: United Kingdom Medical Dynamometer Market Revenue (Million) Forecast, by Application 2019 & 2032
- Table 45: France Medical Dynamometer Market Revenue (Million) Forecast, by Application 2019 & 2032
- Table 46: Italy Medical Dynamometer Market Revenue (Million) Forecast, by Application 2019 & 2032
- Table 47: Spain Medical Dynamometer Market Revenue (Million) Forecast, by Application 2019 & 2032
- Table 48: Rest of Europe Medical Dynamometer Market Revenue (Million) Forecast, by Application 2019 & 2032
- Table 49: Global Medical Dynamometer Market Revenue Million Forecast, by Product 2019 & 2032
- Table 50: Global Medical Dynamometer Market Revenue Million Forecast, by Application 2019 & 2032
- Table 51: Global Medical Dynamometer Market Revenue Million Forecast, by Usage 2019 & 2032
- Table 52: Global Medical Dynamometer Market Revenue Million Forecast, by Country 2019 & 2032
- Table 53: China Medical Dynamometer Market Revenue (Million) Forecast, by Application 2019 & 2032
- Table 54: Japan Medical Dynamometer Market Revenue (Million) Forecast, by Application 2019 & 2032
- Table 55: India Medical Dynamometer Market Revenue (Million) Forecast, by Application 2019 & 2032
- Table 56: Australia Medical Dynamometer Market Revenue (Million) Forecast, by Application 2019 & 2032
- Table 57: South Korea Medical Dynamometer Market Revenue (Million) Forecast, by Application 2019 & 2032
- Table 58: Rest of Asia Pacific Medical Dynamometer Market Revenue (Million) Forecast, by Application 2019 & 2032
- Table 59: Global Medical Dynamometer Market Revenue Million Forecast, by Product 2019 & 2032
- Table 60: Global Medical Dynamometer Market Revenue Million Forecast, by Application 2019 & 2032
- Table 61: Global Medical Dynamometer Market Revenue Million Forecast, by Usage 2019 & 2032
- Table 62: Global Medical Dynamometer Market Revenue Million Forecast, by Country 2019 & 2032
- Table 63: GCC Medical Dynamometer Market Revenue (Million) Forecast, by Application 2019 & 2032
- Table 64: South Africa Medical Dynamometer Market Revenue (Million) Forecast, by Application 2019 & 2032
- Table 65: Rest of Middle East and Africa Medical Dynamometer Market Revenue (Million) Forecast, by Application 2019 & 2032
- Table 66: Global Medical Dynamometer Market Revenue Million Forecast, by Product 2019 & 2032
- Table 67: Global Medical Dynamometer Market Revenue Million Forecast, by Application 2019 & 2032
- Table 68: Global Medical Dynamometer Market Revenue Million Forecast, by Usage 2019 & 2032
- Table 69: Global Medical Dynamometer Market Revenue Million Forecast, by Country 2019 & 2032
- Table 70: Brazil Medical Dynamometer Market Revenue (Million) Forecast, by Application 2019 & 2032
- Table 71: Argentina Medical Dynamometer Market Revenue (Million) Forecast, by Application 2019 & 2032
- Table 72: Rest of South America Medical Dynamometer Market Revenue (Million) Forecast, by Application 2019 & 2032
Frequently Asked Questions
1. What is the projected Compound Annual Growth Rate (CAGR) of the Medical Dynamometer Market?
The projected CAGR is approximately 6.54%.
2. Which companies are prominent players in the Medical Dynamometer Market?
Key companies in the market include North Coast Medical, KERN and SOHN GmbH, Marsden Weighing Group, JTECH Medical Industries Inc, Biodex Medical Systems Inc, Lafayette Instrument*List Not Exhaustive, Fabrication Enterprises, Charder Electronic Co Ltd.
3. What are the main segments of the Medical Dynamometer Market?
The market segments include Product, Application, Usage.
4. Can you provide details about the market size?
The market size is estimated to be USD 501.02 Million as of 2022.
5. What are some drivers contributing to market growth?
; Rising Incidence of Osteoporosis; Increasing Sport Related Injuries and Disorders.
6. What are the notable trends driving market growth?
Hand Dynamometer is Expected to Hold the Largest Market Share in the Medical Dynamometer Market.
7. Are there any restraints impacting market growth?
; High Cost of Devices.
8. Can you provide examples of recent developments in the market?
N/A
9. What pricing options are available for accessing the report?
Pricing options include single-user, multi-user, and enterprise licenses priced at USD 4750, USD 5250, and USD 8750 respectively.
10. Is the market size provided in terms of value or volume?
The market size is provided in terms of value, measured in Million.
11. Are there any specific market keywords associated with the report?
Yes, the market keyword associated with the report is "Medical Dynamometer Market," which aids in identifying and referencing the specific market segment covered.
12. How do I determine which pricing option suits my needs best?
The pricing options vary based on user requirements and access needs. Individual users may opt for single-user licenses, while businesses requiring broader access may choose multi-user or enterprise licenses for cost-effective access to the report.
13. Are there any additional resources or data provided in the Medical Dynamometer Market report?
While the report offers comprehensive insights, it's advisable to review the specific contents or supplementary materials provided to ascertain if additional resources or data are available.
14. How can I stay updated on further developments or reports in the Medical Dynamometer Market?
To stay informed about further developments, trends, and reports in the Medical Dynamometer Market, consider subscribing to industry newsletters, following relevant companies and organizations, or regularly checking reputable industry news sources and publications.
Methodology
Step 1 - Identification of Relevant Samples Size from Population Database


Step 2 - Approaches for Defining Global Market Size (Value, Volume* & Price*)

Note*: In applicable scenarios
Step 3 - Data Sources
Primary Research
- Web Analytics
- Survey Reports
- Research Institute
- Latest Research Reports
- Opinion Leaders
Secondary Research
- Annual Reports
- White Paper
- Latest Press Release
- Industry Association
- Paid Database
- Investor Presentations

Step 4 - Data Triangulation
Involves using different sources of information in order to increase the validity of a study
These sources are likely to be stakeholders in a program - participants, other researchers, program staff, other community members, and so on.
Then we put all data in single framework & apply various statistical tools to find out the dynamic on the market.
During the analysis stage, feedback from the stakeholder groups would be compared to determine areas of agreement as well as areas of divergence
